Abstract
Plastids have evolved from an endosymbiosis between a cyanobacterial symbiont and a eukaryotic host cell. Their division is mediated both by proteins of the host cell and conserved bacterial division proteins. Here, we identified a new component of the plastid division machinery, Arabidopsis thaliana SulA. Disruption of its cyanobacterial homolog (SSulA) in Synechocystis and overexpression of an AtSulA-green fluorescent protein fusion in Arabidopsis demonstrate that these genes are involved in cell and plastid division, respectively. Overexpression of AtSulA inhibits plastid division in planta but rescues plastid division defects caused by overexpression of AtFtsZ1-1 and AtFtsZ2-1, demonstrating that its role in plastid division may involve an interaction with AtFtsZ1-1 and AtFtsZ2-1.
INTRODUCTION
Plastids arose through endosymbiosis between a cyanobacterial ancestor and a eukaryotic host cell (McFadden, 1999). These semiautonomous organelles can divide, and their division is crucial for their maintenance after mitosis. Moreover, this seems to be a tightly regulated process because plastid number depends on the cell type (in the Landsberg ecotype of Arabidopsis thaliana, meristematic cells contain 10 to 15 plastids, whereas mesophyll cells contain 120) (Marrison et al., 1999) and is correlated with the cell area in mesophyll cells (Pyke and Leech, 1991).
In the past decade, several proteins involved in plastid division have been identified, many of which are of bacterial origin. Indeed, the first plastid division proteins to be isolated were homologs of the bacterial division protein FtsZ (Osteryoung et al., 1998). FtsZ is a tubulin-related protein (Erickson, 1997) that polymerizes at midcell, forming a ring that shrinks until division is completed (Rothfield and Justice, 1997). Involvement of FtsZ homologs in plastid division has been clearly established in Arabidopsis (AtFtsZ1-1 and AtFtsZ2-1) and the moss Physcomitrella patens (Osteryoung et al., 1998; Strepp et al., 1998; McAndrews et al., 2001).
The identification of homologs of bacterial division proteins in the Arabidopsis genome and the analysis of the accumulation and replication of chloroplasts (arc) mutants (Pyke and Leech, 1992; Marrison et al., 1999) allowed Osteryoung and Nunnari (2003) to build a model for chloroplast division. The first step seems to be the polymerization of AtFtsZ at the division site, forming the Z-ring (Vitha et al., 2001), probably stabilized by ARC6, a DnaJ domain protein (Vitha et al., 2003). Like in bacteria (Justice et al., 2000), establishment of the proper division site is mediated by AtMinD and AtMinE (Colletti et al., 2000; Itoh et al., 2001). Then, sequential assembly of the inner and outer plastid division rings (PD ring) follows. This protein scaffold was discovered by microscopic observation of dividing plastids (Miyagishima et al., 2001), but none of its components has been identified until now. The Z-ring and the PD-ring shrink, and constriction of the plastid begins. Finally, cytoplasmic dynamin related proteins, such as ARC5, are recruited at the division site on the outer membrane of the plastid (Gao et al., 2003; Miyagishima et al., 2003b). In addition, a translocase named ARTEMIS also required for plastid division and for cell division in cyanobacteria (Fulgosi et al., 2002) has been hypothesized to function in assembly of the division apparatus. Hence, plastid division is a complex phenomenon requiring cooperation between proteins of eukaryotic origin (dynamin related protein) and of bacterial origin (FtsZ, Min, and ARC6) that are now encoded by the nuclear genome and imported into plastids posttranslationally (Soll, 2002).
A search for homologs of known bacterial cell division proteins allowed us to identify a potential regulator of plastid division, AtSulA. This gene was named on the basis of its sequence similarity to bacterial cell division inhibitors. In Escherichia coli, transcription of SulA is induced by the SOS response (Huisman et al., 1984), and the corresponding protein inhibits FtsZ polymerization (Justice et al., 2000), delaying cell division until DNA damage is repaired. The function of SulA homologs was investigated in Arabidopsis and Synechocystis. This cyanobacteria is a valuable model to study plastid division. First, cyanobacteria are closely related to the ancestors of plastids: components of the plastid division machinery, namely ARC6 and ARTEMIS, can be found in cyanobacteria but not in other prokaryotes. Second, Synechocystis is neither a rod-like nor a filamentous bacterium but resembles chloroplasts by its spherical shape. Our results show that SSulA, the cyanobacterial homolog of AtSulA, is required for cell division in Synechocystis. Moreover, overexpression of AtSulA inhibits plastid division in planta and rescues plastid division defects caused by overexpression of AtFtsZ1-1 and AtFtsZ2-1, indicating that AtSulA may interact with AtFtsZ1-1 and AtFtsZ2-1 during plastid division. Finally, comparison of plants overexpressing these plastid division proteins shows that the effect of the overexpression is stochastic, independent of developmental stage, tissue, or cell type. In 35S:AtSulA-GFP (green fluorescent protein) plants, this heterogeneous phenotype correlates with unexpectedly poor accumulation of the AtSulA-GFP protein. These data suggest that as for components of the photosynthesis machinery (Choquet and Wollman, 2002), the stability of the various components involved in plastid division depends upon the correct assembly of the complex.
RESULTS
Molecular Characterization of AtSulA and SSulA
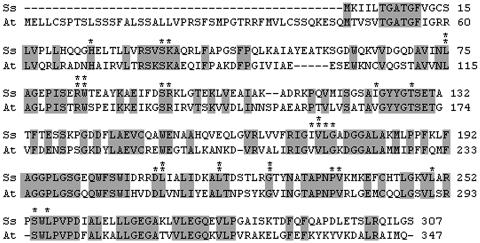
A bioinformatic search for cell-cycle inhibitors drew our interest to At2g21280. The corresponding protein shares similarities with several bacterial and cyanobacterial proteins annotated as cell division inhibitors, homologous to the E. coli cell division inhibitor SulA. This gene was therefore named AtSulA. It is a unique gene in Arabidopsis conserved in many plant species (corresponding ESTs can be found in the Chlamydomonas, maize [Zea mays], soybean [Glycine max], alfalfa [Medicago sativa], and rice [Oryza sativa] databases). The AtSulA protein shows 50% identity with the slr1223 protein of Synechocystis (SSulA) (Figure 1).
Figure 1.
Sequence Alignment between AtSulA and SSulA.
Alignment was performed using ClustalW (www.infobiogen.fr/services/analyseq/cgi-bin/clustalw.in.pl). The overall identity between AtSulA and SSulA is 50%; conserved amino acids found in the Arabidopsis, Synechocystis, and E. coli sequences are indicated by asterisks. The ones that can be found in these three sequences and in the P. aeruginosa protein are indicated by two asterisks.
Some amino acids are conserved between AtSulA and the E. coli SulA protein or the recently crystallized Pseudomonas aeruginosa SulA protein (Cordell et al., 2003) (Figure 1). AtSulA is 347 amino acids long and shows a 40–amino acid extension in its N-terminal region when compared with its cyanobacterial homolog. Bioinformatic analyses using two different programs that detect transit peptide sequences strongly suggest that AtSulA is targeted to plastids (TargetP, 0.921; Predotar, 0.990; Emanuelsson and von Heijne, 2001). Altogether, homology with the E. coli SulA protein and presence of this putative chloroplast targeting sequence are compatible with a role of AtSulA in plastid division.
Disruption of the SSulA Gene Blocks Cell Division
Evolutionary and functional relationships between plastidial and prokaryotic cell division together with the cyanobacterial origin of plastids led us first to examine the function of the Synechocystis homolog of AtSulA (SSulA). Synechocystis is particularly adequate as a model organism because disruption of defined genes can be achieved by homologous recombination (Labarre et al., 1989). Wild-type Synechocystis were transformed with a deletion cassette containing the flanking regions of SSulA (400 bp), where the slr1223 coding sequence was replaced by the NPTII gene, conferring kanamycin resistance (Kmr). Two to twelve Kmr clones were obtained for each of three different experiments. In these clones, replacement of SSulA by NPTII was assayed by PCR (data not shown). Because Synechocystis contains ∼10 copies of its chromosome, two PCRs were performed, one to check that the Kmr gene was targeted to the proper locus and one to determine whether the cells still contained wild-type copies of the gene. Indeed, all the analyzed clones were heteroploïds, and attempts to obtain full disruption of SSulA by growing the clones on higher doses of Km failed, showing that SSulA is crucial to cell survival in cyanobacteria.
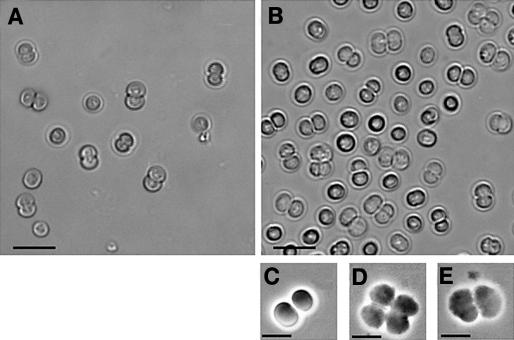
Microscopic observations of five different heteroploïd clones showed that between 10 and 40% of the cells were clustered by four in cloverleaf-like structures, revealing severe cytokinesis defects. By contrast, wild-type cells were always isolated or clustered by two during division (Figures 2A and 2C). The mutants could initiate division but were unable to complete cytokinesis: daughter cells remained attached and upon initiation of a second round of division, cloverleaf-like structures were produced (Figures 2B, 2D, and 2E). Moreover, after a few days, the clustered cells bleached and died, confirming that disruption of SSulA causes not only cell division defects but also cell death. Thus, we conclude that SSulA truly operates in cell division and is essential to cell viability.
Figure 2.
Phenotype of the Δssula::KmR/ssula + Synechocystis Mutant.
(A) Wild-type cells.
(B) Mutant. Bar = 10 μm.
(C), (D), and (E) The wild type (C) and mutants ([D] and [E]) observed using phase contrast. Bars = 5 μm.
The Expression Pattern of AtSulA Is Similar to That of Plastid Division Proteins
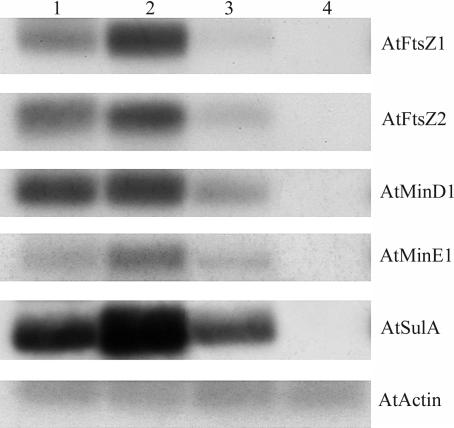
The abundance of AtSulA mRNA in several organs was monitored by RT-PCR and compared with that of plastid division genes. As shown in Figure 3, the expression level of AtSulA differs little between the different organs, except in the roots where almost no mRNA could be detected. AtFtsZ1-1, AtFtsZ2-1, AtMinD1, and AtMinE1 show similar expression patterns.
Figure 3.
Expression Level of AtSulA in Several Organs of Arabidopsis.
RT-PCR was performed with 5 μg of RNA extracted from flower buds (1), 2-week-old rosettes (2), stems (3), and roots of 2-week-old plantlets (4).
Overexpression of AtSulA Inhibits Plastid Division
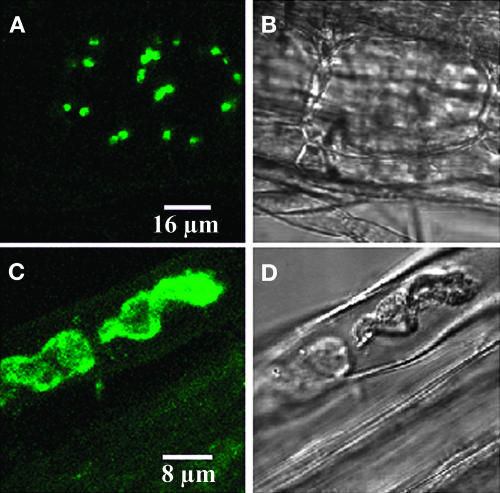
To determine the function of AtSulA, 35S:AtSulA-GFP plants were generated. To avoid the strong autofluorescence of chlorophyll, root cells of transgenic plants were observed using epifluorescence and confocal microscopy. As previously shown by transient expression experiments (data not shown), the AtSulA-GFP protein was imported into plastids in planta (Figure 4).
Figure 4.
AtSulA Is Targeted to Plastids in Planta.
Roots of 10-d-old plantlets were observed using confocal microscopy.
(A) and (C) GFP.
(B) and (D) Transmission image.
(A) and (B) Wild type–like cell. The cell at the center of this image has GFP stained plastids. The neighboring cells, however, do not seem to contain GFP.
(C) and (D) Enlarged plastids.
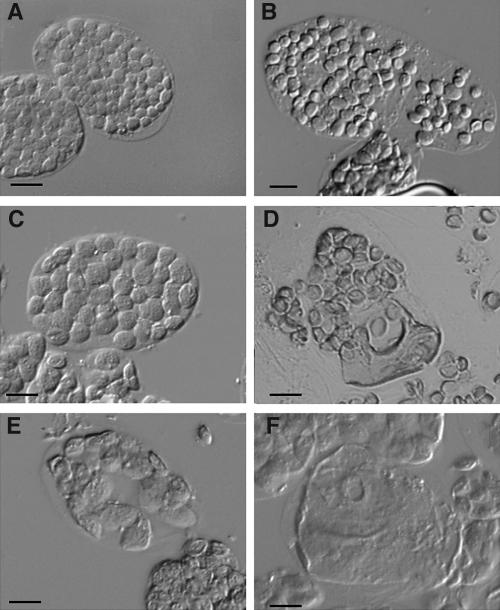
Only transgenic plants that displayed green fluorescent leucoplasts were further studied (25% of the T1 plants). Not all root cells expressed the label, but in some of these cells, giant plastids could be observed (Figures 4C and 4D). Five independent T2 lines were sorted on the basis of GFP labeling in the roots. The proportion of plants expressing GFP varied from 17 to 53% per T2 line (Table 1). After 20 d in the greenhouse, the size and number of chloroplasts were observed in isolated leaf cells of these plants and compared with mesophyll and bundle sheath cells of control plants (Wassilewskija [Ws] ecotype) grown under the same conditions (Figures 5A and 5B). The proportion of plants showing plastid division defects in each line varied between 25 and 75%. In addition, plants from a same line were not affected to the same extent (Table 1). Amongst all the observed plants (53), 27 contained an average of 80 chloroplasts in their mesophyll cells, like the wild type (Table 1), five had 40 to 60, and 11 had 10 to 40, two of which had only one chloroplast in some cells (Figures 5C, 5E, and 5F). Inhibition of plastid division was not restricted to a cell type, being observed in mesophyll cells, bundle sheath cells, and root cells (Figures 5C and 5D). Plastid division defects caused by overexpression of AtSulA in various cell types suggest that this protein is involved in plastid division.
Table 1.
Distribution of the Plants Overexpressing AtSulA in the Various Phenotype Categories
| Line | Weak | Medium | Severe | Variable in One Cell | Wild Type | Total |
|---|---|---|---|---|---|---|
| 2 | 0 | 2 | 0 | 1 | 4 | 7 |
| G6 | 1 | 1 | 2 | 1 | 11 | 16 |
| M7 | 0 | 2 | 0 | 5 | 4 | 11 |
| M11 | 3 | 3 | 0 | 3 | 3 | 12 |
| M12 | 1 | 1 | 0 | 0 | 5 | 7 |
| Total | 5 | 9 | 2 | 10 | 27 | 53 |
Isolated mesophyll cells were prepared using three different fully expanded leaves of 30-d-old plants. For each sample, at least 200 cells were observed. Because each plant could display a variety of phenotypes depending on the observed cell, the category of each plant was assigned using the most severe phenotype represented. Weak, 40 to 60 chloroplasts per mesophyll cell; medium, 10 to 40; severe, 1 to 10; variable in one cell, numerous normal chloroplasts together with one to four larger ones (5 to 20 times larger in section compared to the wild type).
Figure 5.
Overexpression of AtSulA Causes Plastid Division Defects.
(A) and (B) Single leaf cells from Ws wild type (mesophyll and bundle sheath, respectively).
(C) to (F) Plants overexpressing AtSulA. Mesophyll cells are shown in (C), (E), and (F), and a bundle sheath cell is shown in (D). Bar = 10 μm for all panels.
Surprisingly, the same leaf could contain a mixed population of mesophyll cells, some with apparently normal plastid division and some containing a few enlarged plastids. The proportion of affected cells within one plant varied from 1 to 80%. In wild-type plants, mesophyll cells containing such an abnormal number of plastids were never observed. Moreover, plastid size could vary dramatically within one cell (Figure 5D): such a phenomenon was observed in 10 of the 53 analyzed plants. Altogether, the proportion of GFP-positive (GFP+) transgenic plants that displayed plastid division defects was 48%. Amongst the 53 observed plants, none had a homogeneous phenotype. Similar observations were made in plants overexpressing AtSulA with no GFP fusion, except that the proportion of plants with a phenotype was lower because they could not be sorted on the basis of green fluorescence. This demonstrates that the inconsistency of the phenotype was not because of an impairment of AtSulA activity by the GFP fusion. Taken together, these results show that AtSulA plays a role in plastid division. However its overexpression does not seem to alter plastid division in the same way in all cells or in all plastids.
Heterogeneous Inhibition of Plastid Division Also Occurs in 35S:AtFtsZ1-1 and 35S:AtFtsZ2-1 Plants
To determine if the heterogeneity of the phenotypes observed amongst the AtSulA overexpressing plants was specific to the AtSulA protein or could be more general, we analyzed plants overexpressing the previously described AtFtsZ1-1 and AtFtsZ2-1. It has previously been reported that overexpression of either AtFtsZ1-1 or AtFtsZ2-1 results in a dominant negative effect causing severe plastid division defects (Stokes et al., 2000; McAndrews et al., 2001). In these experiments, plastid division was more or less severely affected in the different lines. Indeed, ∼20% of the plants were similar to the wild type, whereas ∼40% could contain as few as a single greatly enlarged plastid in mesophyll cells and ∼40% had an intermediate phenotype (Osteryoung et al., 1998; McAndrews et al., 2001). These authors have shown that the severity of plastid division defects correlates with the protein abundance. However, heterogeneity between the cells of one plant was not reported, possibly because the phenotypes were not analyzed throughout plant development.
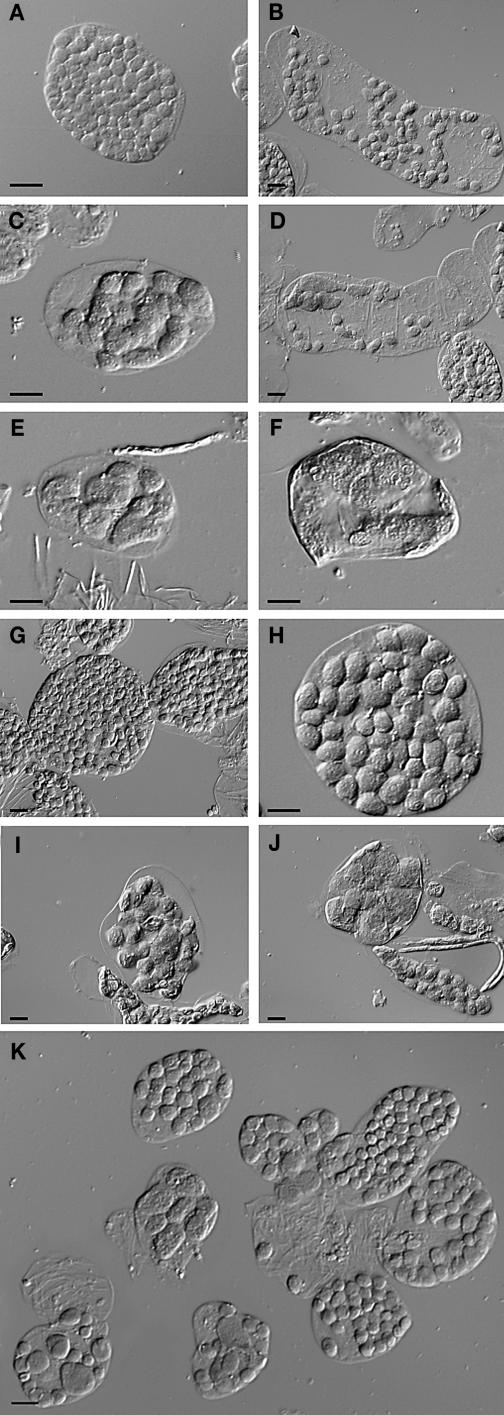
We generated 35S:AtFtsZ1-1 and 35S:AtFtsZ2-1 plants. Three independent T2 lines were analyzed for both AtFtsZ1-1 and AtFtsZ2-1. We observed more or less severe inhibition of plastid division in the transgenic plants, consistent with previous results (Osteryoung et al., 1998; McAndrews et al., 2001). Figure 6 shows control cells (mesophyll, Figure 6A; bundle sheath, Figure 6B) and cells displaying little or no plastid division defects (Figures 6C, 6G, and 6H) (∼55% of the observed plants, Table 2), intermediate phenotypes (15% of the plants), or very severe phenotypes (Figures 6D, 6E, 6F, 6I, and 6J) (22% of the plants). The proportion of severely affected plants was much lower than previously reported. Moreover, one cell could contain plastids of very different sizes. This phenomenon occurred both in bundle sheath cells (Figure 6D) and in mesophyll cells (Figure 6I) in 8% of the plants. Thus, because of overexpression of either AtFtsZ1-1 or AtFtsZ2-1, plastid division within one cell could be differentially inhibited, and two mesophyll cells of the same leaf could display very different plastid numbers. This is especially clear in Figure 6K and could never be observed in the wild type. Interestingly, the distribution of plants in the various phenotype categories (Table 2) was similar to that obtained for AtSulA overexpressing plants. Observation of other cell types, such as petal cells or stomatal guard cells, led to the same conclusion. Only a small minority of the plants with extreme plastid division defects had a homogeneous phenotype (<7%, Table 2). In most of the plants with severe plastid division defects, mesophyll cells containing as few as one chloroplast could be found amongst a majority of cells containing at least 20. In addition, the phenotype weakened during plant development. Indeed, very young seedlings were sorted by observation of their cotyledons. At that stage, almost all plantlets showed extreme plastid division defects (one or two plastids per cell in the cotyledons). However, observation of the third leaf at various developmental stages revealed that the phenotype weakened throughout plant and leaf growth.
Figure 6.
Overexpression of AtFtsZ1-1 or AtFtsZ2-1 Causes Variable Plastid Division Defects.
(A) and (B) Single cells of control plants (Ws).
(C) to (F) Single cells of plants overexpressing AtFtsZ1-1.
(G) to (J) Single cells of plants overexpressing AtFtsZ2-1.
(K) Several mesophyll cells of a plant overexpressing AtFtsZ1-1. Bars = 10 μm for all panels.
Table 2.
Distribution of 30 Plants Overexpressing AtFtsZ1-1 or AtFtsZ2-1 in the Various Phenotype Categories
| Line | Variable in One Cell | Weak | Medium | Severe | Severe in All Cells | Wild Type | Total |
|---|---|---|---|---|---|---|---|
| AF1-13 | 2 | 1 | 1 | 5 | 0 | 1 | 10 |
| AF1-21 | 2 | 1 | 0 | 1 | 3 | 3 | 10 |
| AF1-4 | 0 | 0 | 0 | 2 | 0 | 8 | 10 |
| AF2-3 | 1 | 3 | 3 | 0 | 0 | 3 | 10 |
| AF2-6 | 0 | 4 | 2 | 1 | 0 | 3 | 10 |
| AF2-10 | 0 | 2 | 3 | 0 | 1 | 4 | 10 |
| Total | 5 | 11 | 9 | 9 | 4 | 22 | 60 |
The categories are the same as for Table 1.
Approximately 60% of the T2 plants overexpressing either AtFtsZ1-1 or AtFtsZ2-1 were affected in plastid division, whereas only 48% of the AtSulA overexpressing plants had plastid division defects as stated above. Moreover, severe phenotypes were observed in only 4% of the plants overexpressing AtSulA, compared with 20% of the plants overexpressing either AtFtsZ. Although the overall effect on plastid division was more severe in 35S:AtFtsZ1-1 or 35S:AtFtsZ2-1 plants than in 35S:AtSulA-GFP plants (Table 1), overexpression of these three genes gave very similar results, namely plastid division defects varying from one plant to another and from one cell to another within the same plant.
The Variability of the Phenotype Is Independent of Transcription and Probably a Result of Low Protein Levels
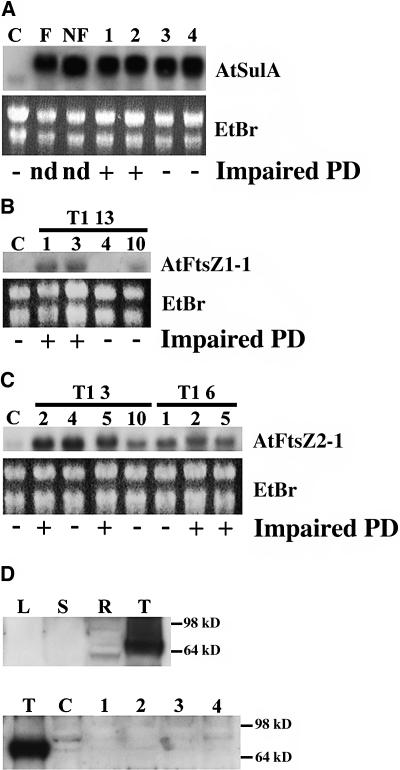
RNA gel blot analyses were performed to determine whether the presence or absence of phenotype correlated with the transcription level of the constructs. Surprisingly, the mRNA abundance of AtSulA was the same in GFP+ and GFP− plantlets and was far superior to that observed in control plants (Figure 7A). Moreover, plants showing plastid division defects and plants similar to the wild type had similar AtSulA transcript levels. The same results were obtained with 35S:AtFtsZ1-1 and 35S:AtFtsZ2-1 plants (Figures 7B and 7C, respectively), suggesting that mRNA level is not involved in the variability of the phenotype.
Figure 7.
RNA Gel Blot and Protein Gel Blot Analysis of AtSulA and AtFtsZ Overexpressing Plants.
(A) RNA gel blot analysis of 35S:AtSulA-GFP plants. C, Ws control; F, T1 plantlets with fluorescent plastids; NF, T1 plantlets without detectable GFP; 1, 2, 3, and 4, T2 plantlets from the G6 line. AtSulA transcripts appear longer in transgenic plants because of the GFP fusion. EtBr, ethidium bromide; impaired PD, impaired plastid division; nd, not determined.
(B) RNA gel blot analysis of 35S:AtFtsZ1-1 plants from the T2 progeny of T1 line 13. C, Ws control.
(C) RNA gel blot analysis of 35S:AtFtsZ2-1 plants from the T2 progeny of T1 lines 3 and 6. Total mRNA were extracted from 10-d-old plantlets and rosette leaves. Even loading was checked by ethidium bromide staining. C, Ws control.
(D) Protein gel blot analysis using anti-GFP antibodies. T, TuA-GFP plantlets (positive control); R, roots of T2 AtSulA overexpressing plants; L, leaves of T2 AtSulA overexpressing plants (line G6); S, stem.
Taking advantage of the GFP fusion, a protein gel blot analysis was performed on the 35S:AtSulA-GFP plants using anti-GFP antibodies. No signal was observed in the leaves of 35S:AtSulA-GFP plants, and a very weak signal was detectable in their roots, whereas a very strong signal was detected in control plants expressing a tubulin-GFP fusion (Ueda et al., 1999) (Figure 7D). Thus, the overall accumulation of AtSulA-GFP in 35S:AtSulA-GFP plants is very low. Moreover, the GFP labeling of root plastids varied from one cell to another within a same plant. Taken together, these results suggest that the heterogenous phenotype is attributable to variable protein accumulation in the cells: inhibition of plastid division can be observed only in the few cells that accumulate high levels of AtSulA-GFP.
Overexpression of AtSulA Can Rescue Plastid Division Defects Caused by Overexpression of AtFtsZ1-1 and AtFtsZ2-1
Overexpression of AtSulA or either AtFtsZ inhibits plastid division. Moreover, in E. coli, SulA inhibits FtsZ polymerization through direct interaction. Yet, AtSulA does not interact with either AtFtsZ protein in the yeast two-hybrid system (data not shown). To determine whether overexpression of AtSulA can alter the phenotype of 35S:AtFtsZ1-1 plants, plants overexpressing both AtSulA and AtFtsZ1-1 were generated. As described previously, isolated cells from T2 35S:AtFtsZ1-1 plants were observed. Eight plants with severe plastid division defects were chosen from the AF1-21 line (Table 2) and retransformed with a 35S:AtSulA construct. To select the retransformed plants, the seeds of each plant were harvested individually and sown on medium containing Km. A few seeds of each line were also germinated on nonselective medium. Because the proportion of Kmr plantlets was ∼2%, the 12 plantlets grown on nonselective medium could be assumed not to be retransformed with the 35S:AtSulA construct. After 10 d, the phenotypes of Kmr plantlets were compared with that of plantlets grown on nonselective medium. For each line, isolated cells were prepared from cotyledons of 12 Kmr plantlets and 12 plantlets grown on nonselective medium. This allowed us to assess the proportion of wild type–like (WTL) plants amongst the transformed plantlets. Whole cotyledons were observed, and the plants were considered to be WTL only when none of the cells showed plastid division defects. As shown in Table 3, the proportion of WTL plants for each line was higher in plants overexpressing AtFtsZ1-1 together with AtSulA than in plants overexpressing AtFtsZ1-1 alone. Efficient overexpression of AtFtsZ1-1 in the WTL plants was monitored by RNA gel blot analysis and allowed us to assume that the presence of two 35S promoters did not cause gene silencing in these plants (data not shown).
Table 3.
Proportion of WTL Plants amongst Plantlets Overexpressing AtFtsZ1-1 and AtSulA or AtFtsZ1-1 Alone
| T3 Line | 12 | 13 | 24 | 28 | 31 | 44 | 45 | 56 |
|---|---|---|---|---|---|---|---|---|
| AtFtsZ1-1 | 6/12 | 2/12 | 3/12 | 0/12 | 1/12 | 2/12 | 3/12 | 6/12 |
| AtFtsZ1-1 + AtSulA | 9/12 | 5/12 | 9/12 | 6/12 | 4/12 | 6/12 | 7/12 | 6/12 |
Plants were considered to be WTL if no division defects could be observed in a whole cotyledon; variability of phenotypes amongst the plants that showed plastid division defects was not taken into account.
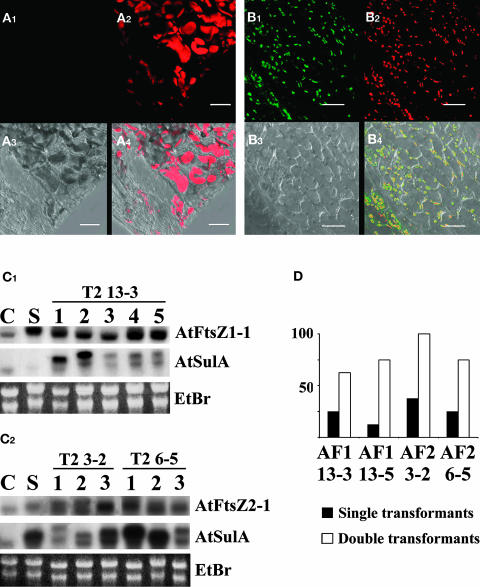
To follow overexpression of AtSulA at the protein level in double transformants, the same experiment as above was performed using the AtSulA-GFP fusion. Moreover, we generated plants overexpressing AtSulA-GFP together with AtFtsZ1-1 or AtFtsZ2-1. We retransformed plants with plastid division defects from the following T2 lines: AtFtsZ1-13, AtFtsZ2-3, and AtFtsZ2-6 (Table 2). RNA gel blot analysis revealed that WTL plants overexpressed AtFtsZ and AtSulA (Figure 8C). The phenotypes of double transformants were compared with that of single transformants. Microscopy revealed that double transformants expressed GFP at a much higher frequency than plants transformed with AtSulA alone (60 to 80% versus only 25% in the single transformants). Moreover, the GFP labeling was very homogeneous and could be observed in all cells of the double transformants, in contrast with the few labeled cells of 35S:AtSulA-GFP single transformants. Petals of double transformants and single transformants from each line were observed using confocal microscopy. As previously observed, overexpression of AtSulA-GFP restored a WTL phenotype in most of the plants (Figures 8A and 8B) both in 35S:AtFtsZ1-1 and 35S:AtFtsZ2-1 plants. As shown on Figure 8D, the proportion of WTL plants was higher in double transformants than in single transformants in each of the four analyzed lines. In addition, the rescue of the phenotype correlated with homogeneous GFP staining in plastids.
Figure 8.
35S:AtSulA-GFP Rescues 35S:AtFtsZ1-1 and 35S:AtFtsZ2-1 Induced Plastid Division Defects.
(A) and (B) Petals of single 35S:AtFtsZ transformants and of double 35S:AtFtsZ and 35S:AtSulA-GFP were observed using a confocal microscope. Bar = 20 μm.
(A) Petal of a 35S:AtFtsZ2-1 T3 progeny of the T2 6-5 single transformant. GFP fluorescence (A1), chlorophyll autofluorescence (A2), transmission (A3), and merge (A4).
(B) Petal of double transformants 35S:AtFtsZ2-1 and 35S:AtSulA-GFP from the same line. GFP fluorescence (B1), chlorophyll autofluorescence (B2), transmission (B3), and merge (B4).
(C) RNA gel blot. Transcript abundance of AtSulA and AtFtsZ1-1 in the progeny of the T2 35S:AtFtsZ1-1 line 13-3 retransformed with 35S:AtSulA-GFP (C1). C, Ws control; S, 35S:AtFtsZ1-1 single transformant. Transcript abundance of AtSulA and AtFtsZ2-1 in the progeny of the T2 lines 35S:AtFtsZ2-1 3-2 and 6-5 retransformed with AtSulA-GFP (C2). C, Ws control; S, 35S:AtSulA-GFP single transformant. AtSulA transcripts appear longer in transgenic plants because of the GFP fusion.
(D) Comparison between the proportion of WTL plants in double transformants and single transformants. Leaves of eight plants from each category were observed using an epifluorescence microscope.
DISCUSSION
Evolved from cyanobacterial endosymbionts (McFadden, 1999), plastids divide by binary fission. Cooperation of proteins of eukaryotic and bacterial origin mediates plastid division through assembly of a complex protein scaffold, which is likely to contain many yet unidentified proteins (Miyagishima et al., 2003a). In this work, we present evidence that Arabidopsis and cyanobacterial proteins related to the E. coli cell-division inhibitor SulA are involved in plastid and cyanobacterial cell division, respectively.
The AtSulA mRNA is abundant in organs containing actively dividing plastids (leaves, stems, and flower buds) and almost undetectable in roots. This expression pattern is similar to that of other plastid division proteins, AtFtsZ1-1, AtFtsZ2-1, AtMinD1, AtMinE1, and ARTEMIS (Fulgosi et al., 2002), which suggests that AtSulA could be involved in the same process.
Null mutants in AtSulA are not available. However, we were able to examine the loss-of-function phenotype of its homolog in Synechocystis by gene disruption. Disruption of SSulA resulted in cell division defects: the cells remained blocked at a late stage of division and initiated a second division, resulting in the formation of cloverleaf-like structures. This phenotype resembles very much the one induced by disruption of ARTEMIS (Fulgosi et al., 2002), which also induces formation of cell clusters, often made of four cells. The SSulA protein is therefore indispensable to separation of daughter cells. It is also essential to cell survival, like Synechocystis FtsZ but unlike the MinCDE proteins (Mazouni et al., 2004). These data suggest that the function of SSulA has diverged from that of E. coli SulA. Indeed, overexpression of the bacterial cell-division inhibitor SulA causes filamentous growth in E. coli (Huisman et al., 1984), but mutation of SulA induces no phenotype under normal growth conditions in E. coli. On the contrary, disruption of SSulA impairs cell division, showing that the corresponding protein is necessary for cell division at variance with SulA.
AtSulA is a plastid-targeted protein, and its overexpression in planta causes severe although stochastic plastid division defects. Various studies have demonstrated that the stoichiometry of components of the plastid division machinery influences its functionality. Indeed overexpression of the plastid division protein AtFtsZ1-1, AtFtsZ2-1, or ARC6 inhibits plastid division dramatically (Stokes et al., 2000; McAndrews et al., 2001; Vitha et al., 2003). The strong similarities between the phenotypes induced by overexpression of AtSulA and known plastid division proteins suggest that AtSulA is part of the plastid division machinery.
Variable phenotypes were obtained by overexpressing AtFtsZ1-1 and AtFtsZ2-1, showing that the inconsistency of the phenotype is not a specificity of AtSulA. In 35S:AtSulA-GFP plants, transcripts accumulate at very high levels, whereas the AtSulA-GFP protein does not, indicating a translational or posttranslational regulation of the transgene expression. Moreover, we have shown previously that overexpression of the NtKIS cell-cycle inhibitor fused to GFP results in homogeneous GFP staining in all cells throughout plant development (Jasinski et al., 2002). Therefore, the heterogeneity of AtSulA-GFP accumulation between cells does not result from variation of transgene transcription from one cell to another. Numerous studies have highlighted diverse mechanisms that coordinate expression of nuclear and plastidial genes involved in an identical process (Barkan and Goldschmidt-Clermont, 2000; Choquet and Wollman, 2002; Gray et al., 2003). Moreover, unassembled subunits of the same complex can be degraded as a consequence of their biochemical instability in the absence of their partners (Kuras and Wollman, 1994). Even though such a phenomenon has only been described for the subunits of multimeric enzymes or photosynthesis complexes until now, it could also exist for components of the plastid division machinery. Thus, the overexpressed proteins could be degraded because they are more abundant than their partners. Indeed, AtFtsZ overexpression allows increased accumulation of AtSulA-GFP in all plastids: accumulation of AtSulA depends on the abundance of other plastid division proteins, suggesting that the relative abundance of plastid division proteins is tightly regulated.
Finally, overexpression of AtSulA can rescue plastid division defects induced by overexpression of AtFtsZ1-1 and AtFtsZ2-1. This indicates that, in planta, these three proteins play a role in the same pathway. AtSulA could be a component of the PD-ring interacting directly with AtFtsZ proteins. In this case, its overexpression might balance the overexpression of AtFtsZ1-1 and AtFtsZ2-1 by mere titration. Alternatively, AtSulA could, like the E. coli protein, influence the polymerization of AtFtsZ1-1 and AtFtsZ2-1. More precisely, it could be involved in the shrinking of the Z-ring during plastokinesis. The latter hypothesis is more compatible with the phenotype of the Synechocystis null mutants in which cytokinesis remains blocked after constriction has begun.
Taken together, data presented here prove that AtSulA operates in plastid division and that SSulA is required for cell division in Synechocystis. Further experiments will help to clarify the exact relationships between AtSulA and AtFtsZ at the molecular level.
METHODS
Transgene Construct
Oligonucleotides SulAF (5′-CCTCTAGATGGAGCTTCTCTGCTCACCAACGTCTC-3′) and SulAR (5′-CCGTCGACTTGCATAATGGCTCTGAGTGCATCCTTCACG-3′) were used for RT-PCR cloning of the coding region of AtSulA (At2g21280) using Pfx DNA polymerase (Gibco BRL, Cleveland, OH). The cDNA was sequenced and cloned between the XbaI and SalI sites of pBI/GFP (Jasinski et al., 2003). The PstI-EcoRI fragment (35S:AtSulA-GFPter35S) obtained by partial digestion was also transferred into a binary vector (pZP111; Hajdukiewicz et al., 1994). The full-length cDNA encoding AtSulA was also cloned between the XbaI and SalI sites of a modified pZP111 vector containing a 35S promoter and terminator. The 5′ and 3′ flanking regions of SSulA (slr1223) were cloned in PGEM-T (Promega, Madison, WI) using the following primers: SSulA5′pro, 5′-ATTTCCCTAATTTGATCCCCCTGG-3′; SSulA5′rev, 5′-TTGAATTCGTGACCAACTGGCCATGACC-3′; SSulA3′pro, 5′-CAGAATTCCCCAAAATAGCCCCA-3′; SSulA3′rev, 5′-TGGTAATGCCCCGTAAACTGTCCCCTA-3′. The EcoRI site allowed us to add the NPTII gene taken from the pUC4K (Pharmacia, Orsay, France) plasmid.
The coding regions of AtFtsZ1-1 (At5g55280) and AtFtsZ2-1 (At2g36250) were cloned using the following oligonucleotides: 5′-TTGTCGACCAATGGCGATAATTCCGTTAGCAC-3′ and 5′-TTCTCGAGACTAGAAGAAAAGTCTACGGGGAG-3′ for AtFtsZ1-1; 5′-CCGTCGACCCATGGCAACTTACGTTTCACCG-3′ and 5′-TTCTCGAGATTAGACTCGGGGATAACGAGAGCTGCC-3′ for AtFtsZ2-1. cDNAs were sequenced and cloned at the SalI site of a modified pGreen0229 (Hellens et al., 2000) vector containing a 35S promoter and terminator. The first 500 bp of AtMinD1 (At5g24020) and AtMinE1 (At1g69390) were cloned using 5′-TCATGGCGTCTCTGAGATTGTTC-3′ and 5′-CGGATGATGATGAAATCCGGTG-3′ and 5′- GGATGGCGATGTCTTCTGGAA-3′ and 5′-ACGTAAATGGTCCCAAGGTCACC-3′, respectively. The fragments were sequenced and used as probes for RT-PCR analysis.
Disruption of the slr1223 Locus in Synechocystis
Synechocystis sp strain PCC6803 was grown at 30°C in BG11 medium enriched with Na2CO3 (3.78 mM, final concentration) under continuous white light of standard fluence (2500 luxes, i.e., 31.25 μE·m−2·s−1). Cells were transformed as described (Labarre et al., 1989).
Plant Growth and Transformation
pPZP111 encoding AtSulA-GFP was introduced into Agrobacterium tumefaciens (EHA 105; Hellens et al., 2000). Arabidopsis thaliana plants, (Ws) were transformed as described by Clough and Bent (1998). The seeds from the T1 and T2 generations were selected on 0.5× MS medium containing 50 mg/mL of Km. After 2 weeks, Kmr plantlets were transferred to nonselective medium, and their roots were observed using epifluorescence microscopy. Plantlets expressing GFP were transferred to soil in the greenhouse under short-day conditions for 2 weeks, then under long-day conditions, and their phenotype was further analyzed. Plants were transformed with AtFtsZ1-1 or AtFtsZ2-1 using the AGL-1 (Lazo et al., 1991) strain of Agrobacterium and were sown on sand for BASTA selection. Plantlets were transferred to soil after 15 d.
Isolated Leaf Cell Preparation
Fully expanded leaves were harvested on 30-d-old plants. Isolated cells were obtained and observed as described (Pyke and Leech, 1991), except that leaf sections were fixed in 2% paraformaldehyde for 2 h.
Microscopy
Images of Arabidopsis isolated cells and Synechocystis cells were captured with a Zeiss Axioshop microscope equipped with a Sony PowerHAD camera (Paris, France) and the Axiovision 1.01 (Zeiss, Jena, Germany) software. Images of GFP stained cells were captured on a confocal microscope (Leica TCS SP2; Rueil-Malmaison, France). GFP fluorescence was imaged between 504 and 530 nm and chlorophyll autofluorescence between 650 and 750 nm.
RNA Isolation, RNA Gel Blot, and RT-PCR Analysis
RNA extraction and RNA gel blot analysis were performed as described previously (Perennes et al., 1999). For RT-PCR analysis, first-strand cDNA was synthesized from 5 μg of total RNA using Superscript II RNase H-Reverse transcriptase (Life Technologies, Cergy Pontoise, France) following the manufacturer's instructions. Two microliters were used for PCR in a final volume of 20 μL. PCR products were run on a 1% agarose gel and transferred to a Hybond N+ membrane (Amersham, Orsay, France) with NaOH (50 mM). Hybridizations were performed at 62°C in the buffer described in Church and Gilbert (1984). The probe for AtSulA consists of the full-length cDNA, and the probes for AtFtsZ1-1, AtFtsZ2-1, AtMinD1, and AtMinE1 consist of the first 500 bp.
Protein Gel Blotting
Young leaves (100 mg) and roots of Arabidopsis plants were ground in 100 μL of 4× NuPAGE LDS buffer (Invitrogen, Carlsbad, CA). Fifteen microliters of each sample were run on NuPAGE 12% Bis-Tris gels (Invitrogen) following the manufacturer's instructions. Proteins were transferred to 0.2-μm nitrocellulose membranes (Merck, Rahway, NJ) following the manufacturer's instructions (Xcell II; Invitrogen), and even loading was visualized by ponceau-red (Carlo-Erba) staining (0.1% in 5% acetic acid). Membranes were further treated as described in the ECL+Plus system protocol (Amersham). The primary antibody was an anti-GFP antibody (F. Schmitt, unpublished data), and the secondary one was a goat anti-rabbit peroxidase conjugated antibody (Amersham). Detection of the target protein was performed by chemiluminescence using the ECL+Plus system.
Sequence data from this article have been deposited with the EMBL/GenBank data libraries under accession numbers NP440827 (Synechocystis SSulA) and AJ516948 (coding sequence annotated by us). The full-length cDNA was already in the database.
Supplementary Material
Acknowledgments
We thank F. Scmidt (Institut de Biologie Moléculaire des Plantes, Strasbourg, France) for providing the anti-GFP antibodies and J.P. Verbelen for providing TuA-GFP expressing plants. We also thank F.A. Wollman (Institut de Biologie Physico-Chimique, Paris, France), F. Chauvat (Centre d'Etudes Atomiques, Saclay, France), and K. Mazouni (Institut Pasteur, Paris, France) for helpful comments and discussion. We are especially grateful to Rebecca Stevens (Institut National de la Recherche Agronomique, Avignon), Spencer Brown (Institut des Sciences du Végétal, Gif-sur-Yvette, France), and Marie-Pascale Doutriaux (Institut de Biotechnologies des Plantes, Orsay, France) for critical reading of the manuscript. We thank C. Talbot (Institut des Sciences du Végétal) for assistance with confocal microscopy. We thank R. Boyer (Institut de Biotechnologies des Plantes, Orsay, France) for assistance with the figures. This work was supported by the Action Concertée Ministère de la Recherche (dynamique et réactivité des assemblages biologiques).
The author responsible for distribution of materials integral to the findings presented in this article in accordance with policy described in the Instructions for Authors (www.plantcell.org) is: Cécile Raynaud (raynaud@ibp.u-psud.fr).
Online version contains Web-only data.
Article, publication date, and citation information can be found at www.plantcell.org/cgi/doi/10.1105/tpc.022335.
References
- Barkan, A., and Goldschmidt-Clermont, M. (2000). Participation of nuclear genes in chloroplast gene expression. Biochimie 82, 559–572. [DOI] [PubMed] [Google Scholar]
- Choquet, Y., and Wollman, F.A. (2002). Translational regulations as specific traits of chloroplast gene expression. FEBS Lett. 529, 39–42. [DOI] [PubMed] [Google Scholar]
- Church, G., and Gilbert, W. (1984). Genomic sequencing. Proc. Natl. Acad. Sci. USA 81, 1991–1995. [DOI] [PMC free article] [PubMed] [Google Scholar]
- Clough, S.J., and Bent, A.F. (1998). Floral dip: A simplified method for Agrobacterium-mediated transformation of Arabidopsis thaliana. Plant J. 16, 735–743. [DOI] [PubMed] [Google Scholar]
- Colletti, K.S., Tattersall, E.A., Pyke, K.A., Froelich, J.E., Stokes, K.D., and Osteryoung, K.W. (2000). A homologue of the bacterial cell division site-determining factor MinD mediates placement of the chloroplast division apparatus. Curr. Biol. 10, 507–516. [DOI] [PubMed] [Google Scholar]
- Cordell, S.C., Robinson, E.J.H., and Löwe, J. (2003). Crystal structure of the SOS cell division inhibitor SulA and in complex with FtsZ. Proc. Natl. Acad. Sci. USA 100, 7889–7894. [DOI] [PMC free article] [PubMed] [Google Scholar]
- Emanuelsson, O., and von Heijne, G. (2001). Prediction of organellar targeting signals. Biochim. Biophys. Acta 1541, 114–119. [DOI] [PubMed] [Google Scholar]
- Erickson, H.P. (1997). FtsZ, a tubulin homologue in prokaryote cell division. Trends Cell Biol. 7, 362–367. [DOI] [PubMed] [Google Scholar]
- Fulgosi, H., Gerdes, L., Westphal, S., Glockmann, C., and Soll, J. (2002). Cell and chloroplast division require ARTEMIS. Proc. Natl. Acad. Sci. USA 99, 11501–11506. [DOI] [PMC free article] [PubMed] [Google Scholar]
- Gao, H., Kadirjan-Kalbach, D., Froehlich, J., and Osteryoung, K.W. (2003). ARC5, a cytosolic dynamin-like protein from plants, is part of the chloroplast division machinery. Proc. Natl. Acad. Sci. USA 100, 4328–4333. [DOI] [PMC free article] [PubMed] [Google Scholar]
- Gray, J.C., Sullivan, J.H., Wang, J.H., Jerome, C.A., and MacLean, D. (2003). Coordination of plastid and nuclear gene expression. Phil. Trans. R. Soc. Lond. B 358, 135–146. [DOI] [PMC free article] [PubMed] [Google Scholar]
- Hajdukiewicz, P., Svab, Z., and Maliga, P. (1994). The small, versatile pPZP family of Agrobacterium binary vectors for plant transformation. Plant Mol. Biol. 25, 989–994. [DOI] [PubMed] [Google Scholar]
- Hellens, R., Mullineaux, P., and Klee, H. (2000). Technical focus: A guide to Agrobacterium binary Ti vectors. Trends Plant Sci. 5, 446–451. [DOI] [PubMed] [Google Scholar]
- Huisman, O., D'Ari, R., and Gottesman, S. (1984). Cell-division control in Escherichia coli: Specific induction of the SOS function SfiA protein is sufficient to block septation. Proc. Natl. Acad. Sci. USA 81, 4490–4494. [DOI] [PMC free article] [PubMed] [Google Scholar]
- Itoh, R., Fujiwara, M., Nagata, N., and Yoshida, S. (2001). A chloroplast protein homologous to the eubacterial topological specificity factor MinE plays a role in chloroplast division. Plant Physiol. 127, 1644–1655. [PMC free article] [PubMed] [Google Scholar]
- Jasinski, S., Leite, C.S., Domenichini, S., Stevens, R., Raynaud, C., Perennes, C., Bergounioux, C., and Glab, N. (2003). NtKIS2, a novel tobacco cyclin-dependent kinase inhibitor is differentially expressed during the cell-cycle and plant development. Plant Physiol. Biochem. 41, 667–676. [Google Scholar]
- Jasinski, S., Perennes, C., Bergounioux, C., and Glab, N. (2002). Comparative molecular and functional analyses of the tobacco CDK inhibitor NtKIS1a and its spliced variant NtKIS1b. Plant Physiol. 130, 1871–1882. [DOI] [PMC free article] [PubMed] [Google Scholar]
- Justice, S., Garcia-Lara, J., and Rothfield, L.I. (2000). Cell division inhibitors SulA and MinC/MinD block septum formation at different steps in the assembly of the Escherichia coli division machinery. Mol. Microbiol. 37, 410–423. [DOI] [PubMed] [Google Scholar]
- Kuras, R., and Wollman, F.A. (1994). The assembly of cytochrome b6/f complexes: An approach using genetic transformation of the green alga Chlamydomonas reinhardtii. EMBO J. 13, 1019–1027. [DOI] [PMC free article] [PubMed] [Google Scholar]
- Labarre, J., Chauvat, F., and Thuriaux, P. (1989). Insertional mutagenesis by random cloning of antibiotic resistance genes into the genome of the cyanobacterium Synechocystis strain PCC 6803. J. Bacteriol. 171, 3449–3457. [DOI] [PMC free article] [PubMed] [Google Scholar]
- Lazo, G., Stein, P., and Ludwig, R. (1991). A DNA transformation competent Arabidopsis genomic library in Agrobacterium. Biotechnology 9, 963–967. [DOI] [PubMed] [Google Scholar]
- Marrison, J.L., Rutherford, S.M., Robertson, E.J., Lister, C., Dean, C., and Leech, R.M. (1999). The distinctive roles of five different ARC genes in the chloroplast division process in Arabidopsis. Plant J. 18, 651–662. [DOI] [PubMed] [Google Scholar]
- Mazouni, K., Domain, F., Cassier-Chauvat, C., and Chauvat, F. (2004). Molecular analysis of the key cytokinetic components of cyanobacteria: FtsZ, ZipN and MinCDE. Mol. Microbiol. 52, 1145–1158. [DOI] [PubMed] [Google Scholar]
- McAndrews, R.S., Froehlich, J.E., Vitha, S., Stokes, K.D., and Osteryoung, K.W. (2001). Colocalization of plastid division proteins in the chloroplast stromal compartment establishes a new functional relationship between FtsZ1 and FtsZ2 in higher plants. Plant Physiol. 127, 1656–1666. [PMC free article] [PubMed] [Google Scholar]
- McFadden, G.I. (1999). Endosymbiosis and evolution of the plant cell. Curr. Opin. Plant Biol. 2, 513–519. [DOI] [PubMed] [Google Scholar]
- Miyagishima, S., Nishida, K., and Kuroiwa, T. (2003. a). An evolutionary puzzle: Chloroplast and division dividing rings. Trends Plant Sci. 8, 432–438. [DOI] [PubMed] [Google Scholar]
- Miyagishima, S., Nishida, K., Mori, T., Matsuzaki, M., Higashiyama, T., Kuroiwa, H., and Kuroiwa, T. (2003. b). A plant-specific dynamin-related protein forms a ring at the chloroplast division site. Plant Cell 15, 655–665. [DOI] [PMC free article] [PubMed] [Google Scholar]
- Miyagishima, S., Takahara, M., Mori, T., Kuroiwa, H., Higashiyama, T., and Kuroiwa, T. (2001). Plastid division is driven by a complex mechanism that involves differential transition of the bacterial and eukaryotic division rings. Plant Cell 13, 2257–2268. [DOI] [PMC free article] [PubMed] [Google Scholar]
- Osteryoung, K.W., and Nunnari, J. (2003). The division of endosymbiotic organelles. Science 302, 1698–1704. [DOI] [PubMed] [Google Scholar]
- Osteryoung, K.W., Stokes, K.D., Rutherford, S.M., Percival, A.L., and Lee, W.Y. (1998). Chloroplast division in higher plants requires members of two functionally divergent genes families with homologies to bacterial FtsZ. Plant Cell 10, 1991–2004. [DOI] [PMC free article] [PubMed] [Google Scholar]
- Perennes, C., Glab, N., Guglieni, B., Doutriaux, M.P., Phan, T., Planchais, S., and Bergounioux, C. (1999). Is arcA3 a possible mediator in the signal transduction pathway during agonist cell cycle arrest by salicylic acid and UV irradiation? J. Cell Sci. 112, 1181–1190. [DOI] [PubMed] [Google Scholar]
- Pyke, K., and Leech, R. (1991). Rapid image analysis screening procedure for identifying chloroplast number in mesophyll cells of Arabidopsis thaliana (L.). Heynh. Plant Physiol. 96, 1193–1195. [DOI] [PMC free article] [PubMed] [Google Scholar]
- Pyke, K., and Leech, R. (1992). Nuclear mutations radically alter chloroplast division and expansion in Arabidopsis thaliana. Plant Physiol. 99, 1005–1008. [DOI] [PMC free article] [PubMed] [Google Scholar]
- Rothfield, L., and Justice, S. (1997). Bacterial cell division: The cycle of the ring. Cell 88, 581–584. [DOI] [PubMed] [Google Scholar]
- Soll, J. (2002). Protein import into chloroplast. Curr. Opin. Plant Biol. 5, 529–535. [DOI] [PubMed] [Google Scholar]
- Stokes, K., McAndrew, R., Figueroa, R., Vitha, S., and Osteryoung, K. (2000). Chloroplast division and morphology are differentially affected by over-expression of FtsZ1 and FtsZ2 genes in Arabidopsis. Plant Physiol. 124, 1668–1677. [DOI] [PMC free article] [PubMed] [Google Scholar]
- Strepp, R., Scholz, S., Kruse, S., Speth, V., and Reski, R. (1998). Plant nuclear gene knockout reveals a role in plastid division for the homolog of the bacterial cell division protein FtsZ, an ancestral tubulin. Proc. Natl. Acad. Sci. USA 95, 4368–4373. [DOI] [PMC free article] [PubMed] [Google Scholar]
- Ueda, K., Matsuyama, T., and Hashimoto, T. (1999). Visualisation of microtubules in living cells of transgenic Arabidopsis thaliana. Protoplasma 206, 201–206. [Google Scholar]
- Vitha, S., Froechlich, J.E., Koksharova, O., Pyke, K.A., van Erp, H., and Osteryoung, K.W. (2003). ARC6 is a J-domain plastid division protein and an evolutionary descendant of the cyanobacterial cell division protein Ftn2. Plant Cell 15, 1918–1933. [DOI] [PMC free article] [PubMed] [Google Scholar]
- Vitha, S., McAndrews, R.S., and Osteryoung, K.W. (2001). FtsZ ring formation at the chloroplast division site in plants. J. Cell Biol. 153, 111–119. [DOI] [PMC free article] [PubMed] [Google Scholar]
Associated Data
This section collects any data citations, data availability statements, or supplementary materials included in this article.


