

Abstract
Background. Preexposure prophylaxis (PrEP) is effective for preventing human immunodeficiency virus (HIV) infection among men who have sex with men (MSM) within trial settings. Population impact will depend on clinical indications for PrEP initiation, coverage levels, and drug adherence. No modeling studies have estimated the impact of clinical practice guidelines for PrEP issued by the Centers for Disease Control and Prevention (CDC).
Methods. Mathematical models of HIV transmission among MSM were used to estimate the percentage of infections averted (PIA) and the number needed to treat (NNT) under behavioral indications of the CDC's PrEP guidelines. We modeled the contribution of these indications while varying treatment coverage and adherence.
Results. At 40% coverage of indicated MSM over the next decade, application of CDC guidelines would avert 1162 infections per 100 000 person-years, 33.0% of expected infections. The predicted NNT for the guidelines would be 25. Increasing coverage and adherence jointly raise the PIA, but reductions to the NNT were associated with better adherence only.
Conclusions. Implementation of CDC PrEP guidelines would result in strong and sustained reductions in HIV incidence among MSM in the United States. The guidelines strike a good balance between epidemiological impact (PIA) and efficiency (NNT) at plausible scale-up levels. Adherence counseling could maximize public health investment in PrEP by decreasing the NNT.
Keywords: HIV, men who have sex with men, preexposure prophylaxis, clinical guidelines, mathematical model, sexual network
(See the editorial commentary by Baeten on pages 1787–9.)
The efficacy of daily oral antiretroviral preexposure prophylaxis (PrEP) for the prevention of human immunodeficiency virus (HIV) infection was established in several randomized controlled trials (RCTs), including the iPrEx study that tested the tenofovir disoproxil fumarate and emtricitabine formulation among men who have sex with men (MSM) [1]. Intent-to-treat analyses estimated a prevention benefit of 44%, with efficacy at 73% among those with high self-reported adherence and 92% among those with serum-detectable drug levels [2]. Poor adherence had been a problem in establishing efficacy of PrEP in some RCTs [3], but subsequent demonstration studies have found stronger adherence in open-label settings [4, 5].
In response to these trial results, the US Food and Drug Administration approved a label indication for the prescription of Truvada for PrEP among uninfected persons at high risk of infection [6], and the Centers for Disease Control and Prevention (CDC) subsequently released guidelines for its use in clinical practice [7]. In these guidelines, PrEP is indicated for MSM who are at “substantial risk” of infection, defined primarily by 3 behavioral criteria: unprotected (ie, condomless) anal intercourse (UAI) in HIV status–unknown monogamous partnerships, UAI outside a monogamous partnership, and anal intercourse (AI) in a known-serodiscordant partnership. Sexually transmitted infection diagnoses, another criterion, are considered biological indications of risky sexual activity. For each criterion, clinicians should query these indications over the prior 6 months; any events during that “risk window” trigger a possible indication for PrEP. The CDC supports PrEP use as part of a comprehensive prevention plan that includes other biomedical and behavioral prevention strategies.
The guidelines' criteria were devised based on analyses of RCT data [8]. However, persons eligible for and willing to participate in RCTs may not represent the broader target population for interventions [9]. Public PrEP programs also may not replicate the extensive ancillary risk reduction and adherence counseling components within research settings [10]. It is therefore critical to understand the impact of different schemes for targeting PrEP on population-level HIV incidence. Mathematical models provide one approach to estimating PrEP impact [11, 12], but PrEP models of MSM to date have modeled uptake schemes that differ from the CDC guidelines [13] or use static modeling approaches that do not represent MSM sexual partnerships relevant for the guidelines' behavioral indications [14]. A model-based investigation of the CDC guidelines will be helpful for state and local public health officials seeking to estimate the impact of including PrEP within a comprehensive HIV prevention plan.
In this study, we model HIV transmission dynamics among MSM to estimate the proportion of infections averted, the number needed to treat (NNT) with PrEP to prevent 1 new infection, and related epidemiological outcomes after implementing PrEP according to the CDC guidelines. The goal is to quantify reductions in incidence associated with individual guideline indications, separately and jointly, and to explore the impact of varying conditions of coverage and adherence patterns during the next 10 years.
METHODS
Study Design
This study uses a network-based mathematical model of HIV transmission dynamics in an open population of MSM in the United States. This work builds on an earlier modeling project to investigate the causes and consequences of racial disparities in HIV incidence among MSM in the United States [15]. Parameters for sexual behavior were drawn from 2 empirical studies of MSM in Atlanta, Georgia [16]. Our model was built and simulated using the open-source EpiModel (version 1.2.5) software package (http://epimodel.org) for the R statistical computing platform [17]. The full methodological framework for these mathematical models, including the statistical estimation of dynamic network models, model parameterization, simulation, and data analysis, are provided in a Supplementary Appendix.
HIV Transmission and Progression
Similar to prior studies [18], this study modeled HIV transmission over sexual contact networks using exponential random graph models, a flexible statistical method for simulating dynamic partnerships parameterized from behavioral data [19]. The modeled network had 3 components: main partners, shorter-term casual partners with repeated contacts, and one-time partners. The set of persons was the same in each component, but the predictors of partnership formation varied by partnership type, with different model terms for degree (number of ongoing partners for each member of the pair), age homophily (selecting partners of similar age), and sexual role segregation (such that 2 exclusively receptive men cannot pair, nor can 2 exclusively insertive men). For main and casual partnerships, there was a constant hazard of relationship dissolution, reflecting the median duration of each type.
Clinical HIV progression followed the natural course of disease and antiretroviral therapy (ART) treatment profiles [20]. Persons progressed through disease stages in the absence of ART with evolving HIV viral loads that modified the rate of HIV transmission in serodiscordant pairs. Per-act factors influencing the transmission probability included viral load [21], condom use [22], receptive versus insertive sexual position [18], circumcision for an insertive negative partner [23], and the presence of the CCR5-Δ32 genetic allele [24, 25]. After infection, persons were assigned into clinical care trajectories controlling rates of HIV diagnosis, ART initiation, and HIV viral suppression, to match empirical estimates of the prevalence of these states [15]. ART was associated with decreased viral load (and related transmission risk) [26] and extended life span [27].
PrEP Indications and Uptake
The guidelines recommend assessing patients for PrEP at diagnostic HIV testing, with a focus on the prior 6 months of behavior (the risk window). Based on empirical data [15], a small proportion of MSM (6.5%) never tested for HIV in our models, and the remainder tested at regular intervals (approximately yearly before and quarterly after PrEP initiation). We varied the risk window (independent from the testing interval), from 6 months in the base scenario, to 3 and 12 months in sensitivity analyses. Behavior was tracked over that window; any behavioral events accumulated to establish an indication for PrEP at that test visit. MSM were assessed for PrEP indications only at visits in which their HIV test result was negative. At that time, MSM were allowed to start PrEP only if the proportion of MSM on this regimen had not surpassed a threshold coverage fraction, which we varied from a default of 40% to between 10% and 90% in sensitivity analyses.
This model explicitly simulated PrEP eligibility based on the 3 behavioral conditions in the CDC guidelines: UAI in monogamous partnerships with a partner not recently tested negative for HIV, UAI outside a monogamous partnership, and AI in a known-serodiscordant partnership [7]. We modeled PrEP indications for these 3 conditions separately and then jointly to estimate their individual and combined prevention effects (Table 1). Because of potential variations in clinical interpretation of the guidelines, we explored 2 different functional definitions: a “literal” version based on the specific guideline wording and a “clinical” version that could be more realistically assessed in practice.
Table 1.
Scenario Definitions for Models of PrEP in MSM Based on CDC Guidelines for Behavioral Indications
| Indication | Definition |
|---|---|
| Condition 1 | UAI in monogamous, HIV status–unknown partnership |
| 1a | 2-sided monogamy assessment |
| 1b | 1-sided monogamy assessment |
| Condition 2 | UAI outside monogamous partnership |
| 2a | Nonmonogamy defined as degree >1 in interval |
| 2b | Nonmonogamy defined as nonmain partnership |
| Condition 3 | AI in known-serodiscordant partnership |
| 3a | Any AI in partnership |
| 3b | Any UAI in partnership |
| Joint conditions | |
| J1: 1a or 2a or 3a | Literal CDC guidelines scenario |
| J2: 1b or 2b or 3a | Clinical scenario |
| J3: 1b or 2b or 3b | Higher-risk clinical scenario |
| Sensitivity analyses | |
| Coverage | Proportion of MSM with indications who start PrEP: 10%–90% (base model, 40%) |
| Adherence | Proportion of MSM initiated on PrEP who are highly adherent: 10%–90% (base model, 61.9%) |
| Risk assessment window | Length of historical time window to conduct risk assessment: 3, 6 (base model), or 12 mo |
Abbreviations: AI, anal intercourse; CDC, Centers for Disease Control and Prevention; HIV, human immunodeficiency virus; MSM, men who have sex with men; PrEP, preexposure prophylaxis; UAI, unprotected AI.
For condition 1, the literal version defined monogamy as both partners in a long-term partnership having no outside partnerships, whereas the clinical version required only the person assessed for PrEP to exhibit monogamy [28]. For condition 2, the literal version considered any UAI outside a monogamous partnership, where monogamy was defined by the number of ongoing partnerships (sexual network degree, 1), an the clinical version indicated PrEP if there was any UAI outside self-defined “main” partnerships. For condition 3, the guideline definition was AI in a known-serodiscordant partnership, but we also modeled a high-risk variant requiring that condomless AI occurred in these partnerships. The CDC guidelines indicate PrEP based on the union of conditions 1–3. We modeled 3 variants of this union, based on the different condition combinations, comprising a plausible range of PrEP risk assessment schemes in clinical practice.
Once men started PrEP, they returned for diagnostic assessment at quarterly intervals. As stipulated by the guidelines, men were assessed for ongoing risk indications yearly. MSM who formerly had indications but then had none after a period of no triggering behavioral conditions within the risk window were removed from PrEP. Men starting PrEP were assigned a fixed adherence profile reflecting an average weekly dosage. Adherence profile parameters were drawn from an open-label demonstration project reweighted by race to account for the small proportion of nonwhite persons in that study [29]. Our base model assigned 21.1% of men as nonadherent (0 doses), 7.0% as taking <2 doses per week, 10.0% taking 2–3 doses per week, and 61.9% taking ≥4 doses per week. In sensitivity analyses for adherence, we varied the proportion in the highly adherent group from 10% to 90% by proportionally reallocating MSM into the lower 3 adherence groups. Use of PrEP resulted in a reduction of the per-act probability of infection correlated with adherence level: 0%, 31%, 81%, and 95% for the nonadherent to high-adherence groups [2]. To focus on coverage and adherence, we did not model changes to risk behavior after PrEP initiation in this study; to date, little evidence for risk compensation among MSM has been found [2, 4, 29, 30].
Simulation and Analysis
Burn-in models establishing equilibrium in epidemiological and demographic outcomes were simulated with a starting population size of 10 000 MSM, with men entering the network at sexual onset and exiting owing to death or reaching age 40 years. This model was calibrated using approximate Bayesian computation methods [31] fit to a stable HIV prevalence in the population of 26%, consistent with the Atlanta studies supplying many behavioral parameters [15]. From there, each PrEP scenario was simulated 250 times over 10 years.
HIV outcomes and time on PrEP were tracked under each scenario. These were used to calculate the primary outcomes: HIV incidence and prevalence; the number of infections averted (NIA) and percentage of infections averted (PIA), relative to a scenario in which there was no PrEP; and the number of person-years on PrEP needed to prevent 1 infection (ie, the NNT). The NIA was the difference in the cumulative incidence between the active PrEP scenarios and a scenario in which no PrEP was provided. The PIA was the NIA divided by the cumulative incidence in that non-PrEP scenario. The NNT was the person-time on PrEP divided by the reciprocal of the NIA for each scenario. Given the stochastic framework of these models, we presented the means and 95% credible intervals (middle 95% of simulated data) for each outcome. We developed an online web application (https://prism.shinyapps.io/cdc-prep-guidelines) for further exploration of model results.
RESULTS
Table 2 provides the primary results for each behavioral indication and the joint union of those indications, assuming 40% coverage of indicated MSM and 62% high adherence among those covered. Implementing PrEP consistent with CDC guidelines under these assumptions resulted in a monotonic decline in HIV prevalence and incidence. Under the best-performing joint scenario for the guidelines' indications (scenario J2), PrEP would avert 33% of new infections among MSM over the next 10 years. This would require treating 25 uninfected MSM for 1 year per infection averted.
Table 2.
Epidemiological Outcomes 10 Years After Initiation of PrEP in MSM, by Behavioral Indication Scenario, With 40% Coverage and High Adherence in 62%
| Model Scenario | Outcome (95% CrI) |
||||
|---|---|---|---|---|---|
| Prevalence | Incidencea | NIAb | PIAc | NNTd | |
| No PrEP | 25.9 (24.6–26.6) | 3.55 (1.25–6.31) | … | … | … |
| Individual conditions | |||||
| Condition 1: UAI in monogamous HIV status–unknown partnership | |||||
| 1a (2 sided) | 24.5 (23.4–25.6) | 3.28 (.71–6.45) | 201 (51–386) | 5.7 (1.4–10.9) | 57 (23–253) |
| 1b (1 sided) | 23.6 (22.4–24.8) | 3.06 (.65–6.17) | 380 (210–543) | 10.8 (5.9–15.4) | 45 (26–79) |
| Condition 2: UAI outside monogamous partnership | |||||
| 2a (Degree >1) | 23.2 (22.2–24.2) | 2.94 (.63–5.92) | 449 (290–596) | 12.7 (8.2–16.9) | 18 (13–28) |
| 2b (Non-main) | 21.1 (20.1–22.0) | 2.49 (.51–5.20) | 816 (674–970) | 23.2 (19.1–27.5) | 23 (19–28) |
| Condition 3: AI in known-serodiscordant partnership | |||||
| 3a (Any AI) | 23.0 (21.9–24.1) | 2.89 (.61–5.90) | 494 (326–687) | 14.0 (9.2–19.5) | 15 (10–23) |
| 3b (UAI) | 23.5 (22.4–24.5) | 3.03 (.63–6.11) | 402 (228–565) | 11.4 (6.5–16.0) | 14 (9–26) |
| Joint conditions | |||||
| J1: 1a or 2a or 3a | 20.6 (19.6–21.6) | 2.40 (.46–5.09) | 918 (779–1060) | 26.1 (22.1–30.1) | 22 (19–27) |
| J2: 1b or 2b or 3a | 19.2 (18.2–20.2) | 2.08 (.17–4.54) | 1162 (1023–1301) | 33.0 (29.0–36.9) | 25 (22–28) |
| J3: 1b or 2b or 3b | 19.4 (18.4–20.3) | 2.11 (.20–4.62) | 1123 (971–1268) | 31.9 (27.6–36.0) | 25 (21–29) |
Abbreviations: AI, anal intercourse; CrI, credible interval from the simulations; HIV, human immunodeficiency virus; MSM, men who have sex with men; NIA, number of infections averted; NNT, number needed to treat; PIA, percentage of infections averted; PrEP, preexposure prophylaxis; UAI, unprotected AI.
a Incidence per 100 person-years at risk.
b NIA per 100 000 person-years at risk.
c PIA compared with expected in no-PrEP scenario.
d NNT on PrEP for 1 year to avert 1 new infection.
Figure 1 shows the cumulative PIA based on this J2 scenario over 10 years. The PIA was lower at the introduction of PrEP, with rapid, nonlinear growth as PrEP-naive MSM started PrEP at their regular HIV testing visits. The PIA continued to grow, more linearly, over the decade as infections were averted through both the direct prevention benefit of PrEP among the current users and the indirect benefit to the population by lowering community HIV prevalence (the “downstream” prevention effect).
Figure 1.
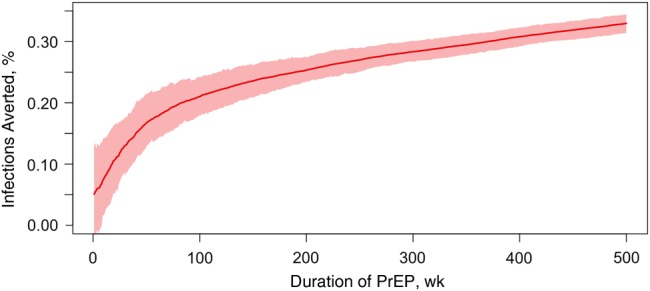
Cumulative percentage of infections averted (red line) and 95% credible intervals (pink band) over 10 years of a preexposure prophylaxis (PrEP) intervention among men who have sex with men, assuming that 40% of those with behavioral indications started PrEP and 61.9% of those receiving PrEP are highly adherent.
As shown in Figure 2 and Table 2, each behavioral indication in the guidelines had a unique contribution to this overall impact. Condition 1, targeting UAI in status-unknown monogamous partnerships, yielded a lower PIA than the other 2 conditions. Condition 2, targeting UAI outside monogamous partnerships, would prevent 13%–23% of infections, depending on the definition of monogamy. PrEP indications for UAI in non-main partnerships (condition 2b) yielded a higher PIA but also a higher NNT than the concurrency-based definition (condition 2a); the former was more prevalent but a lower-risk activity than the latter. Condition 3 had the best efficiency (lowest NNT) of any indication but a relatively low PIA for similar reasons. For the joint conditions reflecting the full scope of the guidelines, the J2 scenario that combined individual conditions 1b, 2b, and 3a averted the most infections. Given the optimum performance of J2 in these simulations, we used it as the indication variant for the sensitivity analyses on 2 key model assumptions: coverage and adherence.
Figure 2.

Box plots of the percentage of infections averted and number needed to treat to prevent 1 new infection by the individual behavioral indications (1a–3b; blue) and joint guideline scenarios (J1–J3; red) outlined in Table 1. Boxes indicate interquartile ranges; whiskers, 95% credible intervals for outcomes across all 250 simulations for each scenario.
In Table 3, the sensitivity analyses for coverage assumed the base adherence level (61.9% as highly adherent), whereas the sensitivity analyses for adherence assumed the base coverage level (40%). Both factors modified how PrEP decreased HIV incidence among MSM. Coverage of 10% would prevent only 11% of infections, whereas coverage of 90% would prevent 50% over 10 years. Similarly, increasing adherence among MSM with 40% coverage lowered incidence and increased the PIA (from 33% to 40% if 90% of MSM were highly adherent). Under less optimistic scenarios, poor adherence reduced the PIA by circulating PrEP prescriptions among men who did not receive a pharmacological benefit. The left panel of Figure 3 shows the interaction between adherence and coverage for the PIA along a continuous gradient. At low coverage levels (<30%), improving adherence has only a marginal impact on the PIA, whereas at higher coverage (>50%) the combined effects become linear in their interaction.
Table 3.
Sensitivity Analyses for J2 Joint Clinical Scenario, Varying PrEP Coverage, Proportion of Persons Highly Adherent, and Length of Risk Assessment Window
| Model Scenario | Outcome (95% CrI) |
||||
|---|---|---|---|---|---|
| Prevalence | Incidencea | NIAb | PIAc | NNTd | |
| Coverage, % | |||||
| 10 | 23.5 (22.4–24.8) | 3.02 (.65–6.14) | 382 (169–556) | 10.8 (4.8–15.8) | 26 (16–63) |
| 20 | 21.8 (20.8–22.9) | 2.61 (.56–5.38) | 697 (535–843) | 19.8 (15.2–23.9) | 24 (19–32) |
| 30 | 20.4 (19.5–21.5) | 2.32 (.34–4.95) | 945 (787–1091) | 26.8 (22.3–31.0) | 24 (21–30) |
| 40 (base) | 19.2 (18.2–20.2) | 2.08 (.17–4.54) | 1162 (1023–1301) | 33.0 (29.0–36.9) | 25 (22–28) |
| 50 | 18.4 (17.5–19.3) | 1.92 (.05–4.28) | 1301 (1169–1420) | 36.9 (33.2–40.3) | 26 (23–29) |
| 60 | 17.6 (16.8–18.5) | 1.77 (.03–4.06) | 1443 (1339–1563) | 41.0 (38.0–44.4) | 26 (24–28) |
| 70 | 16.9 (16.0–17.8) | 1.65 (<0.01 to 3.77) | 1567 (1436–1688) | 44.5 (40.8–47.9) | 26 (24–29) |
| 80 | 16.3 (15.5–17.2) | 1.53 (<0.01 to 3.60) | 1671 (1538–1792) | 47.4 (43.7–50.9) | 26 (24–29) |
| 90 | 15.8 (15.1–16.7) | 1.46 (<0.01 to 3.53) | 1752 (1623–1868) | 49.7 (46.1–53.0) | 27 (25–29) |
| Adherence, % | |||||
| 10 | 22.3 (21.3–23.5) | 2.73 (.59–5.65) | 612 (448–772) | 17.4 (12.7–21.9) | 48 (37–67) |
| 20 | 21.6 (20.7–22.6) | 2.59 (.52–5.43) | 734 (579–869) | 20.8 (16.4–24.7) | 40 (33–52) |
| 30 | 21.0 (19.9–22.0) | 2.44 (.45–5.13) | 853 (695–994) | 24.2 (19.7–28.2) | 34 (28–42) |
| 40 | 20.4 (19.3–21.5) | 2.33 (.38–4.99) | 946 (803–1089) | 26.9 (22.8–30.9) | 30 (26–36) |
| 50 | 19.9 (18.9–20.8) | 2.22 (.29–4.80) | 1043 (906–1181) | 29.6 (25.7–33.5) | 28 (24–32) |
| 61.9 (base) | 19.2 (18.2–20.2) | 2.08 (.17–4.54) | 1162 (1023–1301) | 33.0 (29.0–36.9) | 25 (22–28) |
| 70 | 18.8 (17.9–19.9) | 1.98 (.10–4.37) | 1231 (1076–1352) | 34.9 (30.5–38.4) | 23 (21–27) |
| 80 | 18.3 (17.5–19.4) | 1.90 (.04–4.29) | 1314 (1172–1437) | 37.3 (33.3–40.8) | 22 (19–25) |
| 90 | 17.7 (16.9–18.6) | 1.78 (.02–4.06) | 1418 (1291–1533) | 40.2 (36.6–43.5) | 20 (18–22) |
| Risk window, mo | |||||
| 3 | 19.9 (18.9–20.9) | 2.24 (.30–4.81) | 1039 (898–1194) | 29.5 (25.5–33.9) | 21 (18–25) |
| 6 (base) | 19.2 (18.2–20.2) | 2.08 (.17–4.54) | 1162 (1023–1301) | 33.0 (29.0–36.9) | 25 (22–28) |
| 12 | 18.7 (17.7–19.6) | 1.93 (.03–4.31) | 1260 (1120–1395) | 35.8 (31.8–39.6) | 27 (24–31) |
Abbreviations: CrI, credible interval from the simulations; NIA, number of infections averted; NNT, number needed to treat; PIA, percentage of infections averted; PrEP, preexposure prophylaxis.
a Incidence per 100 person-years at risk.
b Number of infections averted per 100 000 person-years at risk.
c Percentage of infections averted compared with expected in no-PrEP scenario.
d NNT on PrEP for 1 year to avert 1 new infection.
Figure 3.

Percentage of infections averted (PIA) and number needed to treat (NNT) under the joint clinical practice model (scenario J2), with varying coverage (proportion of men who have sex with men with behavioral indications who start preexposure prophylaxis) and adherence (proportion receiving who maintain a high-adherence profile, ie, taking ≥4 doses per week). Results are cumulative outcomes over 10 years of the simulations.
Varying coverage and adherence also differentially modified the efficiency of PrEP, measured by the NNT. Increasing or decreasing coverage had minimal impact on the NNT, which averaged 24–27 across all coverage levels; this was because the NNT was a measure standardized to coverage as a function of person-years on PrEP. This contrasts with adherence, because greater adherence was associated with a lower NNT. The right panel of Figure 3 depicts this finding; the contour bands are horizontally oriented, indicating that increasing adherence, but not coverage, will reduce the NNT. The efficiency of PrEP was lower with lower adherence, because more person-time on PrEP was diluted among men who received no prevention benefit.
Table 3 also shows that increasing the length of the risk assessment window during diagnostic HIV testing visits, from 6 to 12 months, had a minimal impact on the PIA (increase from 33% to 36%). The PIA increased only marginally because sexual behavior was temporally autocorrelated. Initiating PrEP for MSM with less frequent risk indications would avert further infections, yet assessment over this longer interval increased the NNT from 25 to 27, because PrEP uptake would occur among MSM who were at lower risk.
DISCUSSION
Implementation of CDC guidelines for PrEP would result in significant and sustained declines in HIV prevalence and incidence among MSM in the United States, according to our modeling study. This assumes fixed sexual behaviors, clinical care utilization patterns, and other factors potentially influencing HIV transmission dynamics that could potentially reduce the prevention benefits of PrEP. Under the 3 behavioral indications for PrEP within the guidelines, 40% coverage of indicated MSM, and 62% high adherence, 1162 new infections would be averted per 100 000 person-years at risk, representing 33% of cases expected over the next decade. This study therefore provides strong support for the CDC HIV prevention guidelines from a modeling framework.
The models in this study explicitly represented the CDC guidelines' behavioral indications for MSM based on the unique aspects of their dynamic sexual partnership networks, using robust statistical and mathematical modeling methods [17, 19]. The complex structure of main, casual, and one-time sexual MSM partnership networks in which HIV infection risk occurs contributes to the high prevalence of HIV among MSM in the United States [18] and will be critical to target for any intervention seeking to mitigate that epidemic [20].
Each of the behavioral indications for the guidelines resulted in substantial averted infections in our model, but some more than others. For conditions 1 (UAI in monogamous status-unknown partnerships) and 2 (UAI outside monogamous partnerships), we found important differences in prevention benefits based on the indication definition, with the “clinical” versions (conditions 1b and 2b) each averting nearly twice the infections as their corresponding “literal” versions (conditions 1a and 2a). The clinical versions are therefore recommended because of their optimal performance. Targeting MSM with any AI in known-serodiscordant partnerships (condition 3a) prevented more infections than limiting prescription to those specifically with condomless AI in those partnerships (condition 3b), consistent with the guidelines' indication of any AI [7].
The single greatest contributor to overall incidence reduction in the joint scenario models was coverage level, the fraction of the population with behavioral indications who started PrEP. Achieving sustained high coverage will be challenging, owing to losses at each step of the “PrEP continuum.” [32] Addressing gaps in access to HIV testing and other clinical settings in which PrEP assessment and prescription occur is critical in linking PrEP availability to uptake. Adherence to PrEP after initiation is the other component contributing to its success. Our base scenarios used a heterogeneous adherence profile based on a recent PrEP demonstration project of MSM [29]. Open-label studies such as ours and others [5] have shown greater adherence than in blinded trials [1], yet both types of studies may not reflect the long-term adherence patterns of MSM outside study settings and throughout their sexual lifetimes. Our sensitivity analyses included a broad range of adherence scenarios reflecting possibilities over the next decade.
Intervention targeting generally requires a trade-off between epidemiological impact (eg, PIA) and efficiency (eg, NNT) [33]. Analyses of iPrEx findings suggested that targeting PrEP more broadly (to persons with any UAI) would prevent many more infections than targeting a high-risk group, but at low efficiency (NNT approaching 100) [8]. Yet those analyses and static transmission models were unable to account for the downstream prevention effects of PrEP, wherein the benefits accrue from both direct PrEP use and indirect community-level protection over time.
Accounting for indirect effects can substantially improve the efficiency of PrEP, lowering the NNT by 50%–100% compared with estimates from models with direct effects only [14]. Although a formal economic analysis is outside the scope of this study, the increased efficiency predicted by our findings will translate into a higher cost-effectiveness for PrEP. Our epidemiological model results may be incorporated into a cost-effectiveness analysis, as others have done [34]. Overall, taking into account the direct and indirect effects, implementing PrEP based on the indications in the CDC guidelines strikes a good balance between impact and efficiency according to our study, with 33% of infections averted and an NNT of 25.
Finally, our study highlights the critical role of adherence for both effectiveness and efficiency. Across all levels of coverage, increasing the proportion of MSM receiving PrEP who are highly adherent will strongly effect the efficiency of PrEP: the NNT could be reduced from approximately 50 with poor adherence to 20 with optimal adherence. Increasing adherence to that degree will be a challenge, requiring high-quality adherence counseling [35], but will yield substantial public health cost savings in scaling up PrEP for MSM in the United States [36]. Ongoing research is investigating mobile technologies and care coordination models for improving PrEP adherence under daily dosing schedules [37, 38], and event-based dosing and long-acting PrEP formulations may provide alternative approaches to the challenge of long-term adherence [39].
This study has 4 key limitations. First, we modeled the core behavioral indications in CDC's guidelines for PrEP use by MSM, but not the sexually transmitted infection diagnosis component. This would involve modeling the transmission of multiple non-HIV infections, including their biological interactions with HIV. This was outside the scope of the current models, but it is planned for future research. Although diagnoses of sexually transmitted infections may be important to consider as independent risk factors for HIV infection [5], they are also typically used in practice as indicators of behavioral risk more objective than self-reports; these behaviors were already well captured in our model. Second, our models assume unbiased recall of sexual behaviors and reporting of those behaviors to clinicians prescribing PrEP. To the extent that behaviors would be underreported [40], this could overestimate PrEP performance. Third, many of the underlying sexual behaviors, the basis of the modeled PrEP indications in these models, have been parameterized from 2 studies on MSM in Atlanta. Although risk behaviors of MSM in these studies were similar to broader national data [41], the generalizability of our models to the larger population of MSM in the United States is unknown.
In conclusion, PrEP provides a fundamental new opportunity in HIV prevention among MSM in the United States, where condoms and other behavioral methods of risk reduction have been inconsistently or insufficiently used. The benefits of PrEP in reducing HIV incidence in the next decade will require sustained uptake and high adherence among MSM at risk of infection through their networks of sexual partnerships. Because the levels of PrEP use among MSM has been low to date, further research and implementation efforts are needed to clarify the long-term effectiveness of PrEP as part of a comprehensive HIV prevention plan. That prevention plan should continue to stress the importance of existing risk-reduction strategies, such as condom use, along with PrEP for MSM as indicated. Our study confirms that the indications for PrEP use in the CDC guidelines strike a good balance with respect to intervention impact and efficiency and should be used by clinicians in determining their prescriptions. Under these conditions, PrEP could reduce new infections by one-third over the next decade.
Supplementary Material
Notes
Acknowledgments. We thank members of the scientific and public health advisory groups of the Coalition for Applied Modeling for Prevention project for their input on this study, and specifically those members who reviewed a previous version of this manuscript: James Curran, Carlos del Rio, David Holtgrave, David Dowdy, Jane Kelley, Gregory Felzien, John Douglas, and Nanette Benbow. We also thank Dr. Albert Liu and the research team of the Preexposure prophylaxis (PrEP) Demonstration Project for providing PrEP adherence data used in our model.
Disclaimer. The findings and conclusions in this article are those of the authors and do not necessarily represent the views of the Centers for Disease Control and Prevention (CDC).
Financial support. This work was supported by CDC (grant: U38 PS004646), the National Institutes of Health (grants: R01 HD068395, R21 HD075662, and R24 HD042828), and the Emory Center for AIDS Research (grant: P30 AI050409).
Potential conflicts of interest All authors: No reported conflicts. All authors have submitted the ICMJE Form for Disclosure of Potential Conflicts of Interest. Conflicts that the editors consider relevant to the content of the manuscript have been disclosed.
References
- 1.Grant RM, Lama JR, Anderson PL et al. Preexposure chemoprophylaxis for HIV prevention in men who have sex with men. N Engl J Med 2010; 363:2587–99. [DOI] [PMC free article] [PubMed] [Google Scholar]
- 2.Grant RM, Anderson PL, McMahan V et al. Uptake of pre-exposure prophylaxis, sexual practices, and HIV incidence in men and transgender women who have sex with men: a cohort study. Lancet Infect Dis 2014; 14:820–9. [DOI] [PMC free article] [PubMed] [Google Scholar]
- 3.Baeten JM, Grant R. Use of antiretrovirals for HIV prevention: what do we know and what don't we know? Curr HIV/AIDS Rep 2013; 10:142–51. [DOI] [PMC free article] [PubMed] [Google Scholar]
- 4.McCormack S, Dunn DT, Desai M et al. Pre-exposure prophylaxis to prevent the acquisition of HIV-1 infection (PROUD): effectiveness results from the pilot phase of a pragmatic open-label randomised trial. Lancet 2016; 387:53–60. [DOI] [PMC free article] [PubMed] [Google Scholar]
- 5.Volk JE, Marcus JL, Phengrasamy T et al. No new HIV infections with increasing use of HIV preexposure prophylaxis in a clinical practice setting. Clin Infect Dis 2015; 61:1601–3. [DOI] [PMC free article] [PubMed] [Google Scholar]
- 6.Food and Drug Administration. Background package for NDA 21-752/supplement 30, 2012. http://www.fda.gov/downloads/AdvisoryCommittees/CommitteesMeetingMaterials/Drugs/AntiviralDrugsAdvisoryCommittee/UCM303213.pdf. Accessed 15 February 2016.
- 7.Centers for Disease Control and Prevention. Preexposure prophylaxis for the prevention of HIV infection in the United States—2014: a clinical practice guideline, 2014. http://www.cdc.gov/hiv/pdf/prepguidelines2014.pdf. Accessed 15 February 2016.
- 8.Buchbinder SP, Glidden DV, Liu AY et al. HIV pre-exposure prophylaxis in men who have sex with men and transgender women: a secondary analysis of a phase 3 randomised controlled efficacy trial. Lancet Infect Dis 2014; 14:468–75. [DOI] [PMC free article] [PubMed] [Google Scholar]
- 9.Gandhi M, Ameli N, Bacchetti P, Sharp G. Eligibility criteria for HIV clinical trials and generalizability of results: the gap between published reports and study protocols. AIDS 2005; 19:1885–96. [DOI] [PubMed] [Google Scholar]
- 10.van der Straten A, Van Damme L, Haberer JE, Bangsberg DR. Unraveling the divergent results of pre-exposure prophylaxis trials for HIV prevention. AIDS 2012; 26:F13–9. [DOI] [PubMed] [Google Scholar]
- 11.Cremin I, Alsallaq R, Dybul M, Piot P, Garnett G, Hallett TB. The new role of antiretrovirals in combination HIV prevention: a mathematical modelling analysis. AIDS 2013; 27:447–58. [DOI] [PubMed] [Google Scholar]
- 12.Desai K, Sansom SL, Ackers ML et al. Modeling the impact of HIV chemoprophylaxis strategies among men who have sex with men in the United States: HIV infections prevented and cost-effectiveness. AIDS 2008; 22:1829–39. [DOI] [PubMed] [Google Scholar]
- 13.Kessler J, Myers JE, Nucifora KA et al. Evaluating the impact of prioritization of antiretroviral pre-exposure prophylaxis in New York. AIDS 2014; 28:2683–91. [DOI] [PMC free article] [PubMed] [Google Scholar]
- 14.Chen A, Dowdy DW. Clinical effectiveness and cost-effectiveness of HIV pre-exposure prophylaxis in men who have sex with men: risk calculators for real-world decision-making. PLoS One 2014; 9:e108742. [DOI] [PMC free article] [PubMed] [Google Scholar]
- 15.Sullivan PS, Rosenberg ES, Sanchez TH et al. Explaining racial disparities in HIV incidence in black and white men who have sex with men in Atlanta, GA: a prospective observational cohort study. Ann Epidemiol 2015; 25:445–54. [DOI] [PMC free article] [PubMed] [Google Scholar]
- 16.Hernández-Romieu AC, Sullivan PS, Rothenberg R et al. Heterogeneity of HIV prevalence among the sexual networks of black and white men who have sex with men in Atlanta: illuminating a mechanism for increased HIV risk for young black men who have sex with men. Sex Transm Dis 2015; 42:505–12. [DOI] [PMC free article] [PubMed] [Google Scholar]
- 17.Jenness S, Goodreau S, Morris M. EpiModel: mathematical modeling of infectious disease. 2015; doi:10.5281/zenodo.16767. [DOI] [PMC free article] [PubMed]
- 18.Goodreau SM, Carnegie NB, Vittinghoff E et al. What drives the US and Peruvian HIV epidemics in men who have sex with men (MSM)? PLoS One 2012; 7:e50522. [DOI] [PMC free article] [PubMed] [Google Scholar]
- 19.Krivitsky PN, Handcock MS. A separable model for dynamic networks. J R Stat Soc Ser B Stat Methodol 2014; 76:29–46. [DOI] [PMC free article] [PubMed] [Google Scholar]
- 20.Carnegie NB, Goodreau SM, Liu A et al. Targeting pre-exposure prophylaxis among men who have sex with men in the United States and Peru: partnership types, contact rates, and sexual role. J Acquir Immune Defic Syndr 2015; 69:119–25. [DOI] [PMC free article] [PubMed] [Google Scholar]
- 21.Hughes JP, Baeten JM, Lingappa JR et al. Determinants of per-coital-act HIV-1 infectivity among African HIV-1-serodiscordant couples. J Infect Dis 2012; 205:358–65. [DOI] [PMC free article] [PubMed] [Google Scholar]
- 22.Weller S, Davis K. Condom effectiveness in reducing heterosexual HIV transmission. Cochrane Database Syst Rev 2002; 1:CD003255. [DOI] [PubMed] [Google Scholar]
- 23.Wiysonge CS, Kongnyuy EJ, Shey M et al. Male circumcision for prevention of homosexual acquisition of HIV in men. Cochrane Database Syst Rev 2011; 6:CD007496. [DOI] [PubMed] [Google Scholar]
- 24.Zimmerman PA, Buckler-White A, Alkhatib G et al. Inherited resistance to HIV-1 conferred by an inactivating mutation in CC chemokine receptor 5: studies in populations with contrasting clinical phenotypes, defined racial background, and quantified risk. Mol Med 1997; 3:23–36. [PMC free article] [PubMed] [Google Scholar]
- 25.Marmor M, Sheppard HW, Donnell D et al. Homozygous and heterozygous CCR5-delta32 genotypes are associated with resistance to HIV infection. J Acquir Immune Defic Syndr 2001; 27:472–81. [DOI] [PubMed] [Google Scholar]
- 26.Cohen MS, Chen YQ, McCauley M et al. Prevention of HIV-1 infection with early antiretroviral therapy. N Engl J Med 2011; 365:493–505. [DOI] [PMC free article] [PubMed] [Google Scholar]
- 27.Goodreau SM, Carnegie NB, Vittinghoff E et al. Can male circumcision have an impact on the HIV epidemic in men who have sex with men? PLoS One 2014; 9:e102960. [DOI] [PMC free article] [PubMed] [Google Scholar]
- 28.Rosser B, Bockting W, Rugg D et al. A randomized controlled intervention trial of a sexual health approach to long-term HIV risk reduction for men who have sex with men: effects of the intervention on unsafe sexual behavior. AIDS Educ Prev 2002; 14(3 suppl A):59–71. [DOI] [PubMed] [Google Scholar]
- 29.Liu AY, Cohen SE, Vittinghoff E et al. Preexposure prophylaxis for HIV infection integrated with municipal- and community-based sexual health services. JAMA Intern Med 2015; 176:75–84. [DOI] [PMC free article] [PubMed] [Google Scholar]
- 30.Marcus JL, Glidden DV, Mayer KH et al. No evidence of sexual risk compensation in the iPrEx trial of daily oral HIV preexposure prophylaxis. PLoS One 2013; 8:e81997. [DOI] [PMC free article] [PubMed] [Google Scholar]
- 31.Toni T, Welch D, Strelkowa N, Ipsen A, Stumpf MPH. Approximate Bayesian computation scheme for parameter inference and model selection in dynamical systems. J R Soc Interface 2009; 6:187–202. [DOI] [PMC free article] [PubMed] [Google Scholar]
- 32.Kelley CF, Kahle E, Siegler A et al. Applying a PrEP continuum of care for men who have sex with men in Atlanta, GA. Clin Infect Dis 2015; 61:1590–7. [DOI] [PMC free article] [PubMed] [Google Scholar]
- 33.Holtgrave D, Qualls N, Curran JW, Valdisseri R, Guinan M, Parra W. An overview of the effectiveness and efficiency of HIV prevention programs. Public Heal Rep 1995; 110:134–46. [PMC free article] [PubMed] [Google Scholar]
- 34.Ouellet E, Durand M, Guertin JR, LeLorier J, Tremblay CL. Cost effectiveness of “on demand” HIV pre-exposure prophylaxis for non-injection drug-using men who have sex with men in Canada. Can J Infect Dis Med Microbiol 2015; 26:23–9. [DOI] [PMC free article] [PubMed] [Google Scholar]
- 35.Ware N, Wyatt M, Haberer J et al. What's love got to do with it? explaining adherence to oral antiretroviral pre-exposure prophylaxis (PrEP) for HIV serodiscordant couples. J Acquir Immune Defic Syndr 2012; 59:463–8. [DOI] [PMC free article] [PubMed] [Google Scholar]
- 36.Paltiel A, Freedberg K, Scott C et al. HIV preexposure prophylaxis in the United States: impact on lifetime infection risk, clinical outcomes, and cost-effectiveness. Clin Infect Dis 2009; 48:806–15. [DOI] [PMC free article] [PubMed] [Google Scholar]
- 37.Mayer KH, Hosek S, Cohen S et al. Antiretroviral pre-exposure prophylaxis implementation in the United States: a work in progress. J Int AIDS Soc 2015; 18(4 suppl 3):19980. [DOI] [PMC free article] [PubMed] [Google Scholar]
- 38.Lucas J, King G, Watkins P et al. The utilization of good participatory practice (GPP) during the planning and implementation of a PrEP study among black MSM. AIDS Res Hum Retroviruses 2014; 30:A52. [Google Scholar]
- 39.Molina J-M, Capitant C, Spire B et al. On-demand preexposure prophylaxis in men at high risk for HIV-1 infection. N Engl J Med 2015; 373:2237–46. [DOI] [PubMed] [Google Scholar]
- 40.Crepaz N, Marks G, Liau A et al. Prevalence of unprotected anal intercourse among HIV-diagnosed MSM in the United States: a meta-analysis. AIDS 2009; 23:1617–29. [DOI] [PubMed] [Google Scholar]
- 41.Prevalence and awareness of HIV infection among men who have sex with men—21 cities, United States, 2008. MMWR Morb Mortal Wkly Rep 2010; 59:1201–7. [PubMed] [Google Scholar]
Associated Data
This section collects any data citations, data availability statements, or supplementary materials included in this article.