

Abstract
Background
Pistachio (Pistacia vera L.) is one of the most important nut crops in the world. There are about 11 wild species in the genus Pistacia, and they have importance as rootstock seed sources for cultivated P. vera and forest trees. Published information on the pistachio genome is limited. Therefore, a genome survey is necessary to obtain knowledge on the genome structure of pistachio by next generation sequencing. Simple sequence repeat (SSR) markers are useful tools for germplasm characterization, genetic diversity analysis, and genetic linkage mapping, and may help to elucidate genetic relationships among pistachio cultivars and species.
Results
To explore the genome structure of pistachio, a genome survey was performed using the Illumina platform at approximately 40× coverage depth in the P. vera cv. Siirt. The K-mer analysis indicated that pistachio has a genome that is about 600 Mb in size and is highly heterozygous. The assembly of 26.77 Gb Illumina data produced 27,069 scaffolds at N50 = 3.4 kb with a total of 513.5 Mb. A total of 59,280 SSR motifs were detected with a frequency of 8.67 kb. A total of 206 SSRs were used to characterize 24 P. vera cultivars and 20 wild Pistacia genotypes (four genotypes from each five wild Pistacia species) belonging to P. atlantica, P. integerrima, P. chinenesis, P. terebinthus, and P. lentiscus genotypes. Overall 135 SSR loci amplified in all 44 cultivars and genotypes, 41 were polymorphic in six Pistacia species. The novel SSR loci developed from cultivated pistachio were highly transferable to wild Pistacia species.
Conclusions
The results from a genome survey of pistachio suggest that the genome size of pistachio is about 600 Mb with a high heterozygosity rate. This information will help to design whole genome sequencing strategies for pistachio. The newly developed novel polymorphic SSRs in this study may help germplasm characterization, genetic diversity, and genetic linkage mapping studies in the genus Pistacia.
Electronic supplementary material
The online version of this article (doi:10.1186/s12864-016-3359-x) contains supplementary material, which is available to authorized users.
Keywords: Pistachio, Genome survey, Genome size, SSR, Genetic diversity
Background
Pistacia is a genus of flowering plants in the cashew family, Anacardiaceae, which also contains mango, poison ivy, poison oak, pepper tree, and sumac plants [1]. The Pistacia genus consists of at least 11 species and is estimated to be about 80 million years old [2]. The pistachio is native to the arid zones of Central Asia; it has been cultivated for 3000–4000 years in Iran and was introduced into Mediterranean Europe by the Romans at the beginning of the Christian era [3]. Pistachio cultivation extended westward from its center of origin to Italy, Spain, and other Mediterranean regions of Southern Europe, North Africa, and the Middle East, as well as to China and more recently to the United States and Australia [4, 5].
Currently, Iran, the United States, Turkey, and Syria are the main pistachio producers in the world [6]. The main cultivation area in Turkey is in the South East, especially in Gaziantep, Şanlıurfa, Siirt, and Kahramanmaraş provinces, which cover 90–95% of pistachio production. Moreover, wild trees of Pistacia species such as P. atlantica Desf., P. eurycarpa, Yalt., P. lentiscus L., and P. terebinthus L., expanded in almost all parts of Anatolia. Other well-known Pistacia species in the world are P. integerrima Stewart and P. chinensis Bunge. [7]. Pistachio plants are long-living with a juvenile period of approximately 5–10 years. In addition, wild Pistacia species have edible seeds and are used as rootstock seed sources for cultivated P. vera, and sometimes, fruit consumption, oil extraction, soap production, and as forest trees [8].
Several molecular markers such as randomly amplified polymorphic DNA (RAPD) [9, 10], simple sequence repeat (SSR) [11], sequence-related amplified polymorphism (SRAP) [12], amplified fragment length polymorphism (AFLP) [1, 13], inter-simple sequence repeats (ISSR) [14], selectively amplified microsatellite polymorphic loci (SAMPL) [15], and single nucleotide polymorphism (SNP) [16] have been used to assess the genetic diversity, fingerprinting, phylogenetic relationships, germplasm characterization, sex determination, and genetic linkage mapping in cultivated and wild Pistacia species.
SSRs are useful tools as molecular markers and are very polymorphic due to their high mutation rate, which affects the number of repeat units [17]. They are very useful for assaying diversity in natural populations or germplasm collections, and for fingerprinting and parental identification. They are very valuable markers especially for genetic linkage mapping and evolutionary studies [18] and have a high level of transferability between closely related species. The development of SSR markers from P. vera [11, 19–21] and wild Pistacia species has been described in several studies [22, 23].
Next generation sequencing (NGS) has provided a new perspective for research, owing to its high throughout and speed of data generation. So far, NGS has been applied to genomics-based strategies to discover sequences for new SSR markers in plants, in a time and cost-effective manner [24]. SSR development studies from a genome survey were performed in different plant species [25–27]. Genome survey studies also provide information about genome structure of a plant species, including estimates of genome size, levels of heterozygosity, and repeat contents. A study by Horjales et al. [28] is the only one in the literature to estimate genome size in the genus Pistacia. The genome size of P. terebinthus was estimated to be 2C = 1.32 Gb by flow cytometry.
Recently, genetic structure analyses have focused on the collection, protection, and utilization of germplasm for a plant species [29, 30]. It is important to explore population structure to avoid false genetic trends and to identify cultivars with specific or minor alleles that will be important for molecular breeding programs [31]. However, as far as we know, information on the population structure of Pistacia collections assessed using a large and comprehensive set of SSR markers is limited.
In this study, we aim to (1) estimate the genome size, GC content, and heterozygosity rates of pistachio (P. vera cv. Siirt) using a genome survey, (2) to perform genome-wide characterization of SSRs in the P. vera genome, (3) develop novel SSR markers for Pistacia species from a genome survey study, (4) determine transferable and polymorphic SSR markers for other Pistacia species, and (5) reveal the population structure of Pistacia germplasm. To our knowledge, this is the first report revealing genome structure and genome-wide SSRs in pistachio. The results of this study will provide essential information for further studies in pistachio such as whole genome sequencing and SSR-based genetic linkage mapping.
Results
K-mer analysis
A total of 26.77 Gb were used for K-mer analysis. The 17-mer frequency distribution derived from the sequencing reads was plotted in Fig. 1; the peak of the 17-mer distribution was about 28, and the total K-mer count was 16,684,162,450; therefore, the genome size of pistachio was estimated as 596 Mb. A small peak observed at half the peak-depth showed a high level of heterozygosity for P. vera. Simulation of the P. vera genome with different heterozygosity rates showed it to be about 1% (Fig. 1). We did not observe a fat tail in the K-mer analysis; therefore, the number of repeats in the pistachio genome may be low. The distribution of GC content versus sequencing depth (Fig. 2) may provide information about sequencing bias. The GC content was about 37.1% in pistachio. There is also a region (red region) with an average depth around half that of main average depth, which may be caused by the high rate of heterozygosity.
Fig. 1.

17 K-mer analysis for estimating the genome size of Pistacia vera cv. Siirt. The X-axis is depth (X) and the Y-axis is the proportion that represents the frequency at that depth. The H_0.01 means that the heterozygous rate is 1%
Fig. 2.
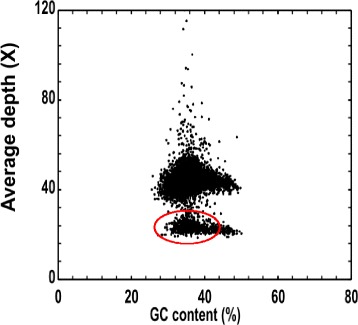
GC content and average sequencing depth. The X-axis represents GC content and the Y-axis represents the average depth. Red region whose average depth is around the half of main average depth, which may be caused by the high heterozygous rate
Assembly and identification of SSR loci in P. vera
Assembly was performed using 26.77-Gb Illumina PE reads. The length of contig N50 was 2327 bp, and the scaffold N50 was 3399-bp long. The total length of scaffolds was 513.5 Mb. The number of scaffolds ≥100 bp was 893,901 and ≥2 kb were 44,900 (Table 1).
Table 1.
The result of assembly in P. vera cv. Siirt using 26.77 Gb Illumina data
| Contigs | Scaffolds | |||
|---|---|---|---|---|
| Size(bp) | Number | Size(bp) | Number | |
| N90 | 121 | 521,093 | 130 | 417,692 |
| N80 | 262 | 230,751 | 442 | 163,608 |
| N70 | 699 | 118,780 | 989 | 85,774 |
| N60 | 1325 | 67,518 | 1874 | 47,596 |
| N50a | 2327 | 39,274 | 3399 | 27,069 |
| Total Size | 490,733,307 | - | 513,504,777 | - |
| Total Number(> = 100 bp) | 980,753 | - | 893,901 | |
| Total Number(> = 2 kb) | 45,572 | - | 44,900 | |
a.The N50 of contigs or scaffolds was calculated by ordering all sequences, then adding the lengths from the longest to shortest until the added length exceeded 50% of the total length of all sequences.N60, N70, N80 and N90 were similarly defined
A total of 59,280 di-, tri-, tetra-, penta-, and hexanucleotide SSR motifs (6, 5, 4, 4, and 4 repeat numbers, respectively) were detected, and the dinucleotide motifs were the most abundant type of repeats (63.2%) in pistachio (Fig. 3), followed by tri- (18.0%), tetra- (12.8%), penta- (3.8%), and hexanucleotide motifs (2.2%). The most abundant repeats were AT/AT (23.0%) and TA/TA (21.6%), followed by AG/CT (7.6%) and GA/TC (6.2%), AAT/ATT (4.1%), CA/TG (2.6%), and TAA/ATT (2.6%; Fig. 4). The most abundant tetra- and pentanucleotide repeat motif types were AAAT/ATTT (2.1%) and AAAAT/ATTTT (0.44%) respectively. AAAAAT/ATTTTT and GCCCAA/TTGGGC motifs were the most abundant (0.07%) hexanucleotide motifs. The distribution of SSRs in the pistachio genome was calculated as one SSR per 8.67 kb.
Fig. 3.

Distribution of 59,280 SSRs in the pistachio genome based on repeat type
Fig. 4.

Distribution of SSR motifs in pistachio at 40x coverage sequencing data. The X-axis represents motif types and the Y-axis represents the count of motifs in whole genome of pistachio
Development, screening, and polymorphism of SSRs
In the initial screen of 950 randomly selected SSR primer pairs in three (P. vera cv. Siirt, P. vera cv. Bağyolu and one monoecious P. atlantica) genotypes, 610 (64.2%) generated amplification products, 197 (20.7%) loci were monomorphic, and the remaining 143 (15.1%) SSR loci failed to generate amplification products. Of the 610 that amplified, 204 polymorphic and easily scorable SSR loci were selected to study genetic diversity in Pistacia. Of these, 193 were perfect (94.6%), 8 (3.9%) were compound, and 3 (1.5%) were interrupted repeats. Dinucleotide motifs were the most abundant (63.2%), followed by tri- (18.0%), hexa- (12.8%), tetra- (3.8%), and pentanucleotide motifs (2.2%). The sequences of 204 SSR loci were deposited into NCBI and were given in Additional file 1 (GenBank accession numbers KX223398- KX223601; Additional file 1). Two SSR primer pairs (CUPVSiirt568 and CUPVSiirt689) amplified at two loci, and 206 SSR loci were obtained and used to study genetic diversity in Pistacia.
Diversity measures of novel SSR loci in Pistacia
Genetic diversity was studied by analyzing a total of 44 cultivars and genotypes: 24 P. vera cultivars and 20 wild Pistacia genotypes (four genotypes from each five of wild Pistacia species) belonging to P. atlantica, P. integerrima, P. chinenesis, P. terebinthus, and P. lentiscus genotypes. Allele ranges, number of alleles (Na), effective number of alleles (Ne), polymorphism information content (PIC), expected (He), and observed (Ho) heterozygosities of the 206 SSR loci are presented in Table 2.
Table 2.
Novel SSR loci with genetic diversity measures in 44 Pistacia genotypes: allele ranges, number of alleles (Na), number of effective alleles (Ne), observed heterozygosity (Ho), expected heterozygosity (He), and PIC values of 206 loci
| No | Loci | Allele ranges (bp) | Na | Ne | Ho | He | PIC |
|---|---|---|---|---|---|---|---|
| 1 | CUPVSiirt15a | 96–123 | 10 | 5.12 | 0.45 | 0.80 | 0.79 |
| 2 | CUPVSiirt17 | 103–109 | 2 | 1.26 | 0.00 | 0.20 | 0.18 |
| 3 | CUPVSiirt18 | 181–185 | 2 | 1.09 | 0.09 | 0.08 | 0.08 |
| 4 | CUPVSiirt22a | 134–182 | 13 | 8.64 | 0.46 | 0.88 | 0.87 |
| 5 | CUPVSiirt26ab | 164–190 | 9 | 4.39 | 0.39 | 0.77 | 0.74 |
| 6 | CUPVSiirt37ab | 140–167 | 14 | 7.43 | 0.60 | 0.87 | 0.85 |
| 7 | CUPVSiirt45a | 123–133 | 2 | 1.89 | 0.12 | 0.47 | 0.36 |
| 8 | CUPVSiirt50 | 155–190 | 10 | 4.94 | 0.33 | 0.80 | 0.77 |
| 9 | CUPVSiirt71a | 128–168 | 11 | 5.75 | 0.37 | 0.83 | 0.81 |
| 10 | CUPVSiirt76a | 153–188 | 8 | 5.72 | 0.29 | 0.83 | 0.80 |
| 11 | CUPVSiirt86a | 111–159 | 19 | 8.96 | 0.82 | 0.89 | 0.88 |
| 12 | CUPVSiirt95a | 191–235 | 13 | 5.74 | 0.40 | 0.83 | 0.81 |
| 13 | CUPVSiirt115 | 166–173 | 6 | 5.94 | 0.28 | 0.83 | 0.81 |
| 14 | CUPVSiirt121 | 106–143 | 6 | 2.45 | 0.10 | 0.59 | 0.55 |
| 15 | CUPVSiirt125a | 167–224 | 12 | 6.73 | 0.57 | 0.85 | 0.83 |
| 16 | CUPVSiirt129ab | 127–172 | 16 | 6.76 | 0.59 | 0.85 | 0.84 |
| 17 | CUPVSiirt131a | 156–175 | 8 | 2.96 | 0.38 | 0.66 | 0.62 |
| 18 | CUPVSiirt140a | 213–235 | 7 | 5.10 | 0.33 | 0.80 | 0.78 |
| 19 | CUPVSiirt149a | 98–136 | 15 | 5.25 | 0.43 | 0.81 | 0.79 |
| 20 | CUPVSiirt151 | 150–172 | 9 | 4.17 | 0.40 | 0.76 | 0.73 |
| 21 | CUPVSiirt158a | 121–243 | 9 | 6.27 | 0.47 | 0.84 | 0.82 |
| 22 | CUPVSiirt171a | 138–161 | 4 | 2.74 | 0.25 | 0.64 | 0.59 |
| 23 | CUPVSiirt186a | 140–182 | 15 | 4.42 | 0.56 | 0.77 | 0.76 |
| 24 | CUPVSiirt213a | 205–223 | 7 | 2.57 | 0.34 | 0.61 | 0.58 |
| 25 | CUPVSiirt230a | 177–216 | 12 | 4.77 | 0.30 | 0.79 | 0.77 |
| 26 | CUPVSiirt238 | 171–195 | 8 | 3.80 | 0.37 | 0.74 | 0.70 |
| 27 | CUPVSiirt242a | 129–167 | 13 | 6.13 | 0.49 | 0.84 | 0.82 |
| 28 | CUPVSiirt243a | 137–166 | 13 | 4.80 | 0.41 | 0.79 | 0.77 |
| 29 | CUPVSiirt256ab | 171–199 | 7 | 3.20 | 0.36 | 0.69 | 0.63 |
| 30 | CUPVSiirt259a | 186–218 | 10 | 5.33 | 0.58 | 0.81 | 0.79 |
| 31 | CUPVSiirt265a | 111–200 | 5 | 2.97 | 0.17 | 0.66 | 0.62 |
| 32 | CUPVSiirt271 | 96–118 | 10 | 5.24 | 0.67 | 0.81 | 0.78 |
| 33 | CUPVSiirt284ab | 220–256 | 12 | 6.08 | 0.39 | 0.84 | 0.82 |
| 34 | CUPVSiirt294a | 114–138 | 10 | 6.24 | 0.34 | 0.84 | 0.82 |
| 35 | CUPVSiirt297a | 136–146 | 8 | 5.51 | 0.30 | 0.82 | 0.79 |
| 36 | CUPVSiirt298 | 106–198 | 18 | 6.86 | 0.67 | 0.85 | 0.84 |
| 37 | CUPVSiirt308a | 166–175 | 8 | 4.62 | 0.33 | 0.78 | 0.76 |
| 38 | CUPVSiirt312a | 154–172 | 8 | 2.27 | 0.29 | 0.56 | 0.54 |
| 39 | CUPVSiirt316 | 254–280 | 7 | 2.87 | 0.31 | 0.65 | 0.62 |
| 40 | CUPVSiirt320a | 173–179 | 2 | 1.83 | 0.50 | 0.45 | 0.35 |
| 41 | CUPVSiirt328 | 181–204 | 6 | 2.52 | 0.40 | 0.60 | 0.58 |
| 42 | CUPVSiirt333a | 127–159 | 11 | 5.92 | 0.51 | 0.83 | 0.81 |
| 43 | CUPVSiirt340a | 125–171 | 12 | 6.45 | 0.48 | 0.85 | 0.83 |
| 44 | CUPVSiirt343 | 121–127 | 4 | 1.96 | 0.33 | 0.49 | 0.43 |
| 45 | CUPVSiirt349ab | 164–199 | 13 | 5.69 | 0.63 | 0.82 | 0.8 |
| 46 | CUPVSiirt357a | 181–231 | 14 | 9.24 | 0.60 | 0.89 | 0.88 |
| 47 | CUPVSiirt358 | 215–269 | 9 | 5.80 | 0.27 | 0.83 | 0.81 |
| 48 | CUPVSiirt368 | 152–188 | 7 | 2.49 | 0.03 | 0.60 | 0.57 |
| 49 | CUPVSiirt415 | 140–170 | 6 | 3.59 | 0.28 | 0.72 | 0.68 |
| 50 | CUPVSiirt436ab | 91–118 | 13 | 6.01 | 0.68 | 0.83 | 0.82 |
| 51 | CUPVSiirt446a | 221–242 | 4 | 1.96 | 0.36 | 0.49 | 0.42 |
| 52 | CUPVSiirt465a | 112–178 | 16 | 9.93 | 0.45 | 0.90 | 0.89 |
| 53 | CUPVSiirt472a | 172–325 | 16 | 4.67 | 0.44 | 0.79 | 0.77 |
| 54 | CUPVSiirt476ab | 145–171 | 9 | 6.01 | 0.43 | 0.83 | 0.82 |
| 55 | CUPVSiirt479 | 165–192 | 5 | 2.01 | 0.48 | 0.50 | 0.46 |
| 56 | CUPVSiirt496 | 158–239 | 14 | 3.94 | 0.26 | 0.75 | 0.73 |
| 57 | CUPVSiirt501 | 146–171 | 6 | 2.26 | 0.34 | 0.56 | 0.52 |
| 58 | CUPVSiirt505ab | 146–186 | 13 | 4.20 | 0.43 | 0.76 | 0.74 |
| 59 | CUPVSiirt509ab | 162–188 | 12 | 3.28 | 0.36 | 0.69 | 0.67 |
| 60 | CUPVSiirt543a | 111–149 | 11 | 6.76 | 0.63 | 0.85 | 0.84 |
| 61 | CUPVSiirt565ab | 134–174 | 16 | 7.49 | 0.43 | 0.87 | 0.85 |
| 62 | CUPVSiirt568x | 100–117 | 5 | 2.46 | 0.21 | 0.59 | 0.52 |
| 63 | CUPVSiirt568y | 117–145 | 15 | 8.50 | 0.48 | 0.88 | 0.87 |
| 64 | CUPVSiirt569a | 95–109 | 5 | 3.99 | 0.62 | 0.75 | 0.71 |
| 65 | CUPVSiirt598 | 163–204 | 14 | 7.38 | 0.60 | 0.86 | 0.85 |
| 66 | CUPVSiirt600 | 225–241 | 8 | 5.17 | 0.54 | 0.81 | 0.78 |
| 67 | CUPVSiirt616 | 98–204 | 13 | 9.88 | 0.51 | 0.90 | 0.89 |
| 68 | CUPVSiirt617 | 277–290 | 4 | 3.12 | 0.39 | 0.68 | 0.62 |
| 69 | CUPVSiirt621a | 93–129 | 9 | 3.98 | 0.33 | 0.75 | 0.72 |
| 70 | CUPVSiirt625a | 152–191 | 15 | 9.05 | 0.36 | 0.89 | 0.88 |
| 71 | CUPVSiirt649a | 158–177 | 4 | 2.68 | 0.47 | 0.63 | 0.56 |
| 72 | CUPVSiirt660ab | 129–146 | 10 | 3.89 | 0.62 | 0.74 | 0.71 |
| 73 | CUPVSiirt661 | 209–288 | 7 | 3.28 | 0.44 | 0.70 | 0.67 |
| 74 | CUPVSiirt674 | 235–249 | 6 | 2.60 | 0.32 | 0.61 | 0.57 |
| 75 | CUPVSiirt689x | 200–210 | 5 | 2.10 | 0.38 | 0.52 | 0.50 |
| 76 | CUPVSiirt689y | 306–314 | 4 | 2.18 | 0.49 | 0.54 | 0.45 |
| 77 | CUPVSiirt690 | 215–221 | 2 | 1.40 | 0.16 | 0.28 | 0.24 |
| 78 | CUPVSiirt712 | 180–210 | 9 | 3.07 | 0.46 | 0.67 | 0.64 |
| 79 | CUPVSiirt715 | 139–176 | 9 | 2.64 | 0.25 | 0.62 | 0.59 |
| 80 | CUPVSiirt719ab | 190–234 | 13 | 6.99 | 0.71 | 0.86 | 0.84 |
| 81 | CUPVSiirt724 | 132–138 | 3 | 2.88 | 0.38 | 0.65 | 0.58 |
| 82 | CUPVSiirt742a | 196–232 | 14 | 3.19 | 0.30 | 0.69 | 0.67 |
| 83 | CUPVSiirt743 | 159–205 | 12 | 6.70 | 0.39 | 0.85 | 0.83 |
| 84 | CUPVSiirt764a | 161–206 | 9 | 6.14 | 0.56 | 0.84 | 0.82 |
| 85 | CUPVSiirt768ab | 206–220 | 6 | 3.43 | 0.60 | 0.71 | 0.67 |
| 86 | CUPVSiirt782ab | 172–202 | 10 | 4.41 | 0.5 | 0.77 | 0.75 |
| 87 | CUPVSiirt788 | 205–262 | 16 | 6.48 | 0.43 | 0.85 | 0.83 |
| 88 | CUPVSiirt794 | 206–244 | 14 | 5.90 | 0.65 | 0.83 | 0.81 |
| 89 | CUPVSiirt796ab | 92–130 | 17 | 8.32 | 0.66 | 0.88 | 0.87 |
| 90 | CUPVSiirt803 | 202–266 | 8 | 3.49 | 0.36 | 0.71 | 0.68 |
| 91 | CUPVSiirt818a | 165–187 | 10 | 5.65 | 0.48 | 0.82 | 0.80 |
| 92 | CUPVSiirt836a | 144–174 | 13 | 2.69 | 0.23 | 0.63 | 0.61 |
| 93 | CUPVSiirt838ab | 139–181 | 14 | 6.21 | 0.76 | 0.84 | 0.82 |
| 94 | CUPVSiirt841 | 146–186 | 14 | 5.81 | 0.59 | 0.83 | 0.81 |
| 95 | CUPVSiirt847 | 226–256 | 9 | 6.13 | 0.50 | 0.84 | 0.82 |
| 96 | CUPVSiirt855a | 237–278 | 9 | 4.17 | 0.43 | 0.76 | 0.74 |
| 97 | CUPVSiirt858a | 167–198 | 11 | 4.62 | 0.63 | 0.78 | 0.76 |
| 98 | CUPVSiirt875 | 157–190 | 13 | 4.23 | 0.28 | 0.76 | 0.74 |
| 99 | CUPVSiirt876ab | 180–221 | 16 | 8.05 | 0.77 | 0.88 | 0.86 |
| 100 | CUPVSiirt883 | 172–219 | 12 | 3.69 | 0.28 | 0.73 | 0.71 |
| 101 | CUPVSiirt889a | 168–188 | 8 | 4.57 | 0.40 | 0.78 | 0.75 |
| 102 | CUPVSiirt891a | 130–168 | 6 | 3.82 | 0.28 | 0.74 | 0.70 |
| 103 | CUPVSiirt907 | 92–98 | 3 | 2.86 | 0.45 | 0.65 | 0.58 |
| 104 | CUPVSiirt924a | 81–89 | 4 | 1.49 | 0.00 | 0.33 | 0.31 |
| 105 | CUPVSiirt929a | 81–105 | 13 | 5.66 | 0.40 | 0.82 | 0.81 |
| 106 | CUPVSiirt931a | 146–340 | 7 | 4.59 | 0.12 | 0.78 | 0.75 |
| 107 | CUPVSiirt932 | 123–132 | 7 | 3.48 | 0.43 | 0.71 | 0.67 |
| 108 | CUPVSiirt949a | 160–197 | 9 | 4.31 | 0.34 | 0.77 | 0.74 |
| 109 | CUPVSiirt951 | 154–184 | 6 | 1.78 | 0.08 | 0.44 | 0.42 |
| 110 | CUPVSiirt956a | 105–200 | 18 | 6.31 | 0.42 | 0.84 | 0.83 |
| 111 | CUPVSiirt961a | 177–210 | 10 | 5.85 | 0.33 | 0.83 | 0.81 |
| 112 | CUPVSiirt975a | 139–154 | 6 | 3.44 | 0.30 | 0.71 | 0.66 |
| 113 | CUPVSiirt986a | 146–169 | 10 | 3.09 | 0.41 | 0.68 | 0.65 |
| 114 | CUPVSiirt989a | 140–176 | 13 | 4.10 | 0.32 | 0.76 | 0.74 |
| 115 | CUPVSiirt1003ab | 71–112 | 12 | 7.87 | 0.49 | 0.87 | 0.86 |
| 116 | CUPVSiirt1008a | 163–174 | 6 | 2.93 | 0.20 | 0.66 | 0.60 |
| 117 | CUPVSiirt1017a | 203–245 | 16 | 6.14 | 0.50 | 0.84 | 0.82 |
| 118 | CUPVSiirt1021a | 123–143 | 6 | 3.03 | 0.57 | 0.67 | 0.63 |
| 119 | CUPVSiirt1041a | 100–114 | 7 | 4.62 | 0.40 | 0.78 | 0.75 |
| 120 | CUPVSiirt1043a | 89–157 | 13 | 3.43 | 0.30 | 0.71 | 0.69 |
| 121 | CUPVSiirt1047ab | 125–157 | 11 | 3.74 | 0.34 | 0.73 | 0.72 |
| 122 | CUPVSiirt1053a | 145–189 | 9 | 4.05 | 0.40 | 0.75 | 0.72 |
| 123 | CUPVSiirt1055a | 151–180 | 7 | 2.83 | 0.24 | 0.65 | 0.62 |
| 124 | CUPVSiirt1057a | 226–258 | 12 | 5.05 | 0.42 | 0.8 | 0.78 |
| 125 | CUPVSiirt1062a | 138–172 | 12 | 3.84 | 0.56 | 0.74 | 0.71 |
| 126 | CUPVSiirt1071ab | 123–169 | 16 | 7.69 | 0.63 | 0.87 | 0.86 |
| 127 | CUPVSiirt1092a | 136–165 | 11 | 6.15 | 0.56 | 0.84 | 0.82 |
| 128 | CUPVSiirt1095 | 126–290 | 11 | 7.78 | 0.58 | 0.87 | 0.86 |
| 129 | CUPVSiirt1116a | 151–191 | 15 | 5.37 | 0.57 | 0.81 | 0.80 |
| 130 | CUPVSiirt1117a | 143–172 | 12 | 7.74 | 0.56 | 0.87 | 0.86 |
| 131 | CUPVSiirt1120ab | 193–218 | 11 | 4.50 | 0.39 | 0.78 | 0.75 |
| 132 | CUPVSiirt1122 | 121–215 | 7 | 5.54 | 0.45 | 0.82 | 0.80 |
| 133 | CUPVSiirt1127 | 118–142 | 9 | 4.74 | 0.50 | 0.79 | 0.77 |
| 134 | CUPVSiirt1140a | 156–176 | 8 | 5.94 | 0.40 | 0.83 | 0.81 |
| 135 | CUPVSiirt1145ab | 150–174 | 12 | 5.98 | 0.58 | 0.83 | 0.81 |
| 136 | CUPVSiirt1153a | 172–201 | 8 | 3.96 | 0.26 | 0.75 | 0.72 |
| 137 | CUPVSiirt1163 | 140–166 | 7 | 3.80 | 0.43 | 0.74 | 0.70 |
| 138 | CUPVSiirt1171 | 229–270 | 14 | 3.07 | 0.38 | 0.67 | 0.66 |
| 139 | CUPVSiirt1182ab | 155–179 | 8 | 4.46 | 0.43 | 0.78 | 0.75 |
| 140 | CUPVSiirt1183 | 235–250 | 7 | 4.48 | 0.33 | 0.78 | 0.75 |
| 141 | CUPVSiirt1188 | 116–168 | 3 | 2.56 | 0.31 | 0.61 | 0.54 |
| 142 | CUPVSiirt1189 | 247–267 | 5 | 2.56 | 0.36 | 0.61 | 0.56 |
| 143 | CUPVSiirt1191 | 154–190 | 5 | 3.19 | 0.46 | 0.69 | 0.65 |
| 144 | CUPVSiirt1202ab | 174–212 | 16 | 4.18 | 0.50 | 0.76 | 0.74 |
| 145 | CUPVSiirt1214a | 157–182 | 10 | 4.56 | 0.15 | 0.78 | 0.76 |
| 146 | CUPVSiirt1224ab | 257–292 | 9 | 6.37 | 0.53 | 0.84 | 0.82 |
| 147 | CUPVSiirt1238ab | 229–258 | 11 | 3.88 | 0.45 | 0.74 | 0.72 |
| 148 | CUPVSiirt1243ab | 134–164 | 14 | 6.64 | 0.20 | 0.85 | 0.84 |
| 149 | CUPVSiirt1250a | 175–192 | 10 | 4.77 | 0.40 | 0.79 | 0.76 |
| 150 | CUPVSiirt1260a | 151–184 | 10 | 3.21 | 0.36 | 0.69 | 0.66 |
| 151 | CUPVSiirt1267 | 124–155 | 9 | 4.78 | 0.49 | 0.79 | 0.77 |
| 152 | CUPVSiirt1271a | 203–234 | 10 | 3.76 | 0.23 | 0.73 | 0.72 |
| 153 | CUPVSiirt1273a | 135–160 | 6 | 2.53 | 0.75 | 0.61 | 0.55 |
| 154 | CUPVSiirt1278a | 176–220 | 11 | 2.90 | 0.21 | 0.66 | 0.63 |
| 155 | CUPVSiirt1322a | 218–237 | 9 | 3.83 | 0.40 | 0.74 | 0.71 |
| 156 | CUPVSiirt1326ab | 186–212 | 17 | 7.26 | 0.55 | 0.86 | 0.85 |
| 157 | CUPVSiirt1330 | 154–201 | 18 | 10.58 | 0.71 | 0.91 | 0.90 |
| 158 | CUPVSiirt1331 | 97–119 | 11 | 4.23 | 0.34 | 0.76 | 0.74 |
| 159 | CUPVSiirt1345 | 156–191 | 7 | 2.46 | 0.38 | 0.59 | 0.55 |
| 160 | CUPVSiirt1353 | 169–197 | 10 | 4.70 | 0.53 | 0.79 | 0.76 |
| 161 | CUPVSiirt1360 | 127–135 | 5 | 3.59 | 0.34 | 0.72 | 0.67 |
| 162 | CUPVSiirt1372ab | 112–194 | 11 | 4.53 | 0.20 | 0.78 | 0.76 |
| 163 | CUPVSiirt1378 | 83–119 | 11 | 4.06 | 0.30 | 0.75 | 0.72 |
| 164 | CUPVSiirt1388a | 177–201 | 6 | 4.67 | 0.43 | 0.79 | 0.75 |
| 165 | CUPVSiirt1394a | 228–270 | 9 | 5.17 | 0.28 | 0.81 | 0.78 |
| 166 | CUPVSiirt1399 | 183–216 | 6 | 1.95 | 0.18 | 0.49 | 0.46 |
| 167 | CUPVSiirt1400ab | 155–197 | 17 | 5.34 | 0.77 | 0.81 | 0.8 |
| 168 | CUPVSiirt1402ab | 172–213 | 9 | 4.36 | 0.45 | 0.77 | 0.74 |
| 169 | CUPVSiirt1405ab | 176–223 | 18 | 8.85 | 0.56 | 0.89 | 0.88 |
| 170 | CUPVSiirt1406 | 172–208 | 13 | 3.81 | 0.23 | 0.74 | 0.72 |
| 171 | CUPVSiirt1413a | 166–202 | 10 | 3.74 | 0.46 | 0.73 | 0.70 |
| 172 | CUPVSiirt1417 | 134–374 | 12 | 4.84 | 0.31 | 0.79 | 0.78 |
| 173 | CUPVSiirt1418a | 114–159 | 16 | 8.24 | 0.37 | 0.88 | 0.87 |
| 174 | CUPVSiirt1431a | 198–215 | 8 | 3.65 | 0.29 | 0.73 | 0.70 |
| 175 | CUPVSiirt1438a | 265–290 | 9 | 4.06 | 0.14 | 0.75 | 0.72 |
| 176 | CUPVSiirt1442a | 110–138 | 12 | 4.12 | 0.27 | 0.76 | 0.74 |
| 177 | CUPVSiirt1457a | 149–199 | 12 | 7.84 | 0.32 | 0.87 | 0.86 |
| 178 | CUPVSiirt1477ab | 109–126 | 12 | 6.27 | 0.57 | 0.84 | 0.83 |
| 179 | CUPVSiirt1478 | 84–119 | 11 | 4.77 | 0.46 | 0.79 | 0.76 |
| 180 | CUPVSiirt1517a | 213–225 | 10 | 5.13 | 0.21 | 0.8 | 0.79 |
| 181 | CUPVSiirt1547a | 120–126 | 2 | 1.38 | 0.18 | 0.28 | 0.24 |
| 182 | CUPVSiirt1564 | 188–222 | 12 | 5.94 | 0.34 | 0.83 | 0.81 |
| 183 | CUPVSiirt1567ab | 181–215 | 15 | 5.69 | 0.52 | 0.82 | 0.81 |
| 184 | CUPVSiirt1599 | 292–345 | 11 | 6.53 | 0.39 | 0.85 | 0.83 |
| 185 | CUPVSiirt1611ab | 193–215 | 8 | 2.68 | 0.16 | 0.63 | 0.6 |
| 186 | CUPVSiirt1626a | 114–153 | 12 | 7.14 | 0.27 | 0.86 | 0.85 |
| 187 | CUPVSiirt1628 | 125–155 | 7 | 2.98 | 0.40 | 0.66 | 0.61 |
| 188 | CUPVSiirt1639a | 167–194 | 7 | 4.60 | 0.39 | 0.78 | 0.75 |
| 189 | CUPVSiirt1640a | 134–180 | 10 | 3.45 | 0.17 | 0.71 | 0.67 |
| 190 | CUPVSiirt1652ab | 159–193 | 13 | 5.30 | 0.61 | 0.81 | 0.79 |
| 191 | CUPVSiirt1655ab | 150–213 | 14 | 5.77 | 0.53 | 0.83 | 0.81 |
| 192 | CUPVSiirt1658a | 130–209 | 13 | 3.89 | 0.44 | 0.74 | 0.72 |
| 193 | CUPVSiirt1667ab | 149–186 | 12 | 4.58 | 0.42 | 0.78 | 0.76 |
| 194 | CUPVSiirt1688 | 160–184 | 11 | 5.74 | 0.63 | 0.83 | 0.80 |
| 195 | CUPVSiirt1705 | 231–251 | 3 | 1.35 | 0.06 | 0.26 | 0.24 |
| 196 | CUPVSiirt1714 | 196–208 | 5 | 2.13 | 0.08 | 0.53 | 0.50 |
| 197 | CUPVSiirt1734 | 168–185 | 5 | 3.24 | 0.50 | 0.69 | 0.65 |
| 198 | CUPVSiirt1740a | 157–192 | 7 | 2.88 | 0.41 | 0.65 | 0.61 |
| 199 | CUPVSiirt1742a | 149–213 | 15 | 7.32 | 0.25 | 0.86 | 0.85 |
| 200 | CUPVSiirt1749ab | 133–164 | 9 | 4.44 | 0.52 | 0.77 | 0.74 |
| 201 | CUPVSiirt1759ab | 137–159 | 11 | 5.79 | 0.62 | 0.83 | 0.81 |
| 202 | CUPVSiirt1764a | 154–178 | 13 | 3.59 | 0.43 | 0.72 | 0.71 |
| 203 | CUPVSiirt1768a | 108–128 | 8 | 3.63 | 0.45 | 0.72 | 0.69 |
| 204 | CUPVSiirt1784a | 177–211 | 9 | 5.46 | 0.43 | 0.82 | 0.79 |
| 205 | CUPVSiirt1788a | 172–189 | 4 | 2.44 | 0.14 | 0.59 | 0.51 |
| 206 | CUPVSiirt1797a | 143–177 | 13 | 4.98 | 0.45 | 0.8 | 0.78 |
| Total | 2036 | - | - | - | - | ||
| Mean | 9.88 | 4.67 | 0.41 | 0.74 | 0.71 |
ahad amplifications in six Pistacia species
bwere polymorphic in six Pistacia species
A total of 2036 alleles were produced by 206 SSR loci in 44 Pistacia cultivars and genotypes, ranging from 2 to 19 per locus. The highest number of alleles was obtained from the CUPVSiirt86 locus. The CUPVSiirt298, CUPVSiirt956, CUPVSiirt1330, and CUPVSiirt1405 loci also produced a high number of alleles (Na = 18). The effective number of alleles ranged from 1.09 (CUPVSiirt18) to 10.58 (CUPVSiirt1330) with an average of Ne = 4.67. The CUPVSiirt465 (Ne = 9.93), CUPVSiirt616 (Ne = 9.88), CUPVSiirt357 (Ne = 9.24), and CUPVSiirt625 (Ne = 9.05) loci also had high effective numbers of alleles. The observed heterozygosity (Ho) ranged from 0.0 to 0.82 with an average of Ho = 0.41. The CUPVSiirt86 locus was the most heterozygous, whereas the CUPVSiirt17 and CUPVSiirt924 loci were homozygous. The average He value was 0.74, which ranged between 0.08 (CUPVSiirt18) and 0.91 (CUPVSiirt1330). The PIC values ranged from 0.08 to 0.90, with an average of 0.71 (Table 2).
Diversity of the SSRs in each of six Pistacia species
In P. vera, all 206 SSR loci generated amplification products, and a total of 897 alleles were produced with an average of 4.5 alleles per locus. Two-hundred (97.1%) SSR loci were polymorphic in 24 pistachio cultivars. The highest number of allele (Na = 11) was obtained from the CUPVSiirt1330 locus. The effective number of alleles ranged from 1.04 to 7.60 (CUPVSiirt616). The average observed heterozygosity (Ho) was 0.46, and the CUPVSiirt86 and CUPVSiirt1273 loci were the most heterozygous. The highest expected heterozygosity (0.87) and PIC (0.85) values were produced from the CUPVSiirt616 locus. The average He and PIC values in P. vera were calculated as 0.55 and 0.50, respectively (Additional file 2).
In P. atlantica, 200 SSR loci generated amplification products with a high rate of transferability (97.1%). Thirty-nine (19.5%) of the amplified SSR loci were monomorphic and the rest were polymorphic (80.5%). A total of 527 alleles were produced by 161 polymorphic SSR loci, with an average of 3.3 alleles per locus. The average observed heterozygosity (Ho) was 0.48. The highest number of alleles (Na = 7), effective number of alleles (Ne = 6.4), expected heterozygosity (0.84), and PIC (0.82) values were produced from the CUPVSiirt349, CUPVSiirt841, and CUPVSiirt1400 loci. The average He and PIC values in P. atlantica were 0.56 and 0.49, respectively (Additional file 3).
In P. integerrima, the transferability of SSR loci was also high, with a rate of 93.7%. Of the amplified SSR loci, 157 (81.3%) were polymorphic in P. integerrima. A total of 416 alleles were produced by 157 SSR loci with an average of 2.70 alleles per locus, and the highest number (Na = 5) of alleles was obtained from the CUPVSiirt131, CUPVSiirt742, CUPVSiirt838, and CUPVSiirt1330 loci. The highest effective number of alleles (4.57) was calculated at the CUPVSiirt742 locus. The average observed (Ho) and expected (He) heterozygosities were 0.50 and 0.52, respectively. The highest values for expected heterozygosity (0.78) and PIC (0.75) were produced from the CUPVSiirt742 locus. The average PIC value in P. integerrima was 0.44 (Additional file 4).
In P. terebinthus, 183 SSR loci (88.8%) generated amplification products and 142 (77.6%) were polymorphic. A total of 416 alleles were produced by 142 polymorphic SSR loci, ranging from 1 to 7 with an average of 3.4 alleles per locus. The effective number of alleles ranged from 1.28 to 6.40. The observed heterozygosity (Ho) ranged from 0.0 to 1.0, with an average of 0.47. The highest number of alleles (Na = 7), effective number of alleles (Ne = 6.4), expected heterozygosity (0.84), and PIC (0.82) were obtained from the CUPVSiirt1017, CUPVSiirt1326, CUPVSiirt1405, and CUPVSiirt1406 loci. The average He and PIC values for P. terebinthus were 0.56 and 0.50, respectively (Additional file 5).
In P. chinensis, 177 (85.9%) loci amplified in SSR-PCR analysis, and 119 loci (67.2%) were polymorphic. A total of 365 alleles were amplified from 119 polymorphic SSR loci with an average of 3.1 alleles per locus. The average observed heterozygosity (Ho) was 0.48. The highest values for He and PIC were 0.84 and 0.82, respectively. The CUPVSiirt836 locus amplified the highest number of alleles and had the highest level of polymorphism. The average values for He and PIC in P. chinensis were 0.54 and 0.48, respectively (Additional file 6).
In P. lentiscus, 151 (73.3%) SSR loci amplified, with the lowest transferability among the five wild Pistacia species studied. Of the amplified SSR loci, 83 (55.0%) were polymorphic. A total of 217 alleles were obtained by 83 polymorphic SSR loci in P. lentiscus, ranging from 1 to 6, with an average of 2.6 alleles per locus. The effective number of alleles ranged from 1.28 to 4.57. The observed heterozygosity (Ho) ranged from 0 to 1 with an average of 0.50. The average values for He and PIC in P. lentiscus were 0.49 and 0.41, respectively. The highest values for Na, Ne, He, and PIC values were obtained from the CUPVSiirt1797 locus (Additional file 7).
Of the 206 SSR loci analyzed in this study, 136 generated amplifications and 41 were polymorphic in all six Pistacia species. Mean values for genetic parameters in each of the Pistacia species are shown in Table 3. The highest transferability was obtained in P. atlantica and P. integerrima, while P. lentiscus had the lowest transferability. In wild Pistacia species, the highest average number of alleles was obtained in P. atlantica and P. terebinthus, while P. lentiscus had the lowest number.
Table 3.
Mean of population genetic parameters of polymorphic SSR loci in each of Pistacia species
| Species | Transferability (%) | Total polymorphic number of alleles | Na | Ne | Ho | He | PIC |
|---|---|---|---|---|---|---|---|
| ALL | 206 (100%) | 2036 | 9.88 | 4.67 | 0.41 | 0.74 | 0.71 |
| P. vera | 206 (100%) | 897 | 4.48 | 2.57 | 0.46 | 0.55 | 0.50 |
| P. atlantica | 200 (97.1%) | 527 | 3.27 | 2.59 | 0.48 | 0.56 | 0.49 |
| P. integerrima | 193 (93.7%) | 416 | 2.64 | 2.21 | 0.50 | 0.52 | 0.44 |
| P. chinensis | 177 (86.0%) | 365 | 3.06 | 2.51 | 0.48 | 0.54 | 0.48 |
| P. terebinthus | 183 (88.9%) | 485 | 3.41 | 2.80 | 0.47 | 0.56 | 0.50 |
| P. lentiscus | 151 (73.3%) | 217 | 2.61 | 2.13 | 0.50 | 0.49 | 0.41 |
Cluster analysis and genetic structure
Cluster analysis was performed for 24 P. vera cultivars and 20 wild Pistacia genotypes using 136 SSR loci that amplified in all tested Pistacia species. UPGMA analysis showed that all Pistacia species and genotypes were clearly separated from each other. Two main clusters were observed: the first cluster contained all individuals from P. vera, whereas the second cluster included wild Pistacia species: P. atlantica, P. integerrima, P. chinensis, P. terebinthus, and P. lentiscus (Fig. 5). P. atlantica was the closest species to P. vera, while P. lentiscus was the most distant.
Fig. 5.

UPGMA dendrogram of 24 P. vera cultivars and 20 genotypes belongs to P. atlantica, P. integerrima, P. terebinthus, P. chinensis and P. lentiscus. The colors refers to population structure when K = 6, which all six Pistacia species were clearly separated
The genetic structure of the Pistacia genotypes used in this study is shown in Fig. 6. A model-based clustering method was performed for all 44 genotypes using 136 SSR loci. The most probable number of clusters was identified by calculating the Delta K (ΔK), which is based on the rate of change in the log probability of data between successive K values (K = 1 to K = 10). The peak of the ΔK graph corresponds to the most probable number of populations in the data set. The highest number of delta K (ΔK) was found at K = 2 (Fig. 7), where all 44 genotypes were divided into two main groups similar to the UPGMA dendrogram (Fig. 5). As the value for K increased to 3, the genotypes in group 2 were divided into two sub-groups: the first subgroup contained P. lentiscus and P. terebinthus and the second subgroup contained the other wild Pistacia species. When K = 4, the wild Pistacia genotypes were divided into three subgroups: the first group included P. lentiscus, the second group contained P. terebinthus, and P. chinensis, and the third group contained P. atlantica and P. integerrima. When K = 5, all Pistacia species were separated from each other, with the exception of P. terebinthus and P. chinensis. When K = 6, all six Pistacia species were clearly separated. When K = 7, the Pistacia species were again divided into six groups, and P. vera cultivars were grouped based on their origins, which was supported by another high ΔK was found at K = 7 (Figs. 5, 6 and 7). The cultivars originated from Iran were in one cluster, and the other cultivars were in the other cluster.
Fig. 6.

Population structure of 24 P. vera cultivars and twenty wild genotypes belong to P. atlantica, P. integerrima, P. terebinthus, P. chinensis and P. lentiscus. K = 2 to K = 10 represent the sub-populations
Fig. 7.

Values of DK. The modal value of this distribution is the true K(*) or the uppermost level of structure, here two (K = 2) clusters with 7 sub-clusters (K = 7)
Discussion
Genome size, heterozygosity, and GC content
The development of NGS technology has provided researchers with an affordable way of addressing a wide range of questions, especially in non-model species such as pistachio. In addition, the K-mer method has been successfully applied for the estimation of genome size using NGS reads without prior knowledge of the genome size [32]. This approach has been used to analyze a number of plant genomes such as in switchgrass (Panicum virgatum L.) [33], Chinese bayberry (Myrica rubra Sieb. et Zucc.) [26], Chinese jujube (Ziziphus jujuba Mill) [34], and Rosa roxburghii Tratt [32]. Here, for the first time, we report a genome survey of P. vera using whole genome shotgun sequencing. The 17-nucleotide depth distribution suggested that the genome size of P. vera is about 600 Mb, which is close to the size (660 Mb) previously estimated for P. terebinthus using flow cytometry [28]. The estimated genome size of pistachio was found to be smaller than that of apple [35], and larger than that of peach [36], sweet orange [37], and poplar [38]. The small size of the pistachio genome may encourage scientists to perform whole genome sequencing in this species. The K-mer analysis also suggested a high level of heterozygosity for P. vera, which is probably due to the dioecious mating system in this genus. Information about the genome structure of pistachio from this study may be useful for whole genome sequencing in these plants.
The average GC content of the P. vera genome was higher than that of wild sweet potato (36.0%) [39], but lower than that of switchgrass (45.5%) [33] and Chinese jujube (48%) [34]. Different GC contents may result in sequencing bias on the Illumina sequencing platform, and can, therefore, seriously affect genome assembly [40, 41]. GC content was one of three factors found to contribute to sequencing bias on the Illumina sequencing platform [42]. High and low GC contents result in reduced coverage in sequencing regions [41].
SSR polymorphisms in Pistacia
From the 59,280 SSRs detected in the genome survey of pistachio in this study, primer design was performed for 950 loci. Initial screening of these loci for polymorphisms and ease of scoring revealed that 206 SSR loci were polymorphic and had good amplifications in genetic diversity analyses of 44 Pistacia genotypes. In P. vera, 200 SSR loci were polymorphic and can be used in further studies investigating genetic linkage mapping, germplasm characterization, fingerprinting, and genetic diversity. Several reports have been published on SSR development in P. vera [11, 19–21]. Those authors reported a total of 137 polymorphic SSR loci in P. vera. Therefore, the number of polymorphic SSR loci developed in the present study was higher than that previously reported for P. vera.
Wild Pistacia species have been used commonly for rootstock seed sources and forest trees. We also tested 206 SSR loci in five wild Pistacia species for their possible use in genetic diversity studies. We report polymorphic SSR loci for each species: 161 for P. atlantica, 157 for P. integerrima, 142 for P. terebinthus, 119 for P. chinensis, and 83 polymorphic for P. lentiscus. Albaladejo et al. [22] only developed eight polymorphic SSR loci for P. lentiscus. Zaloglu et al. [20] and Topcu et al. [11] developed SSRs from P. vera and tested them for PCR amplification in wild Pistacia species. The authors did not analyze the SSR loci for polymorphism. Therefore, this study describes an important number of novel polymorphic SSRs for each of five wild Pistacia species.
The transferability rates of SSRs in this study were high; this is consistent with findings from previous studies performed by Zaloglu et al. [20] and Topcu et al. [11]. Taken together, these data demonstrate that SSRs are very powerful tools for use in synteny analysis in Pistacia. The lowest transferability rate was obtained for P. lentiscus, which is one of the most distant species to P. vera in the genus [1, 2]. The average number of alleles (Na = 4.5) in P. vera was higher in this study, while PIC, observed (Ho), and expected (He) heterozygosities were similar to the values obtained in previous SSR development studies [11, 19–21].
The first genetic linkage map in pistachio was constructed by Türkeli and Kafkas [13] using an F1 interspecific population between P. vera (cv Siirt) and monoecious P. atlantica (Pa-18). The same cultivar and the monoecious genotype were also plant materials of this study. All the 206 SSR loci in this study were polymorphic between Siirt cultivar and monoecious Pa-18 genotype. Türkeli and Kafkas [13] constructed 17 and 19 linkage groups in Siirt and Pa-18, respectively, that were higher than haploid chromosome number of pistachio, n = 15 [43]. Therefore, the polymorphic SSR loci developed in this study may facilitate to construct a reference SSR-based linkage map of pistachio.
Cluster analysis and genetic structure in Pistacia
All the genotypes and all six Pistacia species separated and consistently grouped well in both cluster and structure analysis. The dendrogram and structure analysis at K = 2 divided Pistacia species into two main clusters: the first cluster included all P. vera cultivars, while the second cluster contained the wild genotypes belonging to five Pistacia species. The second cluster divided into two subclusters: the first subcluster contained P. atlantica and P. integerrima species, while the second subcluster contained P. chinensis, P. terebinthus, and P. lentiscus. P. atlantica was the closest species to P. vera, whereas P. lentiscus was the most distant species. Similar results were obtained from other studies undertaking phylogenetic analyses in the genus Pistacia [1, 2, 9]. Kafkas and Perl-Treves [44] divided the genus into two main groups: the first group included species with large, single-trunked trees, whereas the second group included species that mostly grow as shrubs or small trees. P. terebinthus and P. lentiscus were in the same group. These species were also clustered in the same group and were found to be the closest species in this study. A similar result was reported by Kafkas [1] using AFLP markers.
The most comprehensive study on the relationships between P. vera cultivars was performed by Kafkas et al. [14]. Those authors grouped 69 P. vera cultivars into two main groups: the first contained the cultivars originated from Iran and the second included the cultivars from Mediterranean countries such as Turkey, Syria, and Greece. We also observed similar groupings and genetic relationships among 24 pistachio cultivars in this study. Structure analysis at K = 7 also supported the findings of the previous study performed by Kafkas et al. [14], and was confirmed by the UPGMA clustering analysis in this study. Iranian cultivars such as Ohadi and Kallehghouchi were clustered in the Iranian group while the other cultivars were clustered in the Mediterranean group. The Australian cultivar, Sirora was in the Iranian group, and this was supported by structure analysis at K = 7. There were two Kerman clones in the germplasm of the Pistachio Research Institute, which were introduced from Spain and USA. The clone introduced from Spain was clustered in the Iranian group and the other had a close relationship with the Siirt cultivar from Turkey. Further study is necessary to elucidate the real Kerman. The male cultivars Atli, Uygur, Bagyolu, and Kaska were in the separate group within P. vera in the UPGMA dendrogram. The structure analysis demonstrated that these cultivars have a wild origin as they share an important number of alleles with the wild Pistacia species.
Conclusions
We had approximately 40× Illumina data coverage for the genome survey in P. vera to gain knowledge on the structure of the pistachio genome. The assembled data were also used to search for SSRs in the pistachio genome, to develop novel SSR markers, and to study genetic diversity in six Pistacia species. K-mer analysis indicated that the pistachio genome is highly heterozygous and is about 600 Mb in size. The level of repeats in the pistachio genome was not high and the GC content was about 37.1%. The SSR search in the assembled genome revealed 59,280 SSRs with a frequency of 8.67 kb. A total of 206 polymorphic SSR loci were developed from 950 SSR loci: 136 had amplifications and 41 were polymorphic in all six Pistacia species. In conclusion, in this study, we present the first data on the structure of the pistachio genome, which may help to design whole genome sequencing studies in pistachio. Furthermore, we also report novel polymorphic SSR markers for six Pistacia species, which will enable further genetic mapping, genetic diversity, and germplasm characterization studies to be performed in the genus.
Methods
Plant materials and DNA extraction
For the genome survey study, DNA from the P. vera cv. Siirt cultivar was sequenced using an Illumina (Hi-Seq 2000) next generation sequencing platform. Twenty-four P. vera cultivars (Kerman-USA, Kerman-Spain, Peters, Kallehghouchi, Sultani, Kaska, Uzun, Kirmizi, Barak Yildizi, Uygur, Atli, Tekin, Ajamy, Aeginea, Halebi, Ashoury, M3, M7, Silvana, Sirora, Red Aleppo, Siirt, Ohadi, and Bagyolu) were used to test SSR markers for polymorphism and to assess genetic diversity. The origins of the cultivars were as previously described by Kafkas et al. [14]. fresh leaves of 20 wild Pistacia genotypes (four genotypes from each five wild Pistacia species) belonging to P. atlantica, P. integerrima, P. terebinthus, P. chinensis, and P. lentiscus were collected to test transferability of SSR markers across Pistacia species and to analyze genetic diversity within each species.
About 4–5 g fresh leaves were sampled from germplasm collections of Çukurova University in Adana and Pistachio Research Institute in Gaziantep. Genomic DNA was extracted using the CTAB protocol [45] with minor modifications as described by Kafkas et al. [46]. DNA concentrations were measured using a Qubit Fluorimeter (Invitrogen) or were estimated by comparing the band intensity with λ DNA of known concentrations following 0.8% agarose gel electrophoresis and ethidium bromide staining. DNA samples were subsequently diluted to a concentration of 10 ng/μL for SSR-polymerase chain reaction (PCR).
Genome survey and microsatellite identification
For the genome survey study, 26.77 Gb clean data were generated after removing low quality reads from two different libraries: 18.72 Gb data was from a 250-bp library with 150-bp pair-end (PE) reads and 8.05 Gb data was from a 500-bp library with 90-bp PE reads. The library constructions and sequencing were performed at the Beijing Genomic Institute, China. All data were used to perform K-mer analysis. Based on the results of the K-mer analysis, information on peak depth and the number of 17-mers was obtained and used to estimate the size of the genome, repetitive sequences, and heterozygosity. Its relationship was expressed by using the following algorithm: Genome size = K-mer num/Peak depth, where the K-mer_num is the total number of K-mer, and Peak_depth is the expected value of K-mer depth. Assembly was performed using SOAPdenovo v2.01 software [47] and the GC depth distribution was determined by SOAPaligner v2.21 [48].
SSR loci were searched using SSRIT [49] software. The search parameters were set for the detection of di-, tri-, tetra-, penta-, and hexanucleotide SSR motifs with a minimum of 6, 5, 4, 4, and 4 repeats, respectively. The SSR loci were subjected to primer design using Primer 3 web based software [50] with the standard parameters.
Primer selection and PCR conditions
A total of 950 randomly selected primer pairs were synthesized and used for SSR development. PCR and capillary electrophoresis were performed to initially screen SSR primer pairs for polymorphism using two P. vera cultivars (Siirt and Bağyolu) and one monoecious P. atlantica genotype (Pa-18), which are parents in our monoecious cultivar breeding program. Then, 204 SSR primer pairs were selected for further studies based on their polymorphism and ease of scoring.
SSR-PCR was carried out using a three primer strategy according to the method described by Schuelke [51] with some modifications. PCR was performed in a total volume of 12.5 μL containing 20 ng DNA, 75 mM Tris–HCl (pH 8.8), 20 mM (NH4)2SO4, 2.0 mM MgCl2, 0.01% Tween 20, 200 μM each dNTP, 10 nM M13 tailed forward primer at the 5 end, 200 nM reverse primer, 200 nM universal M13 tail primer (5 TGTAAAACGACGGCCAGT-3) labeled with one of FAM, VIC, NED, or PET dyes, and 0.6 U hotstart Taq DNA polymerase.
Amplification was performed in two steps as follows: initial denaturation at 94 °C for 3 min, followed by 10 cycles at 94 °C for 30 s, 58 °C for 45 s, and 72 °C for 60 s. The second step included 30 cycles at 94 °C for 30 s, 58 °C for 45 s and 72 °C for 60 s, and a final extension at 72 °C for 10 min. When the PCR was completed, the reactions were subjected to denaturation for capillary electrophoresis in an ABI 3130xl genetic analyzer [Applied Biosystems Inc., Foster City, Calif. (ABI)] using a 36-cm capillary array with POP7 as the matrix (ABI). Samples were fully denatured by mixing 0.5 μL of the amplified product with 0.2 μL of the size standard and 9.8 μL formamide. The fragments were resolved using ABI data collection software 3.0, and SSR fragment analysis was performed with GeneScan Analysis Software 4.0 (ABI).
SSR markers were prefixed with CUPVSiirt; CU denotes Cukurova University and PVSiirt denotes the Pistacia vera cv. Siirt, from which the SSRs were isolated. Following digits were obtained from the SSR number, x and y were used to identify different SSR loci produced by the same primer pair.
Data analysis
The 204 SSR primer pairs selected in the initial screening were used to evaluate the genetic diversity of 24 P. vera cultivars. The SSR loci were also tested to determine their genetic diversity and transferability to P. atlantica, P. terebinthus, P. integerrima, P. chinensis, and P. lentiscus species. Transferability of the SSR markers was calculated for each Pistacia species by comparing the number of amplified loci with the total number of loci analyzed. Number of alleles (Na), number of effective alleles (Ne), observed (Ho), and expected (He) heterozygosity were calculated using GenAlEx version 6.5 [52]. The polymorphism information contents (PIC) of each locus was calculated using PowerMarker software version 3.25 [53]. A dendrogram was obtained using NTSYSpc v2.21c [54] software by unweighted pair-group method with arithmetic averages (UPGMA).
STRUCTURE 2.3.4 software [55] was also used to determine the number of populations and for construction of the population structure. The burn-in period and Markov chain Monte Carlo (MCMC) were set at 50,000 and 500,000, respectively. The average value of ln likelihood when K changed from 1 to 10 was calculated according to their genetic similarity, and each run was replicated five times to ensure consistency of results.
Acknowledgments
The authors thank The Scientific and Technological Research Council of Turkey (Project No: TUBITAK-TOVAG 113 O 962), Cukurova University Scientific Research Projects Unit (Project No: FUK-2014-2637, FDK-2015-3642 and FBA-2015-4538) for providing financial support. We also thank The Scientific and Technological Research Council of Turkey for providing a PhD scholarship to Elmira Ziya Motalebipour.
Availability of data and materials
Uploaded as Additional file 1.
Author’s contributions
SK coordinated and organized all research activities, and was responsible for the sequencing and assembly; EZM performed SSR-PCR and data analysis, MK, NÇ and HG performed sampling, DNA extractions, and assisted with data analysis. SK and EZM assisted in writing and editing the manuscript. All authors read and approved the final manuscript.
Competing interests
The authors declare they have no competing interests.
Consent for publication
Not applicable.
Ethics approval and consent to participate
Not applicable.
Data deposition
The sequences were deposited into Sequence Read Archive (SRA) database of NCBI (Genbank accession number SRP092115).
Abbreviations
- AFLP
Amplified fragment length polymorphism
- CTAB
Cetyltrimethylammonium bromide
- He
Expected heterozygosity
- Ho
Observed heterozygosity
- ISSR
Inter-simple sequence repeats
- Na
Number of alleles
- Ne
Number of effective alleles
- PIC
Polymorphism information content
- RAPD
Randomly amplified polymorphic DNA
- SAMPL
Selectively amplified microsatellite polymorphic loci
- SNP
Single nucleotide polymorphism
- SRAP
Sequence-related amplified polymorphism
- SSR
Simple sequence repeat
- UPGMA
unweighted pair-group method with arithmetic averages
Additional files
The SSR sequences, accession numbers, forward and reverse primers, repeat motif, repeat type, and product sizes of 204 novel SSR loci developed from Pistacia vera L. ‘Siirt’. (XLSX 37 kb)
Genetic diversity measures in P. vera: allele ranges, number of alleles (Na), number of effective alleles (Ne), observed heterozygosity (Ho), expected heterozygosity (He), and polymorphic information content (PIC) of 200 polymorphic SSR loci. (DOCX 40 kb)
Genetic diversity measures in P. atlantica: allele ranges, number of alleles (Na), number of effective alleles (Ne), observed heterozygosity (Ho), expected heterozygosity (He), and PIC values of 161 polymorphic SSR loci. (DOCX 37 kb)
Genetic diversity measures in P. integerrima: allele ranges, number of alleles (Na), number of effective alleles (Ne), observed heterozygosity (Ho), expected heterozygosity (He), and PIC values of 157 polymorphic SSR loci. (DOCX 37 kb)
Genetic diversity measures in P. chinensis: allele ranges, number of alleles (Na), number of effective alleles (Ne), observed heterozygosity (Ho), expected heterozygosity (He), and PIC values of 142 polymorphic SSR loci. (DOCX 37 kb)
Genetic diversity measures in P. terebinthus: allele ranges, number of alleles (Na), number of effective alleles (Ne), observed heterozygosity (Ho), expected heterozygosity (He), and PIC values of 119 polymorphic SSR loci. (DOCX 38 kb)
Genetic diversity measures in P. lentiscus: allele ranges, number of alleles (Na), number of effective alleles (Ne), observed heterozygosity (Ho), expected heterozygosity (He), and PIC values of 83 polymorphic SSR loci. (DOCX 34 kb)
Contributor Information
Elmira Ziya Motalebipour, Email: elipour83@yahoo.com.
Salih Kafkas, Phone: +90-322-3386030, Email: skafkas@cu.edu.tr.
Mortaza Khodaeiaminjan, Email: mortazakhodaei@yahoo.com.
Nergiz Çoban, Email: nergizaslan@yahoo.com.tr.
Hatice Gözel, Email: gozel27@yahoo.com.
References
- 1.Kafkas S. Phylogenetic analysis of the genus Pistacia by AFLP markers. Plant Syst Evol. 2006a;262(1–2):113–24.
- 2.Parfitt DA, Badenes ML. Phylogeny of the genus Pistacia as determined from analysis of the chloroplast genome. P Natl Acad Sci USA. 1997;94:7987–92. doi: 10.1073/pnas.94.15.7987. [DOI] [PMC free article] [PubMed] [Google Scholar]
- 3.Crane JC. Pistachio tree nuts. Westport: Avipublishing Company; 1978. [Google Scholar]
- 4.Hormaza JI, Dollo L, Polito VS. Determination of relatedness and geographic movements of Pistacia vera (Pistachio; Anacardiaceae) germplasm by RAPD analysis. Econ Bot. 1994;48(4):349–58. doi: 10.1007/BF02862231. [DOI] [Google Scholar]
- 5.Hormaza JI, Pinney K, Polito VS. Genetic diversity of pistachio (Pistacia vera, Anacardiaceae) germplasm based on randomly amplified polymorphic DNA (RAPD) markers. Econ Bot. 1998;52:78–87. doi: 10.1007/BF02861298. [DOI] [Google Scholar]
- 6.Faostat, 2016. FAO web page. (http://www.fao.org/faostat). Accessed 17 May 2016.
- 7.Kafkas S. 2006b. Phylogeny, evolution and biodiversity in the Genus Pistacia (Anacardiaceae). In: Shama AK, Sharma A. Editor. Plant genome: biodiversity and evolution 1.Part C. 2006b;525–57.
- 8.Kafkas S, Kafkas E, Perl-Treves R. Morphological diversity and a germplasm survey of three wild Pistacia species in Turkey. Genet Resour Crop Ev. 2002;49(3):261–70.
- 9.Kafkas S, Perl-Treves R. Morphological and molecular phylogeny of Pistacia species in Turkey. Theor Appl Genet. 2001a;102(6–7):908–15.
- 10.Kafkas S, Cetiner S, Perl-Treves R: Development of sex-associated RAPD markers in wild Pistacia species. J Hortic Sci Biotech. 2001b;76:242–46.
- 11.Topcu H, Nergiz C, Kafka S. Novel microsatellite markers in Pistacia vera L. and their transferability across the genus Pistacia. Sci Hortic. 2016;198:91–97. doi: 10.1016/j.scienta.2015.11.012. [DOI] [Google Scholar]
- 12.Ahmad R, Ferguson L, Southwick SM. Analyses of pistachio rootstocks by SSR and SRAP molecular markers. J Hortic Sci Biotech. 2005;80(3):382–86. doi: 10.1080/14620316.2005.11511948. [DOI] [Google Scholar]
- 13.Turkeli Y, Kafkas S. First genetic linkage map in pistachio constructed using an interspecific cross between Pistacia vera L. and monoecious Pistacia atlantica Desf. Sci Hortic-Amsterdam. 2013;151:30–37. doi: 10.1016/j.scienta.2012.11.024. [DOI] [Google Scholar]
- 14.Kafkas S, Özkan H, Ak BE, Açar I, Atli HS, Koyuncu S: Detecting DNA polymorphism and genetic diversity in a wide pistachio germplasm: comparison of AFLP, ISSR and RAPD Markers. J Am Soc Hortic Sci. 2006a;131(4):522–29.
- 15.Karimi HR, Kafkas S. Genetic relationships among Pistacia species studied by SAMPL markers. Plant Syst Evol. 2011;297:207–12. doi: 10.1007/s00606-011-0508-1. [DOI] [Google Scholar]
- 16.Kafkas S, Khodaeiaminjan M, Güney M, Kafkas E. Identification of sex-linked SNP markers using RAD sequencing suggests ZW/ZZ sex determination in Pistacia vera L. BMC Genomics. 2015;16:1–1. doi: 10.1186/s12864-015-1326-6. [DOI] [PMC free article] [PubMed] [Google Scholar]
- 17.Levinson G, Gutman G. Slipped-strand mispairing: a major mechanism for DNA sequence evolution. Mol Bıol Evol. 1987;4:203–21. doi: 10.1093/oxfordjournals.molbev.a040442. [DOI] [PubMed] [Google Scholar]
- 18.Varshney RK, Graner A, Sorrells ME. Genic microsatellite markers in plants: features and applications. Trends Biotechnol. 2005;23(1):48–55. doi: 10.1016/j.tibtech.2004.11.005. [DOI] [PubMed] [Google Scholar]
- 19.Ahmad R, Ferguson L, Southwick SM. Identification of pistachio (Pistacia vera L.) nuts with microsatellite markers. J Am Soc Hortic Sci. 2003;128(6):898–903. [Google Scholar]
- 20.Zaloglu S, Kafkas S, Dogan Y, Guney M. Development andcharacterization of SSR markers from pistachio (Pistacia vera L.) and theirtransferability to eight Pistacia species. Sci Hortic. 2015;189:94–103. doi: 10.1016/j.scienta.2015.04.006. [DOI] [Google Scholar]
- 21.Kolahi-Zonoozi SH, Mardi M, Zeinalabedini M, Pirseyedi SM, Mahmoodi P, Tabatabaei I, et al. Development of 12 new SSR markers for genetic diversity and structure analysis in pistachio (Pistacia vera L.) J Hortic Sci Biotechnol. 2014;89:707–11. doi: 10.1080/14620316.2014.11513141. [DOI] [Google Scholar]
- 22.Albaladejo RG, Sebastiani F, Aparicio A, Buonamici A, Gonzalez- Martinez SC, Vendramins GG. Development and characterization of eight polymorphic microsatellite loci from Pistacia lentiscus L. (Anacardiaceae) Mol Ecol Resour. 2008;8:904–6. doi: 10.1111/j.1755-0998.2008.02110.x. [DOI] [PubMed] [Google Scholar]
- 23.Arabnezhad H, Bahar M, Pour AT. Evalution of genetic relationship among Iranian pistachios using microsatellite markers developed from Pistacia khinjuk Stocks. Sci Hortic. 2011;128(3):249–54. doi: 10.1016/j.scienta.2011.01.028. [DOI] [Google Scholar]
- 24.Capobianchiet AL, Capobianchi MR, Giombini E, Rozera G. Next-generation sequencing technology in clinical virology. Clin Microbiol Infec. 2013;19(1):15–22. doi: 10.1111/1469-0691.12056. [DOI] [PubMed] [Google Scholar]
- 25.Sonah H, Deshmukh RK, Sharma A, Singh VP, Gupta DK, Gacche RN, et al. Genome-wide distribution and organization of microsatellites in plants: an insight into marker development in Brachypodium. PLoS One. 2011;6(6):e21298. doi: 10.1371/journal.pone.0021298. [DOI] [PMC free article] [PubMed] [Google Scholar]
- 26.Jiao Y, Jia HM, Li XW, Chai ML, Jia HJ, Chen Z, et al. Development of simple sequence repeat (SSR) markers from a genome survey of Chinese bayberry (Myrica rubra) BMC Genomics. 2012;13(1):1. doi: 10.1186/1471-2164-13-201. [DOI] [PMC free article] [PubMed] [Google Scholar]
- 27.Wei X, Wang L, Zhang Y, Qi X, Wang X, Ding X, et al. Development of simple sequence repeat (SSR) markers of sesame (Sesamum indicum) from a genome survey. Molecules. 2014;19:5150–62. doi: 10.3390/molecules19045150. [DOI] [PMC free article] [PubMed] [Google Scholar]
- 28.Horjales M, Redondo N, Blanco A, Rodríguez MA. Cantidades de DNA nuclear en árboles y arbustos. NACC: Nova Acta Científica Compostelana. Bioloxía. 2003;13:23–33. [Google Scholar]
- 29.Emanuelli F, Lorenzi S, Grzeskowiak L, Catalano V, Stefanini M, Troggio M, et al. Genetic diversity and population structure assessed by SSR and SNP markers in a large germplasm collection of grape. BMC Plant Biol. 2013;13(1):39. doi: 10.1186/1471-2229-13-39. [DOI] [PMC free article] [PubMed] [Google Scholar]
- 30.de Jesus ON, e Silva SDO, Amorim EP, Ferreira CF, de Campos JMS, de Gaspari Silva G, et al. Genetic diversity and population structure of Musa accessions in ex situ conservation. BMC Plant Biol. 2013;13(1):41. doi: 10.1186/1471-2229-13-41. [DOI] [PMC free article] [PubMed] [Google Scholar]
- 31.Liu Q, Song Y, Liu L, Zhang M, Sun J, Zhang S, et al. Genetic diversity and population structure of pear (Pyrus spp.) collections revealed by a set of core genome-wide SSR markers. Tree Genet Genomes. 2015;11(6):1–22. doi: 10.1007/s11295-015-0953-z. [DOI] [Google Scholar]
- 32.Lu M, An H, Li L. Genome survey sequencing for the characterization of the genetic background of Rosa Roxburghii Tratt and leaf Ascorbate metabolism genes. PLoS One. 2016;11(2):e0147530. doi: 10.1371/journal.pone.0147530. [DOI] [PMC free article] [PubMed] [Google Scholar]
- 33.Sharma MK, Sharma R, Cao P, Jenkins J, Bartley LE, Qualls M, et al. A genome-wide survey of switchgrass genome structure and organization. PLoS One. 2012;7(4):e33892. doi: 10.1371/journal.pone.0033892. [DOI] [PMC free article] [PubMed] [Google Scholar]
- 34.Xiao J, Zhao J, Liu M, Liu P, Dai L, Zhao Z. Genome-wide characterization of simple sequence repeat (SSR) loci in Chinese jujube and jujube SSR primer transferability. PLoS One. 2015;10(5):e0127812. doi: 10.1371/journal.pone.0127812. [DOI] [PMC free article] [PubMed] [Google Scholar]
- 35.Velasco R, Zharkikh A, Affourtit J, Dhingra A, Cestaro A, Kalyanaraman A, et al. The genome of the domesticated apple (Malus x domestica Borkh.) Nat Genet. 2010;42(10):833–39. doi: 10.1038/ng.654. [DOI] [PubMed] [Google Scholar]
- 36.Verde I, Abbott AG, Scalabrin S, Jung S, Shu S, Marroni F, et al. The high-quality draft genome of peach (Prunus persica) identifies unique patterns of genetic diversity, domestication and genome evolution. Nat Genet. 2013;45(5):487–94. doi: 10.1038/ng.2586. [DOI] [PubMed] [Google Scholar]
- 37.Xu Q, Chen LL, Ruan X, Chen D, Zhu A, Chen C, et al. The draft genome of sweet orange (Citrus sinensis) Nat Genet. 2013;45(1):59–66. doi: 10.1038/ng.2472. [DOI] [PubMed] [Google Scholar]
- 38.Tuskan GA, Difazio S, Jansson S, Bohlmann J, Grigoriev I, Hellsten U, et al. The genome of black cottonwood, Populus trichocarpa (Torr. & Gray) Science. 2006;313(5793):1596–1604. doi: 10.1126/science.1128691. [DOI] [PubMed] [Google Scholar]
- 39.Hirakawa H, Okada Y, Tabuchi H, Shirasawa K, Watanabe A, Tsuruoka H, et al. Survey of genome sequences in a wild sweet potato, Ipomoea trifida (HBK) G. Don. DNA Res. 2015;22(2):171–9. doi: 10.1093/dnares/dsv002. [DOI] [PMC free article] [PubMed] [Google Scholar]
- 40.Aird D, Ross MG, Chen WS, Danielsson M, Fennell T, et al. Analyzing and minimizing PCR amplification bias in Illumina sequencing libraries. Genome Biol. 2011;12:R18. doi: 10.1186/gb-2011-12-2-r18. [DOI] [PMC free article] [PubMed] [Google Scholar]
- 41.Zhou W, Hu Y, Sui Z, Fu F, Wang J, Chang L, et al. Genome survey sequencing and genetic background characterization of Gracilariopsis lemaneiformis (Rhodophyta) Based on next-generation sequencing. PLoS One. 2013;8(7):e69909. doi: 10.1371/journal.pone.0069909. [DOI] [PMC free article] [PubMed] [Google Scholar]
- 42.Cheung MS, Down TA, Latorre I, Ahringer J. Systematic bias in highthroughput sequencing data and its correction by BEADS. Nucleic Acids Res. 2011;39:e103–3. [DOI] [PMC free article] [PubMed]
- 43.Ila HB, Kafkas S, Topaktas M. Chromosome numbers of four Pistacia (Anacardiaceae) species. J Hortic Sci Biotechnol. 2003;78(1):35–38. doi: 10.1080/14620316.2003.11511583. [DOI] [Google Scholar]
- 44.Kafkas S, Perl-Treves R. Interspecific relationships in Pistacia Based on RAPD fingerprinting. Hortic Sci. 2002a;37(1):168–71.
- 45.Doyle JJ, Doyle JL. Isolation of plant DNA from fresh tissue. Quantities of fresh leaf tissue. Phytochem Bull. 1990;19:11–15. [Google Scholar]
- 46.Kafkas S, Kaska N, Wassimi W, Padulosi S. Molecular characterisation of Afghan pistachio accessions by amplified fragment length polymorphisms (AFLPs) J Hortic Sci Biotechnol. 2006;81(5):864–68. doi: 10.1080/14620316.2006.11512151. [DOI] [Google Scholar]
- 47.Luo R, Liu B, Xie Y, Li Z, Huang W, Yuan J, et al. SOAPdenovo2: an empirically improved memory-efficient short-read de novo assembler. Giga Sci. 2012;1(1):1–6. doi: 10.1186/2047-217X-1-18. [DOI] [PMC free article] [PubMed] [Google Scholar]
- 48.Li R, Yu C, Li Y, Lam TW, Yiu SM, Kristiansen K, Wang J. SOAP2: an improved ultrafast tool for short read alignment. Bioinformatics. 2009;25(15):1966–67. doi: 10.1093/bioinformatics/btp336. [DOI] [PubMed] [Google Scholar]
- 49.Temnykh S, DeClerck G, Lukashova A, Lipovich L, Cartinhour S, McCouch S. Computational and experimental analysis of microsatellites in rice (Oryza sativa L.): Frequency, length variation, transposon associations, and genetic marker potential. Genome Res. 2001;11:1441–52. doi: 10.1101/gr.184001. [DOI] [PMC free article] [PubMed] [Google Scholar]
- 50.Rozen S, Skaletsky H. Primer3 on the WWW for general users and for biologist programmers. Bioinformatics Methods Protoc. 1999;132:365–86. [DOI] [PubMed]
- 51.Scheulke M. An economic method for the fluorescent labeling of PCR fragments. Nat Biotech. 2000;18:233–4. doi: 10.1038/72708. [DOI] [PubMed] [Google Scholar]
- 52.Peakall PE, Smouse R. GenAlEx 6.5: genetic analysis in Excel. Population genetic software for teaching and research—an update. Bioinformatics. 2012;28:2537–39. doi: 10.1093/bioinformatics/bts460. [DOI] [PMC free article] [PubMed] [Google Scholar]
- 53.Liu K, Muse SV. PowerMarker: Integrated analysis environment for genetic marker data. Bioinformatics. 2005;21:2128–29. doi: 10.1093/bioinformatics/bti282. [DOI] [PubMed] [Google Scholar]
- 54.Rohlf FJ. NTSYSpc: Numerical Taxonomy System, ver.2.21c. Setauket: Exeter Publishing; 2009. [Google Scholar]
- 55.Pritchard JK, Stephens M, Donnelly P. Inference of population structure using multilocus genotype data. Genetics. 2000;155(2):945–59. [DOI] [PMC free article] [PubMed]
Associated Data
This section collects any data citations, data availability statements, or supplementary materials included in this article.
Data Availability Statement
Uploaded as Additional file 1.