Day 0 controls (mice with no surgical operation) can be a good substitute for sham surgeries in myocardial infarction studies, particularly for time course analyses that evaluate multiple time points.
Keywords: ischemia, permanent occlusion, LV remodeling, proteomics, animal use reduction, animal use refinement, inflammation, scar
Abstract
The purpose of this study was to evaluate the effect of sham surgery in a minimally invasive surgical model of permanent coronary artery occlusion used to generate myocardial infarction (MI) in mice. Adult male C57BL/6J mice (3–6 mo old) were divided into five groups: day (D) 0 (no surgical operation), D1 Sham, D1 MI, D7 Sham, and D7 MI. A refined MI surgery technique was used to approach the coronary artery without the ribs being cut. Both sham and MI mice had the left ventricle (LV) exposed through a small incision. To test the effects of surgery alone, the suture was passed around the coronary artery but not ligated. The MI mice were subjected to permanent coronary artery ligation. The mice were killed at D1 or D7 postsurgical procedure. Compared with D0 no surgery controls, the D1 and D7 sham groups exhibited no surgical mortality and similar necropsy and echocardiographic variables. Surgery alone did not induce an inflammatory cell response, as evidenced by the lack of leukocyte infiltration in the sham groups. Analysis of 165 inflammatory cytokines and extracellular matrix factors in sham revealed that a minor gene response was initiated but not translated to protein levels. Collagen deposition did not occur in the absence of MI. In contrast, the D1 and D7 MI groups showed the expected robust inflammatory and scar formation responses. When a minimally invasive procedure to generate MI in mice was used, the D0 (no surgical operation) control was an adequate replacement for the use of sham surgery groups.
NEW & NOTEWORTHY
Day 0 controls (mice with no surgical operation) can be a good substitute for sham surgeries in myocardial infarction studies, particularly for time course analyses that evaluate multiple time points.
the experimental mouse myocardial infarction (MI) model is generated by ligating the left anterior descending coronary artery using either permanent occlusion or ischemia/reperfusion approaches (14). Michael et al. (11) previously reported that sham surgeries result in significantly high variability in background inflammation. This led to the development of a closed-chest model by Nossuli et al. (13) that provided 3–7 days of healing between surgery and MI induction. In both acute and chronic instrumentation models, a partial thoracotomy was used with three ribs being dissected at their insertion to the sternum. When this method is performed by experienced hands, it is possible that minimal damage is induced to the left internal mammary artery and no cauterization is needed. However, in suboptimal cases bleeding may occur and cauterization may be required, which can induce a strong inflammatory response. We refined the technique by approaching the coronary artery from between the ribs, such that the ribs are not cut and there is little to no bleeding (16). Evaluation and assessment of the sham effect in the minimally invasive procedure have not been analyzed.
The Institute for Laboratory Animal Research (ILAR) Guide for the Care and Use of Laboratory Animals (8th ed., 2011, National Research Council) suggests a practical plan when considering experimental design in laboratory animal research (12, 15). This plan follows the three R's (replacement, refinement, and reduction of subject numbers) proposed by Russel and Burch (13a). Replacement of the study system includes absolute replacement (i.e., replacing animals with an inanimate system) or relative replacement (i.e., using less sentient species). Refinement refers to modifications of experimental procedures to enhance animal well-being and minimize or eliminate pain and distress. Reduction refers to the use of fewer animals while maximizing the information obtained from a given number of animals. Our laboratory frequently assesses MI time course responses in our studies, and the need for sham mice for each time point substantially increases animal usage. Assessing whether the day 0 (D0; mice with no surgical operation) control could be an appropriate substitute to sham groups would provide a means to reduce animal usage by eliminating the need for surgically manipulated sham groups. This is particularly important for time course studies where sham surgeries are needed for each time point of evaluation. In the present study, the left ventricles (LVs) from sham-operated animals at D1 or D7 postsurgery were compared with D0 LV used as a negative control, while D1 and D7 post-MI groups were used as time-respective positive controls.
MATERIALS AND METHODS
Mice.
All animal procedures performed conformed with the Guide for the Care and Use of Laboratory Animals and were approved by the Institutional Animal Care and Use Committee at the University of Mississippi Medical Center. The mouse colony was maintained in the University of Mississippi Medical Center American Association for Laboratory Animal Care-accredited vivarium. The C57BL/6J WT male mice used were 3–6 mo old, an age range that is homogeneous in physiological maturation (2). Mice were randomly divided into one of five groups: day (D)0 mice with no surgical operation, D1 sham, D1 MI, D7 sham, or D7 MI (5). All mice were kept in the same room in a light-controlled environment with a 12:12-h light-dark cycle and with free access to standard mouse chow and water. The detailed description of the surgical procedure has been published by our group in a book chapter and is summarized here (5).
Presurgical preparation and intubation procedure.
Electrocardiogram, heart rate, and body temperature were continuously monitored throughout the surgery. All MI mice were subjected to permanent occlusion of the left anterior descending coronary artery (LAD). Mice were placed in a supine position and anesthetized with 0.5–2.0% isoflurane during echocardiographic imaging and during surgery. Before echocardiographic imaging and surgery, the neck and thorax were sanitized with a gauze containing 70% EtOH followed by a gauze containing Betadine. Sham and MI mice were given buprenorphine by injection (0.05–0.1 mg/kg sc or ip) before surgery to alleviate postoperative stress and pain. A longitudinal incision of 1 cm was made on the ventral midline of the neck, which exposed the submandibular glands. Blunt dissection was used to expose the sternothyroid muscles. The sternothyroid muscles were retracted laterally to expose the ventral aspect of the trachea to facilitate intubation of the mouse.
Coronary artery ligation.
1) A 1.0- to 1.5-cm transverse incision was made at the mid-thorax, starting left of the ventral midline and extending laterally, parallel to the ribs and ∼2 cm below the left axilla.
2) The left pectoralis major muscles were exposed by blunt dissection and two 3-0 retention sutures were used to retract muscles and expose the rib cage.
3) The muscle striations at the intercostal space between the thrid and fourth ribs were bluntly dissected to make a 0.25-cm incision that penetrated into the thoracic cavity.
4) A strip of gauze was placed into the thoracic incision and gently pushed down towards the lungs to avoid damage. The thoracic incision was enlarged to ∼1 cm long by blunt dissection.
5) A Mini-Goldstein retractor was placed in the incision to gently spread the ribs and clearly visualize the left atrium and left ventricle.
6) The pericardium was gently removed using fine forceps to provide access to the left ventricular free wall.
7) The LAD was identified. With the use of a Castroviejo needle holder, an 8-0 suture was used to ligate the LAD at 1 mm distal to the left atrium. MI was confirmed by visual blanching downstream of the occlusion site and by ST segment elevation by electrocardiogram at the time of occlusion and by echocardiography at 3 h post-MI. For sham mice, the suture was passed around the coronary artery and immediately removed without ligation.
8) The retractor and gauze were removed and a 6-0 suture was used to reposition the separated ribs. The retracted muscle layers of the chest were repositioned. The thoracic and neck incisions were also closed using 6-0 sutures. Isoflurane was turned off under continuous oxygen flow. The mouse was moved to the prone position and extubated. After extubation, spontaneous breathing began immediately and the animal was placed in a 37°C incubator to recover. After the recovery period, the mice were returned to their cage.
9) The mice were checked daily, and autopsies were performed for any mouse found dead. Surviving mice were killed at D1 or D7 after surgery (n = 12 surviving mice/time point/group). D0 mice (n = 12) served as no surgical operation controls.
Echocardiography.
Transthoracic echocardiography was performed using a Vevo 2100 system (VisualSonics, Toronto, ON, Canada) with a 30-MHz image transducer under 0.5–2.0% isoflurane (5). Electrocardiogram, heart rate, and body temperature were continuously monitored during the imaging procedure. Images were collected at the time of surgery (time 0) and at death. Measurements were taken from the LV parasternal long axis (B-mode) and short axis (M-mode) views. For each echocardiographic parameter, three images were measured and averaged. All images were acquired at heart rates >400 beats/min for physiologically relevant measurements.
Tissue harvest and infarct area evaluation.
Mice were anesthetized with 5% isoflurane in an oxygen mix, and heparin was administered (4 U/g body wt ip; 1,000 USP units/ml) 5 min before death. Blood was collected from the carotid artery and centrifuged (6600 rpm, 5 min) for plasma collection. Plasma was aliquoted, stored in 1× proteinase inhibitor cocktail (Roche, Indianpolis, IN), and immediately frozen at −80°C until use. The hearts were flushed with cardioplegic solution (69 mM NaCl, 12 mm NaHCO3, 11 mM glucose, 30 mM 2,3-butanedione monoxime, 10 mM EGTA, 0.001 mM nifedipine, and 50 mM KCl) to arrest the heart in diastole. The hearts were excised, and the LV and right ventricle were separated and weighed individually. The LV was sliced into apex, middle, and base sections. For the apex and base sections, the LV infarct region (LVI) was separated from the non-infarcted remote region (LVC). The LVI of MI groups and the respective free wall region in the D0 and sham group were used for real time RT2-PCR analysis (n = 6/group) or immunoblotting analysis (n = 6/group). The LVC of the MI groups and the respective septal wall region in the D0 and sham group were used for real time RT2-PCR analysis (n = 6/ group).The LV middle section taken at the mid-papillary level was fixed in 10% zinc formalin (Fisher Scientific), paraffin embedded, and sectioned for histological examination (n = 12/ group). Lung weights and tibia lengths were recorded.
Immunohistochemistry.
The middle section of the LV was sectioned at 5 μm for routine hematoxylin and eosin staining or for immunohistochemical staining (5). Heat-mediated antigen retrieval (Target retrieval solution; Dako North America, Carpinteria, CA) was performed to expose antigen epitopes. Sections were incubated with rabbit blocking serum using the Vectastain elite ABC Kit (Vector Laboratories, Burlingame, CA). The sections were incubated with primary antibodies specific for neutrophils (anti-neutrophil mouse monoclonal, Cedarlane CL8993AP; 1:100) or macrophages (Mac-3 mouse monoclonal, Cedarlane CL8943AP; 1:100) at 4°C overnight. The sections were then incubated with respective secondary antibodies. Positive staining was visualized using HistoMark Black (KPL 54-75-00) with eosin as a counterstain. Picrosirius red staining was used to examine collagen density. Images were captured at ×40 magnification with Image-Pro software (Media Cybernetics, Bethesda, MD).
Real time RT2-PCR.
RNA was extracted from the infarct and remote regions of the MI groups and in the respective wall regions of the D0 or sham groups using TRIzol Reagent (Invitrogen Life Technologies, Grand Island, NY) according to manufacturer instructions.(6) RNA concentrations were quantified using the NanoDrop ND-2000 Spectrophotometer (Thermo Scientific, Waltham, MA). RNA reverse transcription was performed using the RT2 First Strand Kit (0.4 μg; Qiagen, Valencia, CA). Real-time RT2-PCR gene array for inflammatory cytokines and receptors or for extracellular matrix (ECM) and adhesion molecules (Qiagen, Valencia, CA) were performed to quantify gene expression. Gene levels were normalized to the reference gene hypoxanthine guanine phosphoribosyl transferase 1 (Hprt1). The experiments were performed according to the MIQE guidelines with one exception. Hprt1, was the only reference gene of the five in the panel that showed no change in expression after MI (GusB, Hsp90ab1, Actb, and Gapdh reference genes significantly change post-MI) (7). Ctnna1, Ctnnb1, Cxcl12, IL-15, Lama2, Lama3, Mmp3, Pecam1, Tollip, and Vcam1 gene expression levels were also assessed using specific primers (Ctnna1, Mm01158259_m1; Ctnnb1, Mm00483039_m1; Cxcl12, Mm00445553_m1, IL-15, Mm00434210_m1, Lama2, Mm00550083_m1, Lama3, Mm012554735_m1, Mmp3, Mm00440295_m1, Pecam1, Mm01242576_m1, Tollip, Mm00445841_m1, and Vcam1, Mm01320970_m1). Gene levels were normalized to Hprt1 and expressed as 2−ΔCt values ± SE. Heatmaps were constructed using the Metaboanalyst 3.0 software program (www.metaboanalyst.ca/).
Protein extraction and analysis.
LV tissue was homogenized in 1× phosphate buffered saline with 1× proteinase inhibitor cocktail (16 μl/mg wet LV) using the Power Gen 1000 Homogenizer (Fisher Scientific). The homogenate was centrifuged at 4,700 rpm for 15 min. The supernatant (soluble protein fraction) was removed and stored at −80°C. The remaining pellet (insoluble protein fraction) was homogenized in Protein Extraction Reagent 4 (Sigma) with 1× protease inhibitor and stored at −80°C. Protein concentrations were quantified by Bradford assay (Bio-Rad, Hercules, CA). Total protein (10 μg) was run on 4–12% criterion Bis-Tris gels (Bio-Rad), transferred onto nitrocellulose membranes (Bio-Rad), and stained with MemCod Reversible Protein Stain Kit (Thermo Scientific), which was quantified to control for loading accuracy. For immunoblotting, membranes were blocked with 5% nonfat milk (Bio-Rad) and incubated overnight at 4°C with primary antibodies against chemokine receptor 9 (Ccr9, Abcam ab38567, 1:500), cadherin 2 (Cdh2, Thermofisher MA1-2001, 1:1,000), cluster of differentiation 44 (CD44, Abcam ab119863, 1:1,000), collagen type I alpha I (Col1a1, Cedarlane 558,739, 1:2,000), collagen type IV alpha III (Col4a3, Cedarlane CL50441AP, 1:1,000), catenin beta 1 (Ctnnb1, Abcam ab32572, 1:5,000), chemokine ligand 12 (Cxcl12, Abcam ab25117, 1:750), fibronectin (Fn1, Millipore AB1954, 1:10,000), laminin alpha 2 (Lama2, Santacruz sc59854, 1:50), laminin alpha 3 (Lama3, Santa Cruz Biotechnology sc-20143, 1:1,000), macrophage migration inhibitory factor (Mif, Abcam ab7207, 1:2,000), macrophage metalloproteinases-2 (MMP-2, Cell Signaling 13,132, 1:1,000), MMP-3 (Cell Signaling MAB548, 1:500), MMP-8 (Abcam ab81286, 1:1,000), MMP-9 (Abcam ab38898, 1:1,000), platelet endothelial cell adhesion molecul (Pecam 1, Cell signaling 77699,1:1,000), secreted phosphoprotein 1 (Spp1, Abcam ab8448, 1:1,000), transforming growth factor 1 (Tgfb1, Abcam ab64715, 1:500), tissue inhibitor of metalloproteinase 1 (Timp1, Abcam ab38978, 1:2,000), tumor necrosis factor receptor superfamily, member 1A (Tnfrsf1a, Abcam ab112535, 1:500), Toll interacting protein (Tollip, Abcam ab37155, 1:500), or vascular cell adhesion molecule 1 (Vcam1, Abcam ab134047, 1:2,000), followed by incubation at room temperature with the appropriate secondary antibody. Cdh2, Cd44, Col1a1, Col4a3, Ctnnb1, Fn1, Lama2, Lama3, Mif, MMP-2, MMP-3, MMP-8, MMP-9, Pecam1, Spp1, Tgfb1, Timp1, Tnfrsf1a, Tollip, and Vcam1 proteins were expressed in the soluble fraction; Ccr9 and Cxcl12 proteins were expressed in the insoluble fraction. Following immunoblotting for Spp1, Ctnnb1, Tgfb1, or Timp1, the nitrocellulose membranes were stripped of bound antibodies using stripping solution (0.2 M glycine and 0.5 M NaCl at pH 2.8) and reprobed with a new antibodies for Cdh2, Col1a1, Fn1, or Mif, respectively. Amersham ECL Substrate (GE Healthcare, Waukesha, WI) was used for signal detection, and the blots were imaged using the Image Quant LAS4000 luminescent imager (GE Healthcare). Densitometry was quantified using the IQ-TL image analysis software (GE Healthcare). Densitometric units were normalized to the densitometry of the total membrane protein stain for the entire lane.
Measurement of cytokines in the plasma was determined by fluorescent bead-based Luminex technology (Bio-Rad; Bio-plex Pro Mouse Cytokine 23-plex panel MD0-009RDPD and 9-plex panel MD0-00000EL), in accordance with manufacturer instructions. Briefly, plasma samples (30 μl) were diluted 1:4 in sample diluent and incubated for 30 min in a 96-well plate. Detection antibodies were added, and the plate was incubated for 30 min with shaking. After incubation, Streptavidin was added to each well, and the plate was incubated for 10 min. Samples were resuspended in assay buffer, and the plate was measured for fluorescence emission on the Bio-plex system. Concentrations were calculated from standard curves generated for each analyte.
Statistical analyses.
Data are presented as means ± SE. Survival rates were analyzed by Kaplan-Meier survival analysis and compared by log-rank test. Multiple group comparisons were analyzed using one-way ANOVA, followed by the Student-Newman-Keuls post hoc test when the Bartlett's variation test passed, or using the nonparametric Kruskal-Wallis test, followed by Dunn post hoc test when the Bartlett's variation test did not pass. Two group comparison was analyzed using Student's t-test. Statistical significance was set at P < 0.05.
RESULTS
Sham surgery did not affect mortality, necropsy, or physiology variables.
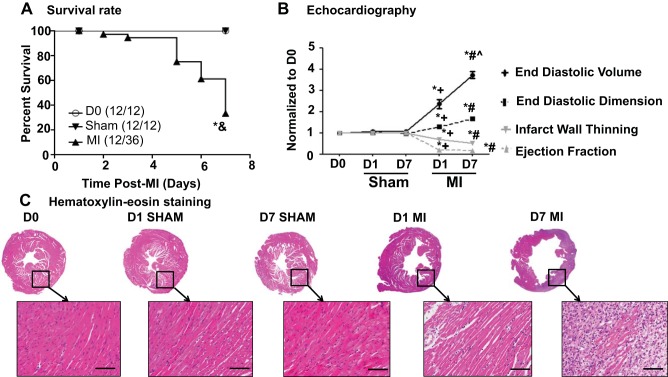
All of the D0 and D7 sham mice survived, while 12 out of 36 MI mice survived to 7 days after MI (Fig. 1A) (5). A 7-day MI mortality rate of 66% is at the upper limit of what we typically see for groups with large infarcts (1, 3, 9). In this study, the infarct area was 57 ± 2% for the D7 MI group (5). As shown in Fig. 1B and Table 1, sham surgery did not affect any echocardiography variable measured compared with the D0 group, while both D1 and D7 post-MI groups displayed the expected increases in systolic and diastolic dimensions and volumes and decreases in fractional shortening and ejection fraction. Sham surgery did not produce any evidence of ischemia, while the MI groups showed obvious infarction as shown by hematoxylin and eosin stained images (Fig. 1C). Sham surgery did not alter any of the necropsy variables measured, while LV mass and lung weights were elevated in the MI groups (Table 1). These results indicate that the sham operation did not affect survival, induce ischemia, or impair LV structure and function.
Fig. 1.
Sham surgery did not affect survival rate and physiological variables post-surgery. A: survival rates were identical (100%) between day (D) 0 and sham groups. B: end diastolic volume, end diastolic dimension, ejection fraction, and infarct wall thinning were similar between D0 and sham groups. The positive control myocardial infarction (MI) groups showed significant dilation and reduction in left ventricular function, compared with both D0 and sham groups. C: there was no evidence of ischemia in the sham surgery groups, while the MI groups showed obvious infarction. Hematoxylin and eosin images were captured at ×1.25 magnification and ×40 magnification (inset). Scale bar = 200 μm. Samples sizes are n = 12/group. *P < 0.05 vs. D0; &P < 0.05 vs. sham; +P < 0.05 vs. D1 sham; #P < 0.05 vs. D7 sham; ^P < 0.05 vs. D1 MI.
Table 1.
Sham surgery did not alter necropsy or physiological values
| D0 | D1 Sham | D7 Sham | D1 MI | D7 MI | |
|---|---|---|---|---|---|
| Necropsy | |||||
| Body weight, g | 30 ± 1 | 28 ± 1 | 29 ± 1 | 29 ± 1 | 28 ± 1 |
| LV mass/body weight, mg/g | 3.2 ± 0.1 | 3.5 ± 0.2 | 3.3 ± 0.2 | 3.3 ± 0.1 | 4.4 ± 0.3*‡§ |
| Wet lung weight, mg | 163 ± 8 | 174 ± 25 | 169 ± 11 | 209 ± 13 | 263 ± 25*‡§ |
| Edema index, mg/mm | 9.6 ± 0.7 | 10.0 ± 1.6 | 10.0 ± 0.0 | 10.6 ± 0.6 | 13.3 ± 1.4* |
| Echocardiography | |||||
| Heart rate | 489 ± 14 | 493 ± 13 | 473 ± 11 | 459 ± 9.6 | 502 ± 17 |
| End systolic volume, μl | 14 ± 1 | 15 ± 1 | 14 ± 1 | 89 ± 7*† | 148 ± 7*‡§ |
| End systolic dimension, mm | 2.3 ± 0.1 | 2.4 ± 0.1 | 2.2 ± 0.1 | 4.7 ± 0.1*† | 6.1 ± 0.1*‡ |
| Fractional shortening, % | 38 ± 1 | 38 ± 1 | 39 ± 1 | 4 ± 1*† | 3 ± 1*‡ |
Values are presented as mean ± SE; n = 12/group. Edema index = (wet lung weight − dry lung weight)/wet lung weight.
D, day; LV, left ventricle; MI, myocardial infarction.
P < 0.05 vs. D0;
P < 0.05 vs. D1 sham;
P < 0.05 vs. D7 sham;
P < 0.05 vs. D1 MI.
Sham surgery did not induce leukocyte infiltration.
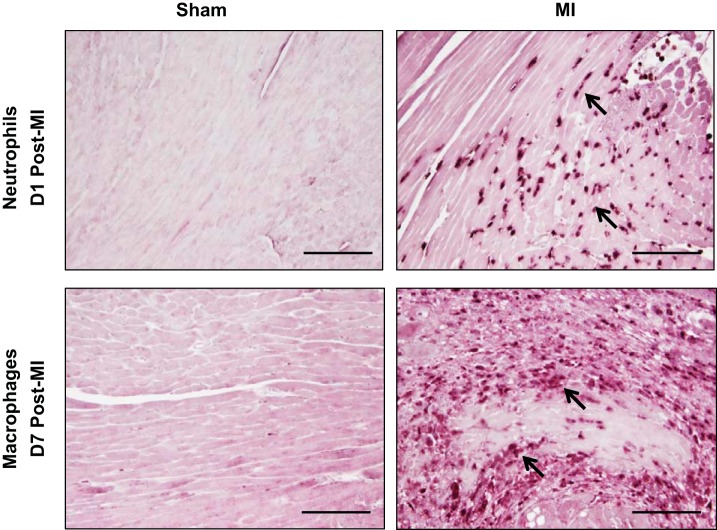
Neutrophils are the first inflammatory cells recruited to the infarct area, with influx occurring within hours post-MI (10). Macrophages infiltration follows, peaking between D5 and D7 post-MI (6). Unlike the MI groups, the sham groups showed no evidence of robust neutrophil or macrophage infiltration (Fig. 2).
Fig. 2.
Sham surgery did not affect leukocyte infiltration. There was no evidence of neutrophil infiltration in the D1 sham (top) or macrophage infiltration in the D7 sham (bottom), compared with respective MI groups. Arrows depict positive staining. Scale bar = 200 μm. Samples sizes are n = 12/group.
Sham surgery resulted in only modest changes in inflammatory cytokine gene expression without concomitant increases in protein expression.
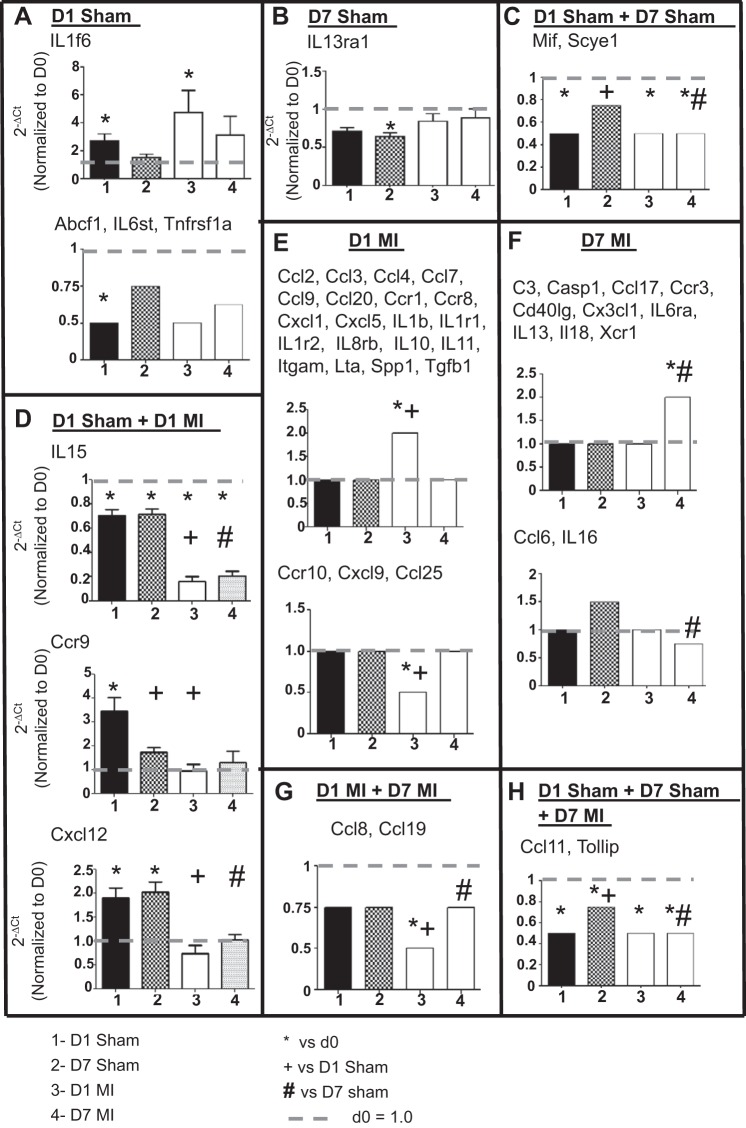
To assess whether sham surgery initiated an inflammatory response, we measured gene levels of 84 inflammatory cytokines and chemokines in the infarct region of the MI groups and the respective free wall region of the D0 and sham groups. There were 49 genes different among the 5 groups (all P < 0.05), with the majority of changes being due to the induction of MI. Only 1 gene (IL1f6) was increased in D1 sham; 3 genes (Abcf1, IL6st, and Tnfrsf1a) were decreased in D1 sham; 1 gene (IL13ra1) decreased in D7 sham; and 2 genes (Mif and Scye1) were increased in both D1 and D7 sham indicating changes due to the surgical procedure (Fig. 3 and Table 2; P < 0.05). IL-15, Ccr9, and Cxcl12 showed both surgery- and MI-dependent effects at D1, whereas two genes (Ccl11 and Tollip) showed significant changes at D1 and D7 sham as well as D7 MI. Studies in mice involving the evaluation of these 12 genes (Abcf1, Ccr9, Ccl11, Cxcl12, IL1f6, IL6st, IL13ra1, IL-15, Mif, Scye1, Tnfrsf1a, and Tollip) should take this result into consideration. The remaining 37 genes showed significant differences only in D1 MI, D7 MI, or both MI groups, indicating changes due to MI and not the surgical procedure itself.
Fig. 3.
Sham surgery caused only modest changes in inflammatory cytokine gene expression. A–H: graphs depicting 8 different patterns of change in inflammatory and cytokine gene expression in the sham and MI groups compared with D0 controls. For the patterns with only 1 gene, actual normalized values are shown. For patterns with ≥2 genes, arbitrary values were set at 2.0 or 1.5 for upregulation, 1.0 for no change, and 0.75 or 0.5 for downregulation to graphically represent the changes across the 4 groups. The x-axis labels are as follows: 1 = D1 sham, 2 = D7 sham, 3 = D1 MI, and 4 = D7 MI. Sample sizes are n = 6/group. *P < 0.05 vs. D0; +P < 0.05 vs. D1 sham.; #P < 0.05 vs. D7 sham.
Table 2.
Inflammatory gene expression changes among D0, sham, and MI groups
| Gene | Pro- or Anti- | D1 Sham vs. D0 | D7 Sham vs. D0 | D1 MI vs. D0 | D7 MI vs. D0 | D7 Sham vs. D1 Sham | D1 MI vs. D1 Sham | D7 MI vs. D7 Sham | D7 MI vs. D1 MI |
|---|---|---|---|---|---|---|---|---|---|
| Abcf1 | Pro | ↓ | ↓ | ↓ | ↓ | ||||
| C3 | Pro | ↑ | |||||||
| Casp1 | Pro | ↑ | |||||||
| Ccl2 | Pro | ↑ | ↓ | ||||||
| Ccl3 | Pro | ↑ | ↑ | ||||||
| Ccl4 | Pro | ↑ | ↑ | ||||||
| Ccl6 | Anti | ↓ | |||||||
| Ccl7 | Pro | ↑ | |||||||
| Ccl8 | Pro | ↓ | ↑ | ||||||
| Ccl9 | Pro | ↑ | ↑ | ||||||
| Ccl11 | Pro | ↓ | ↓ | ↓ | ↓ | ↑ | ↓ | ||
| Ccl17 | Anti | ↑ | |||||||
| Ccl19 | Pro | ↓ | ↓ | ↑ | |||||
| Ccl20 | Pro | ↑ | |||||||
| Ccl25 | Pro | ↓ | |||||||
| Ccr1 | Pro | ↑ | ↑ | ||||||
| Ccr3 | Pro | ↑ | |||||||
| Ccr8 | Pro | ↑ | |||||||
| Ccr9 | Pro | ↑ | ↓ | ↓ | |||||
| Ccr10 | Pro | ↓ | ↓ | ||||||
| Cd40lg | Pro | ↑ | |||||||
| Cx3cl1 | Pro | ↑ | |||||||
| Cxcl1 | Pro | ↑ | ↓ | ||||||
| Cxcl5 | Anti | ↑ | |||||||
| Cxcl9 | Pro | ↓ | ↓ | ||||||
| Cxcl12 | Anti | ↑ | ↑ | ↓ | ↑ | ||||
| IL1b | Pro | ↑ | |||||||
| IL1f6 | Pro | ↑ | ↑ | ||||||
| IL1r1 | Pro | ↑ | ↑ | ↑ | |||||
| IL1r2 | Pro | ↑ | ↑ | ||||||
| IL6ra | Pro | ↑ | |||||||
| IL6 st | Pro | ↓ | ↓ | ||||||
| IL8rb | Pro | ↑ | ↓ | ||||||
| IL10 | Anti | ↑ | |||||||
| IL11 | Anti | ↑ | |||||||
| IL13 | Pro | ↑ | |||||||
| IL13ra1 | Pro | ↓ | |||||||
| IL15 | Pro | ↓ | ↓ | ↓ | ↓ | ↓ | ↓ | ||
| IL16 | Pro | ↓ | |||||||
| IL18 | Pro | ↑ | |||||||
| Itgam | Pro | ↑ | ↑ | ||||||
| Lta | Pro | ↑ | |||||||
| Mif | Pro | ↓ | ↓ | ↓ | ↑ | ||||
| Scye1 | Pro | ↓ | ↓ | ↓ | ↓ | ↑ | ↓ | ||
| Spp1 | Pro | ↑ | ↑ | ||||||
| Tgfb1 | Anti | ↑ | ↑ | ||||||
| Tnfrsf1a | Pro | ↓ | |||||||
| Tollip | Anti | ↓ | ↓ | ↓ | ↓ | ↑ | ↓ | ||
| Xcr1 | Pro | ↑ | ↑ |
Arrows depict direction of change; n = 6/group. The increase, decrease, and no change were based on quantitative measurements that were statistically different based on RT2-PCR analysis. Qualitative directions for change in gene expression are shown (all P < 0.05). Blank boxes = no significant difference.
MI, myocardial infarction; anti, anti-inflammatory genes; pro, proinflammatory genes. Genes Bcl6, Ccl1, Ccl5, Ccl12, Ccl22, Ccl24, Ccr2, Ccr4, Ccr5, Ccr6, Ccr7, Crp, Cxcl10, Cxcl11, Cxcl13, Cxcl15, Cxcr3, Cxcr5, Ifng, IL1a, IL1f8, IL2rb, IL2rg, IL3, IL4, IL5ra, IL10ra, IL10rb, IL17b, IL20, Itgb2, Ltb, Pf4, Tnf, and Tnfrsf1b showed no significant differences among any of the groups. Gene names in alphabetical order: Abcf1, ATP-binding cassette, subfamily F (GCN20) member 1; Bcl, B-cell leukemia/lymphoma 6; C3, complement component 3; Casp1, caspase 1; Ccl, chemokine (C-C) ligand; Ccr, chemokine (C-C) receptor; Cd40lg, Cd40 ligand; Crp, C-reactive protein; Cx3cl, chemokine (C-X3-C motif) ligand 1; Cxcl, chemokine (C-X-C) ligand; Cxcr, chemokine (C-X-C motif) receptor 3; Ifng, interferon gamma; IL, interleukin; IL10ra, interleukin 10 receptor alpha; IL10rb, interleukin 10 receptor beta; IL1f, interleukin 1 family, member; IL1r, interleukin 1 receptor type I; IL1r2, interleukin 1 receptor type I; IL2rb, interleukin 2 receptor beta chain; IL2rg, interleukin 2 receptor gamma chain; IL13ra1, interleukin 13 receptor alpha 1; IL5ra, interleukin 5 receptor alpha; IL6ra, interleukin 6 receptor alpha; IL6 st, interleukin 6 signal transducer; IL17b, interleukin 17b; IL8rb; interleukin 8 receptor, beta; Itgam, integrin alpha M, Itgb; integrin beta 2; Lta/b, lymphotoxin a/b; Mif, macrophage migration inhibitory factor; Pf4, platelet factor 4; Scye1, small inducible cytokine subfamily E member 1; Spp1, osteopontin; Tgfb, transforming growth factor beta; Tnf, tumor necrosis factor; Tnfrsf1, tumor necrosis factor receptor superfamily, member 1; Tollip, Toll interacting protein; Xcr1, chemokine (C motif) receptor 1.
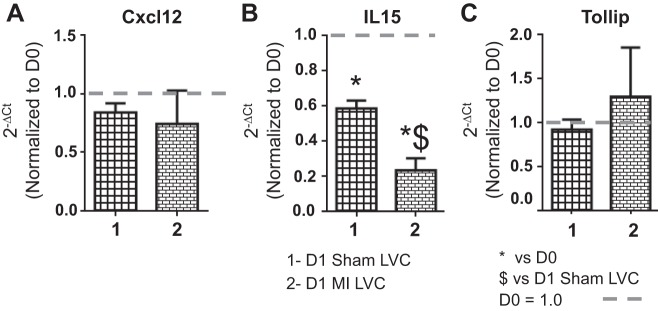
To evaluate the effects of sham surgery on the inflammatory response in the LVC, we measured gene expression of Cxcl12, IL-15, and Tollip (Fig. 4). These three genes were selected because they showed significant differences in the LVI due to both surgery and MI. Only IL-15 showed significance in the remote region, with IL-15 levels also decreasing in the D1 LVC sham group compared with D0. IL-15, therefore, decreased in all groups examined compared with the D0 control, while Cxcl12 and Tollip were restricted to the infarct area.
Fig. 4.
Sham surgery caused no inflammatory gene changes in the remote (LVC) region. Gene levels of selected inflammatory [Cxcl12 (A), IL-15 (B), and Tollip (C)] molecules were analyzed by real time RT2-PCR and normalized to D0 values. The x-axis labels are as follows: 1 = D1 sham LVC, and 2 = D1 MI LVC. Sample sizes are n = 6/group. *P < 0.05 vs. D0; $P < 0.05 vs. D1 sham LVC.
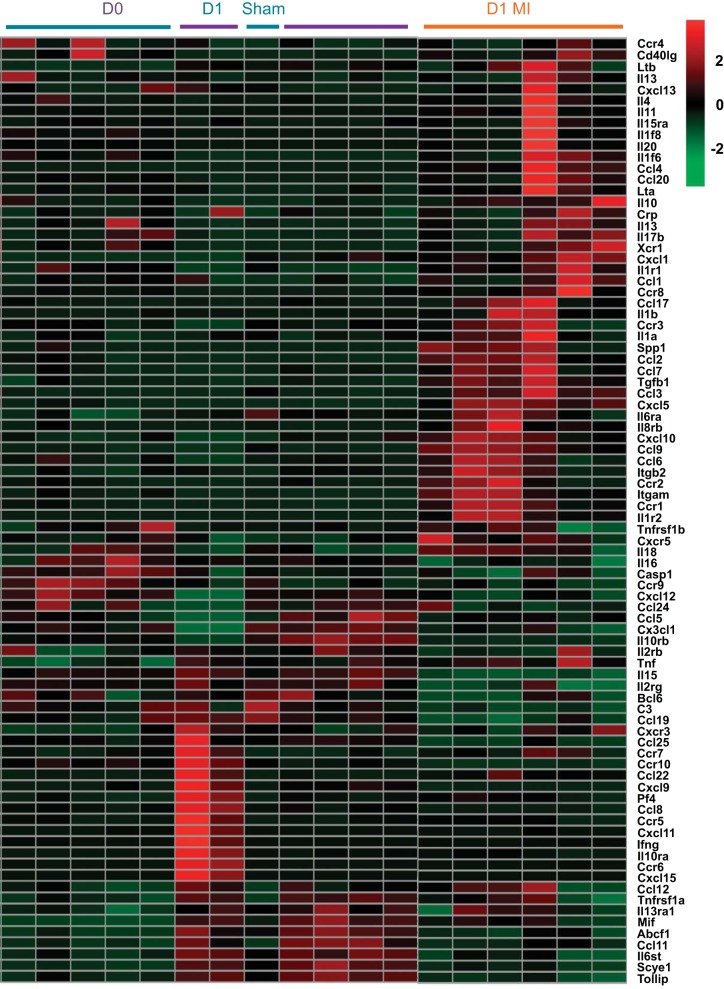
To visualize the changes in inflammation at D1 at the global systems level, we generated a heat map of the 84 inflammatory cytokine genes tested by RT2-PCR array (Fig. 5). By unsupervised clustering, the D0 and D1 sham groups intermingled into one cluster, while the D1 MI group showed a distinct cluster. In the D1 MI group, the majority of genes were highly expressed. Combined, the above results revealed that the majority of inflammatory responses observed were due to permanent occlusion during experimental MI surgery and that the sham operation caused only modest change in inflammation.
Fig. 5.
Sham groups showed similar inflammatory gene profiles, compared with D0. Heat map of 84 inflammatory cytokines was generated using the Metaboanalyst 3.0 software. By unsupervised clustering, the D0 and sham groups clustered together, demonstrating overlap between these 2 groups.
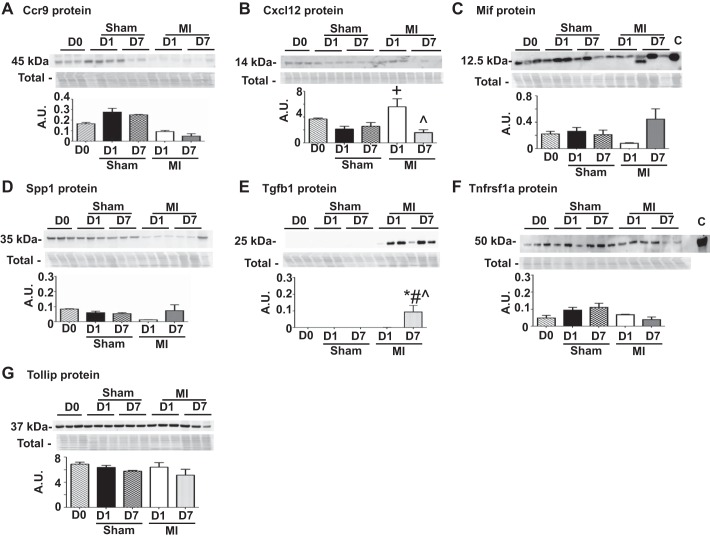
To investigate if the inflammatory gene changes observed in the sham groups translated to protein differences, we measured protein expression for seven inflammatory markers (Ccr9, Cxcl12, Mif, Spp1, Tgfb1, Tnfrsf1a, and Tollip). These seven markers were selected using criteria that ensured all patterns of gene changes observed in Fig. 3 were represented in this protein analysis. Tnfrsf1a gene level showed changes only in the D1 sham group whereas Mif showed changes in both D1 sham and D7 sham groups. Ccr9 and Cxcl12 gene levels showed changes in both D1 sham and D1 MI group and Tollip gene levels changed in D1 sham, D7 sham and D7 MI group. Spp1 and Tgfb1 were used as positive infarction controls and were picked from the group of genes that only showed changes due to MI and not sham surgery. Overall, these seven markers collectively represented the genes that showed sham or MI or both sham and MI dependent changes in expression. None of the seven inflammatory marker proteins were different in the sham group compared with D0, indicating that gene induction did not translate to increased protein concentrations in the sham groups (Fig. 6). While Mif, Spp1, Tnfrsf1a, and Tollip protein were not different among any of the groups, Cxcl12 showed strong induction at D1 post-MI and reduced amounts by D7 post-MI, compared with the D0 control. In addition, Tgfb1 showed no induction at D1 post-MI but was elevated at D7 post-MI compared with D0 and sham controls. The above results indicate that the cytokine gene induction due to sham surgery did not translate to increased protein concentrations in the sham groups. Sham surgery initiated a gene preparation program that did not translate to protein in the absence of MI. These findings highlight the importance of examining at the level of the proteome (9).
Fig. 6.
A–G: sham surgery did not increase cytokine protein expression. The sham group showed no significant differences in protein levels compared with D0 (no surgical operation) controls. Entire membrane image for the total membrane protein stain (Total), which was used to normalize the immunoblotting results, is shown along with each blot. A.U., arbitrary units. Sample sizes are n = 3–6/group. *P < 0.05 vs. D0; +P < 0.05 vs D1 sham; #P < 0.05 vs. D7 sham; ^P < 0.05 vs D1 MI.
Sham surgery resulted in only modest changes in ECM gene expression without concomitant increases in protein expression.
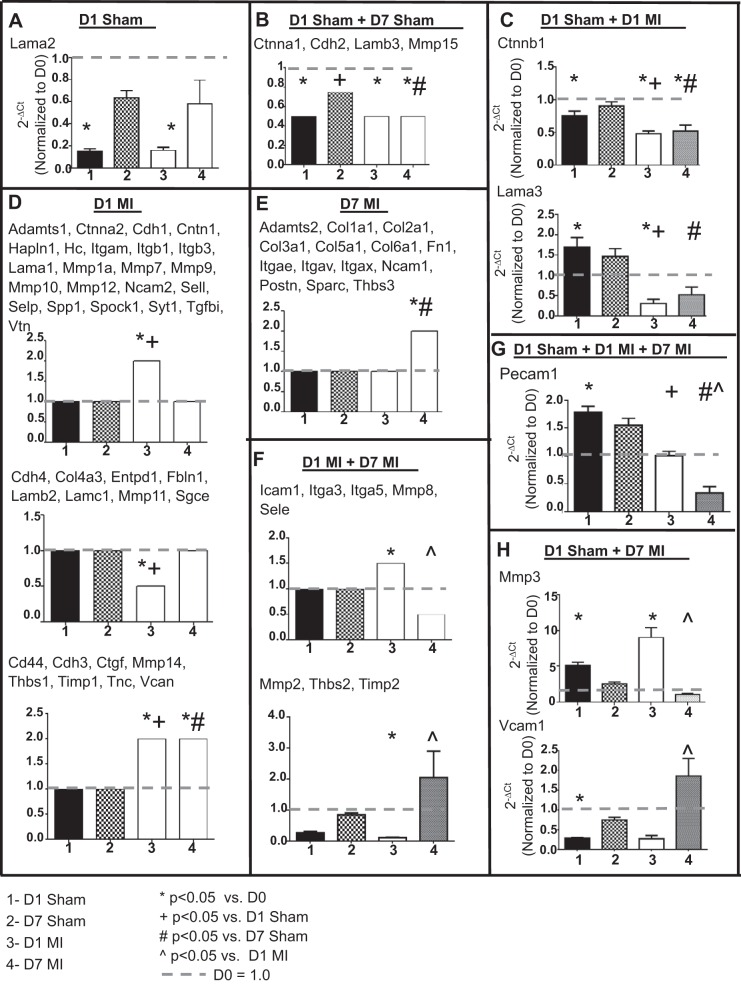
To evaluate the effects of sham surgery on the ECM response, we measured gene levels of 84 ECM and adhesion molecules. There were 71 genes different among the groups, with the majority of changes being due to the induction of MI. Only one gene (Lama2) was decreased in D1 sham, and four genes (Ctnna1, Cdh2, Lamb3, and Mmp15) were decreased in both D1 and D7 sham indicating changes due to the surgical procedure (Fig. 7 and Table 3; P < 0.05). Ctnnb1 and Lama3 showed both surgery- and MI-dependent effects at D1 whereas two genes (Mmp3 and Vcam1) showed significant changes at D1 sham and D7 MI. In addition, Pecam1 was the only gene that showed significant increase at D1 sham and both D1 and D7 MI compared with D0. Studies in mice involving the evaluation of these 10 genes (Ctnna1, Ctnnb1, Cdh2, Lama2, Lama3, Lamb3, Mmp3, Mmp15, Pecam1, and Vcam1) should take this result into consideration. The remaining 61 genes showed a significant difference in D1 MI, D7 MI, or both MI groups. The majority of ECM gene changes were due to permanent occlusion of the coronary artery, not due to the surgical operation itself.
Fig. 7.
Sham surgery caused only modest changes in extracellular matrix (ECM) gene expression. A–H: graphs depicting 7 different patterns of changes in ECM gene expression between the sham and MI groups compared with D0 (no surgical operation) controls. For the patterns with only one gene, actual normalized values are shown. For patterns with ≥2 genes, arbitrary values were set at 2.0 for upregulation, 1.0 for no change, and 0.5 for downregulation to graphically represent the changes across the 4 groups. F: lower graph is Mmp2. The x-axis labels are as follows: 1 = D1 sham, 2 = D7 sham, 3 = D1 MI, and 4 = D7 MI. Sample sizes are n = 6/group. *P < 0.05 vs. day 0, +P < 0.05 vs D1 sham; #P < 0.05 vs. D7 sham; ^P < 0.05 vs D1 MI.
Table 3.
ECM and adhesion gene expression changes among D0, sham, and MI groups
| Gene | D1 Sham vs. D0 | D7 Sham vs. D0 | D1 MI vs. D0 | D7 MI vs. D0 | D7 Sham vs. D1 Sham | D1 MI vs. D1 Sham | D7 MI vs. D7 Sham | D7 MI vs. D1 MI |
|---|---|---|---|---|---|---|---|---|
| Adamts1 | ↑ | |||||||
| Adamts2 | ↑ | ↑ | ||||||
| Cd44 | ↑ | ↑ | ||||||
| Cdh1 | ↑ | |||||||
| Cdh2 | ↓ | ↓ | ↓ | ↓ | ↑ | ↓ | ||
| Cdh3 | ↑ | ↑ | ↑ | |||||
| Cdh4 | ↓ | ↓ | ↓ | |||||
| Cntn1 | ↑ | |||||||
| Col1a1 | ↑ | ↑ | ||||||
| Col2a1 | ↑ | ↑ | ||||||
| Col3a1 | ↑ | |||||||
| Col4a3 | ↓ | |||||||
| Col5a1 | ↑ | |||||||
| Col6a1 | ↑ | |||||||
| Ctgf | ↑ | |||||||
| Ctnna1 | ↓ | ↓ | ↓ | ↓ | ↑ | ↑ | ||
| Ctnna2 | ↑ | |||||||
| Ctnnb1 | ↓ | ↓ | ↓ | ↓ | ↓ | |||
| Entpd1 | ↓ | |||||||
| Fbln1 | ↓ | |||||||
| Fn1 | ↑ | |||||||
| Hapln1 | ↑ | |||||||
| Hc | ↑ | |||||||
| Icam1 | ↑ | ↓ | ||||||
| Itga3 | ↑ | ↓ | ↑ | ↓ | ↓ | |||
| Itga5 | ↑ | ↓ | ||||||
| Itgae | ↑ | ↑ | ||||||
| Itgam | ↑ | ↑ | ||||||
| Itgav | ↑ | ↑ | ||||||
| Itgax | ↑ | ↑ | ||||||
| Itgb1 | ↑ | |||||||
| Itgb3 | ↑ | |||||||
| Lama1 | ↑ | |||||||
| Lama2 | ↓ | ↓ | ||||||
| Lama3 | ↑ | ↓ | ↓ | ↓ | ||||
| Lamb2 | ↓ | ↓ | ||||||
| Lamb3 | ↓ | ↓ | ↓ | ↓ | ||||
| Lamc1 | ↓ | ↓ | ||||||
| Mmp1a | ↑ | |||||||
| Mmp2 | ↓ | ↑ | ||||||
| Mmp3 | ↑ | ↑ | ↓ | |||||
| Mmp7 | ↑ | |||||||
| Mmp8 | ↑ | ↓ | ||||||
| Mmp9 | ↑ | |||||||
| Mmp10 | ↑ | |||||||
| Mmp11 | ↓ | ↑ | ||||||
| Mmp12 | ↑ | |||||||
| Mmp14 | ↑ | ↑ | ↑ | |||||
| Mmp15 | ↓ | ↓ | ↓ | ↓ | ↓ | |||
| Ncam1 | ↑ | ↑ | ||||||
| Ncam2 | ↑ | |||||||
| Pecam1 | ↑ | ↓ | ↓ | ↓ | ↓ | |||
| Postn | ↑ | ↑ | ||||||
| Sele | ↑ | ↓ | ||||||
| Sell | ↑ | |||||||
| Selp | ↑ | |||||||
| Sgce | ↓ | |||||||
| Sparc | ↑ | |||||||
| Spp1 | ↑ | ↑ | ||||||
| Spock1 | ↑ | |||||||
| Syt1 | ↑ | |||||||
| Tgfbi | ↑ | |||||||
| Thbs1 | ↑ | ↑ | ||||||
| Thbs2 | ↓ | ↑ | ||||||
| Thbs3 | ↑ | ↑ | ||||||
| Timp1 | ↑ | ↑ | ||||||
| Timp2 | ↓ | ↑ | ||||||
| Tnc | ↑ | ↑ | ||||||
| Vcam1 | ↓ | ↓ | ↑ | |||||
| Vcan | ↑ | ↑ | ||||||
| Vtn | ↓ | ↓ | ↓ | ↓ |
Arrows depict direction of change; n = 6/group. The increase, decrease, and no change were based on quantitative measurements that were statistically different based on RT2-PCR analysis. Qualitative directions for change in gene expression are shown (all P < 0.05). Blank boxes = no significant difference.
ECM, extracellular matrix; MI, myocardial infarction. Genes Adamts5, Adamts8, Col4a1, Col4a2, Ecm1, Emilin1, Itga1, Itga2, Itga3, Itgb2, Itgb4, Mmp13, and Timp3 showed no significant differences among any of the groups. Gene names in alphabetical order: Adamts, a disintegrin-like and metalpeptidase (reprolysin type) with thrombospondin type 1 motif; Cdh, cadherin; Cd44, Cd44 antigen; Cntn1, contactin 1; Col, collagen; Ctgf, connective tissue growth factor; Ctnna, catenin (cadherin associated protein); Ctnnb1, catenin (cadherin associated protein) beta 1; Ecm, extracellular matrix protein; Emilin1, elastin microfibril interfacer 1; Entpd, ectonucleoside triphosphate diphosphohydrolase 1; Fbln1, fibulin 1; Fn1, fibronectin 1; Hapln I, hylauronan and proteoglycan link protein I; Hc, hemolytic complement; Icam1, intercellular adhesion molecule 1; Itga, integrin alpha; Itgae, integrin alpha E, epithelial-associated; Itgal, Integrin alpha L; Itgam, integrin alpha M; Itgav, integrin alpha V; Itgax, integrin alpha X; Itgb, integrin beta; Lama, laminin; Lamb, laminin beta; Lamc, laminin gamma; Ncam, neural cell adhesion molecule; Pecam1, platelet/endothelial cell adhesion molecule 1; Postn, periostin; Sele, selectin, endothelial cell; Sell, selectin lympohocyte; Selp, selectin platelet; Sgce, sarcoglycan epsilon; Sparc, secreted acidic cysteine rich glycoprotein; Spock1, Sparc/osteonectin, cwcv, and kazal-like domains proteoglycan 1; Spp1, osteopontin; Syt1, synaptotagmin I; Tgfbi, transforming growth factor, beta induced; Thbs, thrombospondin;Timp, tissue inhibitor of metalloproteinase; Tnc, tenascin C; Vcam1, vascular cell adhesion molecule 1; Vcan, versican; Vtn, vitronectin.
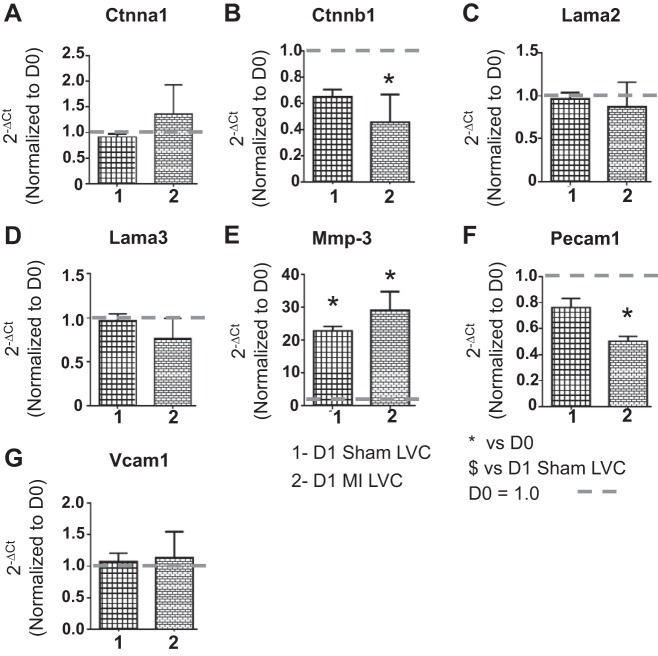
To evaluate the effects of sham surgery on the ECM response in the remote LVC region, we measured gene levels of 7 ECM molecules (Ctnna1, Ctnnb1, Lama2, Lama3, Mmp-3, Pecam1, and Vcam1; Fig. 8). These seven genes were selected, because they showed significant differences in the LVI vs. sham comparisons. Out of the seven genes measured, only MMP-3 levels increased in the LVC region of both D1 sham and D1 MI groups compared with D0. Pecam1 was significantly decreased in the LVC of the MI group but not in the sham group. No changes in any other gene were observed in the D1 sham LVC compared with D0. The above data indicate that the gene changes observed in the LVI region, with the exception of MMP-3 and Pecam1, were focal and not observed in the remote region.
Fig. 8.
Sham surgery caused no ECM gene changes in LVC region. Gene levels of selected ECM molecules [Ctnna1 (A), Ctnnb1 (B), Lama2 (C), Lama3 (D), Mmp-3 (E), Pecam1 (F), and Vcam1 (G)] were analyzed by real time RT2-PCR and normalized to D0 values. The x-axis labels are as follows: 1 = D1 sham LVC, and 2 = D1 MI LVC. Sample sizes are n = 6/group. *P < 0.05 vs. D0; $P < 0.05 vs. D1 sham LVC.
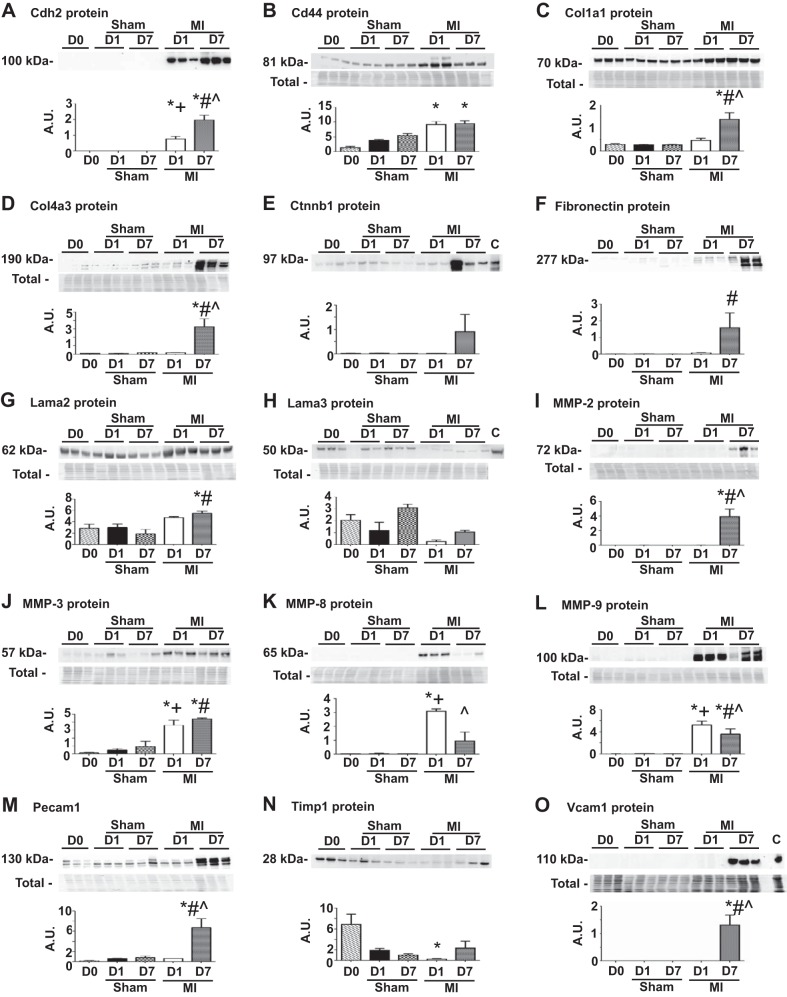
To investigate if the ECM gene changes observed in the sham groups translated to protein differences, we measured by immunoblotting the protein expression for 15 ECM markers (Cdh2, Cd44, Col1a1, Col4a3, Ctnnb1, Fn1, Lama2, Lama3, MMP-2, MMP-3, MMP-8, MMP-9, Pecam1, Timp1, and Vcam1). These 15 markers were selected using criteria that ensured all pattern of gene changes observed in Fig. 7 were represented in this protein analysis. We selected Cd44, Col1a1, Col4a3, Fn1, MMP-2, MMP-8, MMP-9, and Timp1 as positive controls, since these genes showed no changes in the sham group but significant changes in the MI group. None of the 15 ECM marker protein levels were different in the sham group compared with D0, indicating that gene induction did not translate to increased protein concentrations in the sham groups (Fig. 9). Similar to the gene expression level, all 8 of the positive control proteins were similar in the sham groups compared with D0 and were significantly increased at either or both D1 and D7 post-MI. While Cdh2, Ctnnb1, Lama2, Lama3, MMP-3, Pecam1, and Vcam1 genes showed significant differences in either sham group alone or both sham and MI groups, protein levels did not show any of these changes. These results indicate that the gene induction due to sham surgery did not translate to increased protein concentrations in the sham groups.
Fig. 9.
A–O: sham surgery did not increase ECM protein expression. The sham groups showed no significant differences in protein levels compared with D0 (no surgical operation) controls. Entire membrane image for the total membrane protein stain (Total), which was used to normalize the immunoblotting results, is shown along with each blot. For A, E, F, and N, the total protein membrane image is shown in Fig. 6D, C, E, and C, respectively. A.U., arbitrary units; C, positive control. Sample sizes are n = 6/group. *P < 0.05 vs. D0; +P < 0.05 vs D1 sham; #P < 0.05 vs. D7 sham; ^P < 0.05 vs D1 MI.
Sham surgery did not stimulate collagen scar formation in the myocardium.
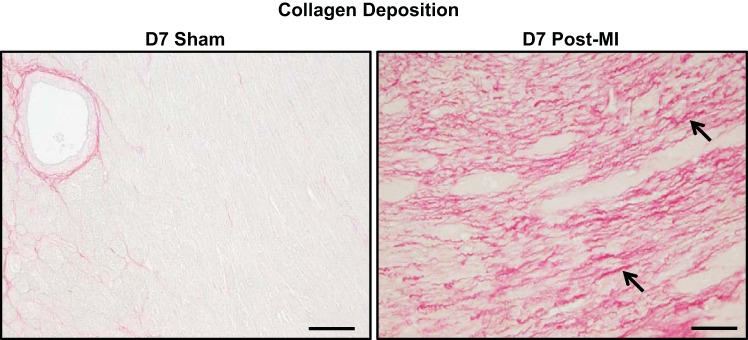
We analyzed collagen deposition by picrosirius red staining (Fig. 10). The sham groups showed no collagen deposition, indicating no reparative scar formation due to the surgical procedure. As a positive control, the D7 post-MI group showed robust collagen deposition compared with the sham group.
Fig. 10.
Sham surgery did not stimulate collagen scar formation. No collagen deposition was observed in the D7 sham group compared with the D7 post-MI groups. Arrows depict positive staining. Samples sizes n = 12/group. Scale bar = 200 μm.
Inflammatory proteins were not elevated in the plasma of D1 sham.
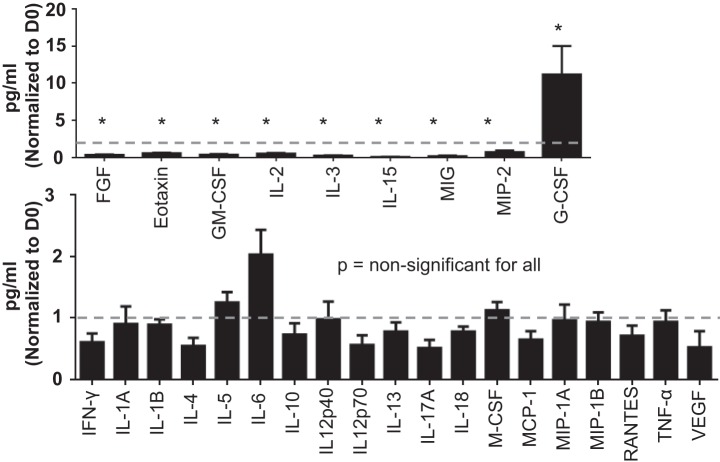
To further assess the D1 sham environment, we compared D0 and D1 sham plasma analytes. Out of 32 cytokines analyzed by multianalyte proteomic profiling, we identified 19 inflammatory cytokines that had no significant difference between D0 and D1 sham groups (Fig. 11). Out of 32 analytes, 8 cytokines (FGF, Eotaxin, GM-CSF, IL-15, IL-2, IL-3, MIG, and MIP-2) were significantly decreased and 1 cytokine (G-CSF) was significantly elevated in the D1 sham group compared with D0. For four cytokines (IL-9, KC, LIF, and PDGF-BB), concentrations were below detection limits in the plasma. Overall, this data confirmed that there was no robust systemic inflammatory response postsurgical trauma in the sham group.
Fig. 11.
Inflammatory proteins were not elevated in the plasma of D1 sham. Systemic inflammatory response in the D1 sham group was analyzed by multianalyte proteomic profiling. Out of 32 cytokines: A: 8 cytokines (FGF, Eotaxin, GM-CSF, IL-15, IL-2, IL-3, MIG, and MIP-2) were significantly lower and 1 cytokine (G-CSF) was significantly higher in the D1 sham group compared with D0 (all P < 0.05); B: 19 inflammatory cytokines showed no significant difference between D0 and D1 sham groups. D1 sham was normalized to D0. Sample sizes are n = 10–12/group. FGF, fibroblast growth factor; G-CSF, granulocyte colony stimulating factor; GM-CSF, granulocyte macrophage colony stimulating factor; IFN-γ, interferon-γ; IL, interleukin; M-CSF, macrophage colony stimulating factor; MCP, monocyte chemoattractant protein; MIG, monokine induced by γ-interferon; MIP, macrophage inflammatory protein; PDGF, platelet-derived growth factor subunit B; RANTES, regulated on activation, normal T-cell expressed and secreted; TNFα, tumor necrosis factor-α; VEGF, vacular endothelial growth factor. *P < 0.05 vs. D0.
DISCUSSION
The goal of this study was to document the sham environment for studies evaluating post-MI LV remodeling. Our own results indicate that out of 165 inflammatory and ECM genes analyzed, sham surgery initiated induction of 22 genes in total. While gene expression was elevated, these changes did not pass the threshold needed for protein induction. The most salient features of this report were that sham operation did not affect: 1) mortality or physiological variables, 2) leukocyte infiltration or inflammatory protein responses, and 3) ECM protein responses or collagen scar deposition. In contrast, MI surgery generated the expected robust effects on LV wound healing and remodeling. Taken together, these findings reveal that D0 (no surgery controls) samples are an adequate surrogate for sham surgeries, which is particularly useful for time-course studies.
An important component in evaluating surgical MI models is distinguishing the downstream effects of ischemia vs. effects due to the surgery itself. In this study, we used a minimally invasive model to analyze the effect of sham surgery on multiple variables and have established a standardized platform to demonstrate that sham surgery does not induce significant inflammatory or ECM responses and does not mobilize leukocytes into the LV. Hoffmann et al. (4) reported that sham associated effects should be taken into consideration when measuring monocyte subset kinetics, as sham-induced monocytosis did not reflect infarction-associated cardiac inflammation (4). In their study, thoracotomy with rib dissection was performed as part of the surgical procedure, which may explain the peripheral mobilization of leukocyte subsets observed in the sham group. Performing ischemia and reperfusion while the chest is still open provides the additional hazard for disturbance of an ideal basic sham procedure. Hence, we recommend using our minimally invasive approach, thoracotomy through intercostal space, for MI surgery to reduce confounding effects of the surgical procedure on inflammation.
In conclusion, this study delineated the baseline characteristics of sham surgery in the absence of MI. Our extensive analysis of 165 ECM and inflammatory cytokine genes in LVI and LVC, 22 ECM and inflammatory cytokine proteins in the LVI, and 32 inflammatory cytokines in plasma, along with a multitude of variables including mortality, physiology, leukocyte infiltration, and collagen scar formation among sham, D0 (mice with no surgical operation) negative controls, and MI positive controls indicates that the minimally invasive surgical approach to generate MI does not by itself induce major changes. Table 4 lists output measurements that may serve as a suggested minimum assessment profile to screen the sham group in an MI experiment. Based on our results, we conclude that no surgical operation controls can be used as a one surrogate control group for MI studies involving time-course evaluations. Our study defines the sham environment and provides insight on how refining procedures allows the reduction in animal use numbers for MI studies.
Table 4.
A suggested minimum assessment profile to screen sham effects in an MI experiment
| Assessment | Markers |
|---|---|
| LV necropsy | LV mass/body weight, lung weight, edema index and infarct size |
| LV structure and function | Wall thickness and end-systolic and -diastolic volumes |
| LV inflammatory response | Abcf1, Ccr9, Ccl11, Cxcl12, IL-1f6, IL-6 st, IL-13ra1, IL-15, Mif, Scye1, Tnfrsf1a, and Tollip |
| ECM remodeling response | Ctnna1, Ctnnb1, Cdh2, Lama2, Lama3, Lamb3, Mmp3, Mmp9, Mmp15, Pecam1, Timp1, and Vcam1 |
| Systemic inflammatory response | G-CSF, IL-1β, IL-6, MCP-1, and MIP-2 |
G-CSF, granulocyte colony stimulating factor; IL, interleukin; MCP, monocyte chemoattractant protein; MIP, macrophage inflammatory protein.
GRANTS
We acknowledge funding support from American Heart Association Grants 14POST18770012, 14SDG18860050, and 15SDG22930009. We acknowledge support from National Institutes of Health Grants HL-075360, HL-129823, HL-051971, GM-104357, and GM-114833 and Biomedical Laboratory Research and Development Service of the Veterans Affairs Office of Research and Development Award 5I01BX000505.
DISCLOSURES
No conflicts of interest, financial or otherwise, are declared by the author(s).
AUTHOR CONTRIBUTIONS
R.P.I., P.L.C., M.J., E.R.F., J.B.H., D.B., and J.W. performed experiments; R.P.I., L.E.d.C.B., P.L.C., E.R.F., J.B.H., D.B., J.W., A.G., and M.L.L. analyzed data; R.P.I. and M.L.L. prepared figures; R.P.I. and M.L.L. drafted manuscript; R.P.I., L.E.d.C.B., P.L.C., Y.M., K.Y.D.-P., M.J., E.R.F., J.B.H., D.B., J.W., L.F., A.G., and M.L.L. edited and revised manuscript; R.P.I., L.E.d.C.B., P.L.C., Y.M., K.Y.D.-P., M.J., E.R.F., J.B.H., D.B., J.W., L.F., A.G., and M.L.L. approved final version of manuscript; L.E.d.C.B., Y.M., K.Y.D.-P., M.J., E.R.F., L.F., A.G., and M.L.L. interpreted results of experiments; M.L.L. conception and design of research.
REFERENCES
- 1.DeLeon-Pennell KY, de Castro Bras LE, Iyer RP, Bratton DR, Jin YF, Ripplinger CM, Lindsey ML. Gingivalis lipopolysaccharide intensifies inflammation post-myocardial infarction through matrix metalloproteinase-9. J Mol Cell Cardiol 76: 218–226, 2014. [DOI] [PMC free article] [PubMed] [Google Scholar]
- 2.Flurkey KH. Mouse models in aging research. In: The Mouse in Biomedical Research. Burlington, MA: American College Laboratory Animal Medicine, 2007. [Google Scholar]
- 3.Halade GV, Ma Y, Ramirez TA, Zhang J, Dai Q, Hensler JG, Lopez EF, Ghasemi O, Jin YF, Lindsey ML. Reduced BDNF attenuates inflammation and angiogenesis to improve survival and cardiac function following myocardial infarction in mice. Am J Physiol Heart Circ Physiol 305: H1830–H1842, 2013. [DOI] [PMC free article] [PubMed] [Google Scholar]
- 4.Hoffmann J, Ospelt M, Troidl C, Voss S, Liebetrau C, Kim WK, Rolf A, Wietelmann A, Braun T, Troidl K, Sadayappan S, Barefield D, Hamm C, Nef H, Mollmann H. Sham surgery and inter-individual heterogeneity are major determinants of monocyte subset kinetics in a mouse model of myocardial infarction. PLoS One 9: e98456, 2014. [DOI] [PMC free article] [PubMed] [Google Scholar]
- 5.Iyer RP, Patterson NL, Zouein FA, Ma Y, Dive V, de Castro Bras LE, Lindsey ML. Early matrix metalloproteinase-12 inhibition worsens post-myocardial infarction cardiac dysfunction by delaying inflammation resolution. Int J Cardiol 185: 198–208, 2015. [DOI] [PMC free article] [PubMed] [Google Scholar]
- 6.Lindsey ML, Escobar GP, Dobrucki LW, Goshorn DK, Bouges S, Mingoia JT, McClister DM Jr, Su H, Gannon J, MacGillivray C, Lee RT, Sinusas AJ, Spinale FG. Matrix metalloproteinase-9 gene deletion facilitates angiogenesis after myocardial infarction. Am J Physiol Heart Circ Physiol 290: H232–H239, 2006. [DOI] [PubMed] [Google Scholar]
- 7.Lindsey ML, Iyer RP, Zamilpa R, Yabluchanskiy A, DeLeon-Pennell KY, Hall ME, Kaplan A, Zouein FA, Bratton D, Flynn ER, Cannon PL, Tian Y, Jin YF, Lange RA, Tokmina-Roszyk D, Fields GB, de Castro Bras LE. A novel collagen matricryptin reduces left ventricular dilation post-myocardial infarction by promoting scar formation and angiogenesis. J Am Coll Cardiol 66: 1364–1374, 2015. [DOI] [PMC free article] [PubMed] [Google Scholar]
- 8.Lindsey ML, Mayr M, Gomes AV, Delles C, Arrell DK, Murphy AM, Lange RA, Costello CE, Jin YF, Laskowitz DT, Sam F, Terzic A, Van Eyk J, Srinivas PR; American Heart Association Council on Functional Genomics and Translational Biology, Council on Cardiovascular Disease in the Young, Council on Clinical Cardiology, Council on Cardiovascular and Stroke Nursing, Council on Hypertension, and Stroke Council. Transformative impact of proteomics on cardiovascular health and disease: a scientific statement from the American Heart Association. Circulation 132: 852–872, 2015. [DOI] [PubMed] [Google Scholar]
- 9.Ma Y, Chiao YA, Zhang J, Manicone AM, Jin YF, Lindsey ML. Matrix metalloproteinase-28 deletion amplifies inflammatory and extracellular matrix responses to cardiac aging. Microsc Microanal 18: 81–90, 2012. [DOI] [PMC free article] [PubMed] [Google Scholar]
- 10.Ma Y, Yabluchanskiy A, Iyer RP, Cannon PL, Flynn ER, Jung M, Henry J, Cates CA, Deleon-Pennell KY, Lindsey ML. Temporal neutrophil polarization following myocardial infarction. Cardiovasc Res 110: 51–61, 2016. [DOI] [PMC free article] [PubMed] [Google Scholar]
- 11.Michael LH, Hunt JR, Weilbaecher D, Perryman MB, Roberts R, Lewis RM, Entman ML. Creatine kinase and phosphorylase in cardiac lymph: coronary occlusion and reperfusion. Am J Physiol Heart Circ Physiol 248: H350–H359, 1985. [DOI] [PubMed] [Google Scholar]
- 12.National Research Council. Guide for the Care and Use of Laboratory Animals. Washington, DC: National Academy Press, 2011. [Google Scholar]
- 13.Nossuli TO, Lakshminarayanan V, Baumgarten G, Taffet GE, Ballantyne CM, Michael LH, Entman ML. A chronic mouse model of myocardial ischemia-reperfusion: essential in cytokine studies. Am J Physiol Heart Circ Physiol 278: H1049–H1055, 2000. [DOI] [PubMed] [Google Scholar]
- 13a.Russell W, Burch R. The Principles of Humane Experimental Technique. London: Methuen, 1959. [Google Scholar]
- 14.van Zuylen VL, den Haan MC, Roelofs H, Fibbe WE, Schalij MJ, Atsma DE. Myocardial infarction models in NOD/Scid mice for cell therapy research: permanent ischemia vs ischemia-reperfusion. Springeplus 4: 336, 2015. [DOI] [PMC free article] [PubMed] [Google Scholar]
- 15.Vitale A, Manciocco A, Alleva E. The 3R principle and the use of non-human primates in the study of neurodegenerative diseases: the case of Parkinson's disease. Neurosci Biobehav Rev 33: 33–47, 2009. [DOI] [PubMed] [Google Scholar]
- 16.Zamilpa R, Zhang J, Chiao YA, de Castro Bras LE, Halade GV, Ma Y, Hacker SO, Lindsey ML. Cardiac wound healing post-myocardial infarction: a novel method to target extracellular matrix remodeling in the left ventricle. Methods Mol Biol 1037: 313–324, 2013. [DOI] [PMC free article] [PubMed] [Google Scholar]


