

Abstract
During post-transcriptional gene regulation (PTGR), RNA binding proteins (RBPs) interact with all classes of RNA to control RNA maturation, stability, transport, and translation. Here, we describe Photoactivatable-Ribonucleoside-Enhanced Cross linking and Immunoprecipitation (PAR-CLIP), a transcriptome-scale method for identifying RBP binding sites on target RNAs with nucleotide-level resolution. This method is readily applicable to any protein directly contacting RNA, including RBPs that are predicted to bind in a sequence- or structure-dependent manner at discrete RNA recognition elements (RREs), and those that are thought to bind transiently, such as RNA polymerases or helicases.
Keywords: RNA-binding protein (RBP), RNA, Photoactivatable ribonucleoside enhanced cross-linking and immunoprecipitation (PAR-CLIP), Cross-linking and immunoprecipitation (CLIP), Posttranscriptional gene regulation (PTGR), RNA recognition element (RRE), Noncoding RNA, mRNA, Binding site
1. Introduction
All classes of RNA are subject to posttranscriptional gene regulation (PTGR), including splicing, 5′- and 3′-end-modification, editing, transport, translation, and degradation [1–3]. These processes are critical for the regulation of protein-coding messenger RNA (mRNA), as well as for the biogenesis and function of non-coding RNAs (ncRNAs, e.g., ribosomal RNA, microRNA, small interfering RNA, etc.), which themselves have a wide range of gene-regulatory functions [4]. PTGR is coordinated by the actions of ribonucleoproteins (RNPs), protein–RNA complexes composed of one or more RNA binding proteins (RBPs), and associated coding or noncoding RNAs.
The fundamental importance of PTGR is reflected in analyses of abundance, expression patterns, and evolutionary conservation of RBPs. In human cell lines and tissues, approximately 20 % of the protein-coding transcriptome is comprised of RBPs, making RBPs more abundant than most other classes of proteins. The low tissue-specificity and deep evolutionary conservation of most RBP families suggests that many PTGR processes are ancient and equally essential for all cells [4]. Dysregulation of PTGR is observed in a wide variety of human pathologies, ranging from musculoskeletal and autoimmune disorders, to neurodegenerative disease, to essentially all forms of cancer [5–7].
Dissection of PTGR networks requires the careful characterization of the molecular interactions of RBPs with their RNA ligands and other binding partners, but this effort is complicated by the vast size of PTGR networks. In humans, there are approximately 1500 proteins containing identified RNA binding domains (RBDs), and over 20,000 protein-coding mRNAs in addition to the thousands of diverse noncoding RNAs [8]. Each RBP binds at defined sequence and structural elements termed RNA recognition elements (RREs). However, RREs are short and partially degenerate, confounding reliable computational predictions and sparking the need for experimental methods to comprehensively identify RREs on a transcriptome-wide scale [9].
Traditionally, RREs were characterized individually in a reductive process; sequences from known RNA targets were analyzed and then putative RREs were biochemically validated. Characterization of RNPs on a transcriptome-wide scale first became possible using RNP Immunoprecipitation (RIP) followed by comprehensive identification and quantification of recovered RNAs by microarray or next generation sequencing analysis (RIP-Chip or RIP-seq) [10]. However, RIP methods are limited to the analysis of kinetically stable interactions. Furthermore, the RRE needs to be inferred computationally from the sequence of the long recovered RNAs, which is only successful for RREs with high information content [11, 12].
The recently introduced Crosslinking and Immunoprecipitation (CLIP) approaches use UV light to covalently cross-link RBPs with their RNA targets at the site of interaction. The covalent bond between the RBP and target RNAs allows for limited RNase digestions to trim the RNA to the footprint protected by the RBP, as well as additional stringent purification steps after IP, including denaturing polyacrylamide gel-electrophoresis and blotting onto nitrocellulose membranes. The recovered RNA segments can then be sequenced using next-generation sequencing technologies to reveal target transcripts and RREs on a transcriptome-wide scale [13, 14].
Here we provide a step-by-step protocol for Photoactivatable-Ribonucleoside-Enhanced CLIP (PAR-CLIP) (Fig. 1). In PAR-CLIP, photoactivatable ribonucleosides—4-thiouridine (4SU), or more rarely, 6-thioguanine (6SG)—are incorporated into nascent RNA transcripts. The labeled RNAs are excited in living cells with UVA or UVB light (>310 nm) and yield photoadducts with interacting RBPs. Besides an increased cross-linking efficiency compared to 254 nm CLIP, a key feature of PAR-CLIP is a characteristic mutation (T-to-C for 4SU and G-to-A for 6SG) introduced during reverse transcription at the position of cross-linking. This mutation pinpoints the sites of RNA–RBP interaction with nucleotide resolution. And, more importantly, it enables the user to computationally remove the ubiquitous background of co-purifying fragments of cellular RNAs that otherwise may be misinterpreted as signal [15]. The resulting detailed interaction maps will further our understanding of the mechanisms underlying the pathologic dysregulation of PTGR components. This information can also be integrated with emerging data from other large-scale sequencing efforts to interrogate whether variations in binding sites contribute to phenotypic variations or complex genetic disease.
Fig. 1.
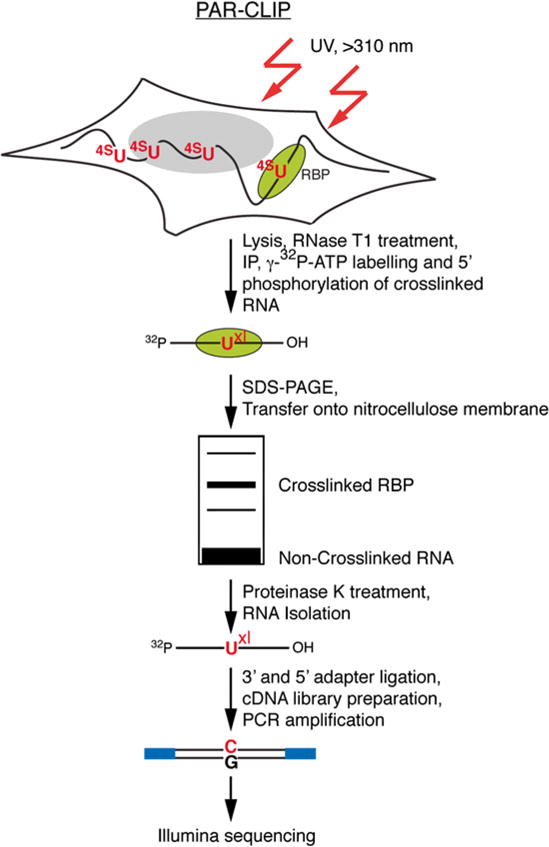
Outline of the PAR-CLIP methodology. PAR-CLIP begins with incorporation of photoactivatable thioribonucleosides into nascent transcripts followed by cross-linking with long-wavelength >310 nm UV. Cross-linked RNA–RBP complexes are isolated by immunoprecipitation and further purified by SDS-PAGE. After recovery from the purified radioactive band, the RNA is carried through a small RNA cDNA library preparation protocol for sequencing. Reverse transcription of cross-linked RNA with incorporated photoactivatable thioribonucleosides, followed by PCR amplification, leads to a characteristic mutation (T-to-C when using 4SU and G-to-A when using 6SG) that is used to identify the RNA recognition elements
The following guide covers all experimental steps of PAR-CLIP and cDNA library construction and touches on a number of aspects of the data analysis.
2 Materials
4-Thiouridine (4SU) stock solution (1 M): 260.27 mg 4SU in 1 ml DMSO.
1× NP40 lysis buffer: 50 mM HEPES, pH 7.5, 150 mM KCl, 2 mM EDTA, 1 mM NaF, 0.5 % (v/v) NP40, 0.5 mM DTT, complete EDTA-free protease inhibitory cocktail (Roche).
High-salt wash buffer: 50 mM HEPES–KOH, pH 7.5, 500 mM KCl, 0.05 % (v/v) NP40, 0.5 mM DTT, complete EDTA-free protease inhibitor cocktail (Roche).
Dephosphorylation Buffer: 50 mM Tris–HCl, pH 7.9, 100 mM NaCl, 10 mM MgCl2, 1 mM DTT.
Polynucleotide Kinase (PNK) Buffer without DTT: 50 mM Tris–HCl, pH 7.5, 50 mM NaCl, 10 mM MgCl2.
PNK Buffer with DTT: 50 mM Tris–HCl, pH 7.5, 50 mM NaCl, 10 mM MgCl2, 5 mM DTT.
SDS PAGE Loading Buffer: 10 % glycerol (v/v), 50 MM Tris–HCl, pH 6.8, 2 mM EDTA, 2 % SDS (w/v), 100 mM DTT, 0.1 % bromophenol blue.
1× Transfer Buffer with Methanol: 1× NuPAGE Transfer Buffer, 20 % MeOH.
2× Proteinase K Buffer: 100 mM Tris–HCl, pH 7.5 150 mM NaCl, 12.5 mM EDTA, 2 % (w/v) SDS.
Acidic Phenol–Chloroform–IAA: 25 ml acidic phenol, 24 ml chloroform, 1 ml isoamyl alcohol, pH 4.2.
10× RNA Ligase Buffer without ATP: 0.5 M Tris–HCl, pH 7.6, 0.1 M MgCl2, 0.1 M 2-mercaptoethanol, 1 mg/ml acetylated BSA (Sigma, B-8894).
10× RNA Ligase Buffer with ATP: 0.5 M Tris–HCl, pH 7.6, 0.1 M MgCl2, 0.1 M 2-mercaptoethanol, 1 mg/ml acetylated BSA (Sigma, B-8894), 2 mM ATP.
Formamide Gel Loading Dye: 50 mM EDTA, 0.05 % (w/v) bromophenol blue, formamide ad 100 %.
10× dNTP Solution: 2 mM dATP, 2 mM dCTP, 2 mM dGTP, 2 mM dTTP.
10× PCR Buffer: 100 mM Tris–HCl, pH 8.0, 500 mM KCl, 1 % Triton-X-100, 20 mM MgCl2, 10 mM 2-mercaptoethanol.
Dynabeads Protein G: Invitrogen, 100.03D/04D.
15 ml Falcon Centrifuge Tubes: Fisher Scientific.
1.5 ml DNA LoBind Tubes: Eppendorf.
RNase T1 (1000 U/μl): Fermentas, EN0541.
Calf Intestinal Alkaline Phosphatase (10,000 U/ml): New England Biolabs (NEB), M0290.
T4 Polynucleotide Kinase (10,000 U/ml): NEB, M0201.
γ-32P-ATP, 10 mCi/ml, 1.6 μM: Perkin Elmer, NEG002Z001MC.
NuPAGE Novex 4–12 % BT Midi 1.0 gel: Invitrogen.
20× NuPAGE MOPS running buffer: Invitrogen.
Protein Size Marker: Bio-Rad, 161-0374.
20× NuPAGE Transfer Buffer: Invitrogen.
0.45 μm Nitrocellulose Membrane: Invitrogen.
Proteinase K (Powder): Roche, 03 115 879 001.
GlycoBlue, 10 mg/ml: Ambion.
Truncated and mutated RNA Ligase 2, T4 Rnl2 (1-249) K227Q, 1 mg/ml: NEB, M0351, plasmid for recombinant expression can also be obtained at addgene.org.
T4 RNA Ligase (10 U/μl): Thermo Scientific.
SuperScript III Reverse Transcriptase: Invitrogen, 18080-044.
Taq DNA Polymerase, 5 U/μl: Various Suppliers.
MinElute Gel Extraction Kit: Qiagen.
Pre-adenylated 3′ Adapter (DNA): AppTCGTATGCCGTCTTCTGCTTGT.
5′ Adapter (RNA): GUUCAGAGUUCUACAGUCCGACGAUC.
3′ Primer: CAAGCAGAAGACGGCATACGA.
5′ Primer: AATGATACGGCGACCACCGACAGGTTCAGAGTTCTACAGTCCGA.
RNA Size Marker, 19 nt: 5′ pCGUACGCGGUUUAAACGA.
RNA Size Marker, 35 nt: 5′ pCUCAUCUUGGUCGUACGUACGCGGAAUAGUUUAAACUGU.
3 Methods
Before beginning PAR-CLIP, please see Notes 1–7 for essential preparatory steps.
3.1 Preparation of UV-Crosslinked RNPs
3.1.1 Expanding Cells
Expand cells in appropriate growth medium in 15-cm plates. As a starting point, we recommend using a number of cells that will result in 1.5–3 ml of wet cell pellet. For HEK293 cells, approximately 100–200 × 106 cells will result from 10 to 20 15-cm plates. Grow cells to approximately 80 % confluency.
16 h before crosslinking, add 4SU to a final concentration of 100 μM (1:1000 v/v of a 1 M 4SU stock solution) directly to the cell culture medium (see Note 8).
3.1.2 UV-Crosslinking
For adherent cells
Aspirate or pour off media from plates (see Note 9).
Irradiate cells uncovered with a dose of 0.15 J/cm2 of >310 nm UV light in a Spectrolinker XL-1500 (Spectronics Corporation) equipped with >310 nm light bulbs or similar device.
Cover cells in 1 ml PBS and scrape cells off with a rubber policeman. Transfer the cell suspension to 50 ml centrifugation tubes and collect by centrifugation at 500 × g at 4 °C for 5 min. Discard the supernatant.
Stopping point
If you do not want to continue directly with cell lysis and immunoprecipitation, snap freeze the cell pellet in liquid nitrogen and store at −80 °C. Cell pellets can be stored for at least 12 months.
For cells grown in suspension
Collect cells by centrifugation at 500 × g at 4 °C for 5 min. Aspirate or pour off media.
Take up cells in 10 ml PBS and transfer onto one 15-cm cell culture plate.
Irradiate uncovered with a dose of 0.2 J/cm2 of >310 nm UV light in a Spectrolinker XL-1500 (Spectronics Corporation) equipped with >310 nm light bulbs or similar device.
Transfer cells into a 50 ml centrifugation tube and collect by centrifugation at 500 × g for 5 min at 4 °C and discard the supernatant.
Stopping point
If you do not want to continue directly with cell lysis and immunoprecipitation, snap freeze the cell pellet in liquid nitrogen and store at −80 °C. Cell pellets can be stored for at least 12 months.
3.1.3 Cell Lysis and RNase T1 Digest
Take up cross-linked cell pellet in 3 volumes of 1× NP40 lysis buffer and incubate on ice for 10 min in a 15 ml centrifuge tube.
Clear cell lysate by centrifugation at 13,000 × g at 4 °C for 15 min. In the meantime, begin to prepare the magnetic beads (see Section 3.2.1).
Transfer supernatant to a new 15 ml centrifuge tube. Discard the pellet.
Add RNase T1 to a final concentration of 1 U/μl and incubate at 22 °C for 15 min. Cool reaction subsequently for 5 min on ice before proceeding (see Note 10).
Keep a 100 μl aliquot of cell lysate and store at −20 °C to control for RBP expression in Subheading 3.2.4.
See Note 11 for guidelines on handling and washing of magnetic beads.
3.2 Immunoprecipitation and Recovery of Crosslinked Target RNA Fragments
3.2.1 Preparation of Magnetic Beads
Transfer 20 μl of Protein G magnetic beads per ml of cell lysate to a 1.5 ml microcentrifuge tube (for a typical experiment, 120–200 μl of beads) (see Note 12).
Wash beads twice in 1 ml of PBS.
Resuspend beads in twice the volume of PBS relative to the original bead volume aliquotted.
Add 0.25 mg of antibody per ml original bead volume and incubate on a rotating wheel for 40 min at room temperature.
Wash beads twice in 1 ml of PBS to remove unbound antibody.
Resuspend beads in one original bead volume of PBS.
3.2.2 Immunoprecipitation (IP), Second RNase T1 Digestion, and Dephosphorylation
Add 20 μl of freshly prepared antibody-conjugated magnetic beads per 1 ml of partial RNase T1-treated cell lysate (from Subheading 3.1.3, step 4) and incubate in 15 ml centrifuge tubes on a rotating wheel for 1 h at 4 °C.
Collect magnetic beads on a magnetic particle collector for 15 ml centrifuge tubes.
Keep a 100 μl aliquot of supernatant and store at −20 °C to control for RBP depletion in Subheading 3.2.4. Discard the remaining supernatant.
Add 1 ml of 1× NP40 lysis buffer to the centrifugation tube and transfer the suspension to a 1.5 ml microcentrifuge tube (see Note 13).
Wash beads twice in 1 ml of 1× NP40 lysis buffer.
Take up cells in one original bead volume of 1× NP40 lysis buffer.
Add RNase T1 to a final concentration of 1 U/μl and incubate the bead suspension at 22 °C for 15 min. Cool subsequently on ice for 5 min.
Wash beads twice in 1 ml of 1× NP40 lysis buffer (see Note 14).
Wash beads twice in 400 μl of dephosphorylation buffer.
Resuspend beads in 1 original bead volume of dephosphorylation buffer.
Add calf intestinal alkaline phosphatase to a final concentration of 0.5 U/μl and incubate the suspension at 37 °C for 10 min.
Wash beads twice in 1 ml of 1× NP40 lysis buffer.
Wash beads twice in 1 ml of polynucleotide kinase (PNK) buffer without DTT (see Note 15).
Resuspend beads in 1 original bead volume of PNK buffer with DTT.
3.2.3 Radiolabeling of RNA Segments Crosslinked to Immunoprecipitated Proteins
To the bead suspension described above, add T4 polynucleotide kinase to 1 U/μl and γ-32P-ATP to a final concentration of 0.5 μCi/μl (1.6 μM ATP) in one original bead volume. Incubate at 37 °C for 30 min.
Add nonradioactive ATP to obtain a final concentration of 100 μM and incubate at 37 °C for another 5 min.
Wash magnetic beads five times with 800 μl of PNK buffer without DTT. Store a 100 μL aliquot of radioactive wash waste for use as radioactive markers in future steps.
Resuspend the beads in 70 μl of SDS-PAGE loading buffer and incubate for 5 min in a heat block at 95 °C to denature and release the immunoprecipitated RNPs. Vortex and centrifuge briefly.
Remove the magnetic beads on the magnetic separator and transfer the supernatant (i.e., radiolabeled RNP immunoprecipitate) to a clean 1.5 ml microcentrifuge tube.
Stopping point
The sample can be stored at −20 °C for a prolonged period of time. However, the half-life of 32P half life is 14.5 days, and we therefore recommend continuing with the protocol within 2 weeks.
3.2.4 SDS Polyacrylamide Gel Electrophoresis, Transfer, and Recovery of RNA from Nitrocellulose Membrane
-
1
Prepare a 4–12 % Bis-Tris polyacrylamide gel. We recommend using the first half of the gel for separation of the radiolabeled RNP IP and the second half for immunoblotting to control for RBP expression and IP efficiency. In the first half of the gel, load 40 μl of the radiolabeled RNP IP per well. Each RNP IP sample should be loaded adjacent to a ladder and there should be at least one lane distance between different samples. In the second half of the gel, load 10 μL of cell lysate (from Subheading 3.1.3, step 5), 10 μL supernatant (from Subheading 3.2.2, step 3), and 2 μl of the radiolabeled IP.
-
2
Run the gel at 200 V for 40 min.
-
3
Using semidry blotting, transfer proteins onto a 0.45 μm nitrocellulose membrane in 1× transfer buffer at 2 mA/cm2 current for 1 h.
-
4
Using a scalpel or razor blade, split the nitrocellulose membrane in two, separating the RNP IP samples from the samples for immunoblotting. Proceed to step 5 with the RNP IP samples. With the lanes for testing IP and RBP expression, perform a Western blot to probe for your RBP or RBP-tag.
-
5
Label three corners of the membrane and each band of the protein length marker with 1 μl of radioactive wash waste from Subheading 3.2.3, step 3. Wrap the membrane in plastic film (e.g., Saran wrap) to avoid contamination of the phosphorimager screen.
-
6
Expose the membrane to a blanked phosphorimager screen for 1 h at room temperature and visualize on a phosphorimager. If the radioactivity of the recovered RNP is weak, you can expose the membrane for longer.
Stopping point
The membrane can be stored at −20 °C for a prolonged period of time.
-
7
Print the image from the phosphorimager onto an overhead projector transparency film; make sure the image is scaled to 100 % for printing. Align the transparency film printout on top of the membrane using the labeled corners for orientation.
-
8
Cutting through the transparency and the membrane directly beneath, excise the bands on the nitrocellulose membrane that correspond to the expected size of the RBP.
-
9
Cut the nitrocellulose excisions further by slicing them into ~5 smaller pieces. Transfer the pieces into a 1.5 ml low adhesion tube (e.g., siliconized or DNA LoBind tubes).
3.2.5 Proteinase K Digestion
Add 400 μl of 1× Proteinase K buffer to the nitrocellulose pieces followed by the addition of approximately 2 mg Proteinase K. Vortex, briefly centrifuge, and incubate at 55 °C for 1 h 30 min.
Extract the RNA by addition of 2 volumes of acidic phenol–chloroform–IAA (25:24:1, pH 4.0) directly to the Proteinase K digestion. Vortex for 15 s and centrifuge at >14,000 × g at 4 °C for 5 min. Remove the aqueous phase without disturbing the organic phase or interphase, and transfer the aqueous phase to a new 1.5 ml low adhesion microcentrifuge tube. If the organic or interphase is accidentally disturbed, centrifuge the sample again and reattempt.
Add 1 volume of chloroform to the recovered aqueous phase to remove residual phenol. Vortex for 15 s and centrifuge at >14,000 × g at 4 °C for 5 min. Remove the aqueous phase without disturbing the organic phase, and transfer the aqueous phase to a new 1.5 ml low adhesion microcentrifuge tube.
To the isolated aqueous phase, add 1/10 volume of 3 M NaCl, 1 μl 15 mg/ml GlycoBlue, and 3 volumes of 100 % ethanol. Mix thoroughly by inverting the tube at least five times and incubate at −20 °C or −80 °C for 20 min. Proceed to cDNA library preparation,
Stopping point
If kept at −20 °C, RNA can be safely stored for several months as an ethanol precipitate.
3.3 cDNA Library Preparation and Deep Sequencing
The following section describes the standard small RNA cDNA library preparation protocol described for cloning of small regulatory RNAs, found in ref. 16. Before generating the small cDNA libraries following the steps described below, we strongly recommend reading this protocol. The main differences in the procedure described here are: (a) the use of a non-barcoded 3′ adapter, (b) no spike-in of radioactive RNA size markers, and (c) no spike-in of calibrator oligoribonucleotides.
See Note 16 for general guidelines for the cDNA library preparation.
3.3.1 3′ Adapter Ligation
- Prepare 5′-32P-labeled RNA size marker cocktail. Use of the size markers will control for successful ligation and indicate the length of the bands that need to be cut out of the gel.
- Prepare a 20-well, 15 % denaturing polyacrylamide gel (15 cm wide, 17 cm long, 0.5 mm thick; 25 mL gel solution).
- Pre-run the gel for 30 min at 30 W using 1× TBE buffer. While the gel is pre-running move on to point 3 of step 1.
- Radiolabel the size markers individually in a 10 μl reaction containing 1 μM RNA, 10 U T4 polynucleotide kinase, and 50 μCi γ-32P-ATP at 37 °C for 15 min
- Quench the reactions from point 1 of step 1 by adding 10 μl of denaturing formamide gel loading solution to each reaction.
- Denature the RNA by incubating the tubes for 1 min at 90 °C.
- Load each sample into one well of the 15 % denaturing polyacrylamide gel. In order to avoid cross-contamination, make sure to space the size markers with a minimum 2-well distance from each other.
- Run the gel for 50 min at 30 W using 1× TBE buffer, until the bromophenol blue dye is close to the bottom of the gel.
- Dismantle the gel, leaving it mounted on one glass plate. Using a scalpel or razor blade, cut crosses of approx. 1 cm length in three corners of the gel. Into these crosses, pipette 1 μl of the radioactive waste (stored in Subheading 3.2.3, step 3) to facilitate alignment of the gel to the phosphorimager paper printout. Wrap the gel in plastic film (e.g., Saran wrap) to avoid contamination of the phosphorimager screen.
- Expose the gel for 5 min to a phosphorimager screen at −20 °C.
- Align the gel on top of a printout scaled to 100 % according to the position of the three spots of radioactive waste. Cut out the radioactive bands corresponding to the length marker.
- Place the gel slices in 1.5 ml low adhesion microcentrifuge tubes and cover in 0.3 M NaCl (>300 μl). Elute the ligation product into the NaCl using constant agitation at 4 °C overnight (a rotating wheel works well).
- The following day, take off the supernatant, add 1 μl 15 mg/ml GlycoBlue, mix well, and follow with addition of 3 volumes of 100 % ethanol. Mix thoroughly by inverting the tube at least five times and incubate at −20 °C or −80 °C for 20 min.
- Centrifuge the precipitated RNA at >14,000 × g at 4 °C for 30 min.
- Remove the supernatant completely without disturbing the pellets. Air-dry the pellets for 10 min.
- Resuspend the pellets in 10 μl water and combine the solutions to obtain the concentrated size marker cocktail.
- Transfer 1 μl of this cocktail to a new low adhesion tube and dilute it 1:50 in water to obtain the diluted size marker cocktail. Mix by pipetting up and down several times.
- 10 μl of this diluted size marker cocktail will be used in point 3 of step 1. Store the remaining diluted and concentrated size marker cocktail at −20 °C for future PAR-CLIPs. One preparation of concentrated size marker cocktail can be used for multiple experiments. When diluting the size marker cocktail in future experiments take into account the 14.5 day half life of 32P.
Spin sample from Subheading 3.2.5, step 4 at >14,000 × g at 4 °C for 20 min. A blue pellet should be visible at the bottom of the tube.
Remove the supernatant completely without disturbing the pellet. Air-dry the pellet for 10 min.
Resuspend the pellet in 10 μl water.
- Prepare the following reaction mixture for ligation of the adenylated 3′ adapter, multiplying the volumes by number of ligation reactions to be performed plus 2 extra volumes to include the diluted radioactive RNA size marker cocktail and to account for pipetting error:
-
–2 μl 10× RNA ligase buffer without ATP
-
–6 μl 50 % aqueous DMSO
-
–1 μl 100 μM adenylated 3′ adapter oligonucleotide
-
–
Add 9 μl of the reaction mixture to each sample, including the 10 μl of diluted radioactive RNA size marker cocktail.
Denature the RNA by incubating the tubes for 1 min at 90 °C. Immediately place the tubes on ice and incubate for 2 min.
Add 1 μl of Rnl2(1-249)K227Q ligase (1 μg/μl), swirl gently with your pipette tip, and incubate the tubes overnight on ice at 4 °C
Prepare a 20-well, 15 % denaturing polyacrylamide gel (15 cm wide, 17 cm long, 0.5 mm thick; 25 mL gel solution).
Pre-run the gel for 30 min at 30 W using 1× TBE buffer.
Add 20 μL of formamide gel loading solution to each 3′ adapter ligation reaction.
Denature the RNA by incubating the tubes for 1 min at 90 °C.
Load each sample into one well of the 15 % denaturing polyacrylamide gel. In order to avoid cross-contamination, make sure to space different samples appropriately; we recommend a two well distance.
Split the marker reaction, loading one half on opposite ends of the gel to frame the PAR-CLIP samples. Once again, avoid cross-contamination by keeping a two-well distance between samples and markers.
Run the gel for 45 min at 30 W using 1× TBE buffer, until the bromophenol blue dye is close to the bottom of the gel.
Dismantle the gel, leaving it mounted on one glass plate. Using a scalpel or razor blade, cut crosses of approximately 1 cm length in three corners of the gel. Into these crosses, pipette 1 μl of the radioactive waste (stored in Subheading 3.2.3, step 3) to facilitate alignment of the gel to the phosphorimager paper printout. Wrap the gel in plastic film (e.g., Saran wrap) to avoid contamination of the phosphorimager screen.
Expose the gel for at least 1 h to a phosphorimager screen, keeping the cassette at −20 °C to prevent diffusion of RNA. If the radioactivity of the recovered RNA is weak, you can expose the gel overnight at −20 °C.
Align the gel on top of a printout scaled to 100 % according to the position of the three spots of radioactive waste. The 3′-ligated 19 and 35 nt markers should be visible on the printout, possibly with two additional lower bands representing unligated 19 and 35 nt marker. Using the ligated markers as guides, cut out sample RNA of 19–35 nt length, ligated to the 3′ adapter. Cut out the ligated markers as well (see Note 17).
Place the gel slices in separate 1.5 ml low adhesion microcentrifuge tubes and cover in 0.3 M NaCl (>300 μl). Elute the ligation product into the NaCl using constant agitation at 4 °C overnight (a rotating wheel works well).
The following day, take off the supernatant, add 1 μl 15 mg/ml GlycoBlue, mix well, and follow with addition of 3 volumes of 100 % ethanol. Mix thoroughly by inverting the tube at least five times and incubate at −20 °C or −80 °C for 20 min.
Stopping point
If kept at −20 °C, RNA can be safely stored for several months as an ethanol precipitate.
3.3.2 5′ Adapter Ligation
Centrifuge the precipitated RNA at >14,000 × g at 4 °C for 30 min. A blue pellet should be visible at the bottom of the tubes.
Remove the supernatant completely without disturbing the pellet. Air-dry the pellet for 10 min.
Resuspend the pellet in 9 μl water.
- Prepare the following reaction mixture for ligation of the 5′ adapter, multiplying the volumes by number of ligation reactions to be performed plus 2 extra volumes to include the RNA size markers and to account for pipetting errors:
-
–2 μl 10× RNA ligase buffer with ATP
-
–6 μl 50 % aqueous DMSO
-
–1 μl 100 μM 5′ adapter oligonucleotide
-
–
Add 9 μl of the reaction mixture to each sample, including the 3′-ligated radioactive RNA size markers.
Denature the RNA by incubating the tubes for 1 min at 90 °C. Immediately place the tubes on ice and incubate for 2 min.
Add 2 μl T4 RNA ligase, swirl gently with your pipette tip, and incubate for 1 h at 37 °C. While the samples are incubating, prepare the polyacrylamide gel.
Prepare a 20-well, 12 % denaturing polyacrylamide gel (15 cm wide, 17 cm long, 0.5 mm thick; 25 mL gel solution).
Pre-run the gel for 30 min at 30 W using 1× TBE buffer.
Add 20 μL of formamide gel loading solution to each 5′ adapter ligation reaction.
Denature the RNA by incubating the tubes for 1 min at 90 °C.
Load the gel as described in Subheading 3.3.1, steps 10 and 11, and run for 45 min at 30 W using 1× TBE buffer, until the bromophenol blue dye is close to the bottom of the gel.
Image the gel as described in Subheading 3.3.1, steps 13 and 14, and excise the new ligation product (see Note 18).
Place the gel slices in 1.5 ml low adhesion microcentrifuge tubes and cover in 0.3 M NaCl (>300 μl). Elute the ligation product into the NaCl using constant agitation at 4 °C overnight (a rotating wheel works well).
The following day, take off the supernatant, add 1 μl 15 mg/ml GlycoBlue, mix well, and follow with addition of 3 volumes of 100 % ethanol. Mix thoroughly by inverting the tube at least five times and incubate at −20 °C or −80 °C for 20 min.
Stopping point
If kept at −20 °C, RNA can be safely stored for several months as an ethanol precipitate.
3.3.3 Reverse Transcription
Centrifuge the precipitated RNA at >14,000 × g at 4 °C for 30 min. A blue pellet should be visible at the bottom of the tubes.
Remove the supernatant completely without disturbing the pellet and allow the pellet to air-dry for 10 min.
Resuspend the pellet in 4.6 μl water and transfer to a thermocycler tube.
- Prepare the following reaction mixture for reverse transcription, multiplying the volumes by number of reverse transcription reactions to be performed plus 1 extra volume to account for pipetting errors:
-
–1.5 μl 0.1 M DTT
-
–3 μl 5× first-strand synthesis buffer
-
–4.2 μl 10× dNTPs
-
–1 μl 100 μM 3′ primer
-
–
Before addition of the reaction mixture, denature the RNA by incubating the tubes for 30 s at 90 °C in a thermocycler, and then hold at 50 °C.
Add 9.7 μL of the reaction mix to each sample and incubate for 3 min at 50 °C. Add 0.75 μl of Superscript III reverse transcriptase, mix gently by flicking the tube twice and incubate for 2 h at 50 °C.
Add 85 μl water and mix well.
Stopping point
cDNA can be stored indefinitely at −20 °C.
3.3.4 PCR Amplification
- Prepare the following mix multiplied by the number of samples:
-
–40 μl 10× PCR buffer
-
–40 μl 10× dNTPs
-
–2 μl 100 μM 5′ primer
-
–2 μl 100 μM 3′ primer
-
–272 μl water
-
–89 μl of the reaction mix will be used in a pilot PCR reaction to determine the optimal number of PCR cycles for amplification, and the remaining mixture will be used for a large scale PCR.
-
–
To 89 μl of the reaction mix add 10 μl from the cDNA solution and 1 μl of Taq polymerase.
Perform a standard 100 μl, 30 cycle PCR with the following conditions: 45 s at 94 °C, 85 s at 50 °C, 60 s at 72 °C.
Beginning with the 12th cycle and ending with the 30th cycle, remove a 10 μl aliquot from each PCR reaction every 3 cycles (i.e., at cycles 12, 15, 18, etc.).
Analyze the 10 μl aliquots on a 2.5 % agarose gel alongside a 25 bp ladder. The expected PCR product should appear between 95 and 110 bp. When ligated and amplified with the correct primers, the 19 and 35 nt markers appear at 95 and 110 bp respectively. Often, a lower band appears at 72 bp corresponding to the direct ligation products of the 3′ and 5′ adapters. Define the optimal cycle number for cDNA amplification, which should be within the exponential amplification phase of the PCR, approximately 5 cycles away from reaching the saturation level of PCR amplification (see Note 19).
Using the remaining PCR cocktail, perform three 100 μl PCR reactions with the optimal cycle number identified above.
Combine the individual 100 μl reactions and precipitate with 3 volumes of 100 % ethanol.
Take up the pellet in 60 μl 1× DNA loading dye.
Run the sample on two wells of a 2.5 % agarose gel alongside a 25 bp ladder.
Visualize the DNA on a UV transilluminator and excise the gel piece containing cDNA between 85 and 120 bp of length.
Extract the DNA using the Qiagen MinElute Gel Extraction Kit, following the instructions of the manufacturer. Use 30 μl elution buffer to recover the DNA.
Submit 10 μl of the purified cDNA to Illumina sequencing. We recommend using 50 cycle single-end sequencing on a HiSeq machine.
3.3.5 Optional: Determination of Incorporation Levels of 4-Thiouridine into Total RNA
Supplement growth medium with 100 μM of 4SU 16 h prior to harvest, provide regular media to one control plate.
The following day, harvest cells using a cell scraper and spin down at 500 × g for 5 min at 4 °C.
Remove supernatant and resuspend the pellet in 3 volumes of TrIzol reagent (Sigma), follow the manufacturer’s instructions.
Further purify total RNA using Qiagen RNAeasy according to the manufacturer’s instructions (see Note 20).
Digest and dephosphorylate total RNA to single nucleosides by incubating 40 μg of purified total RNA for 16 h at 37 °C with 0.4 U bacterial alkaline phosphatase (e.g., Worthington Biochemical) and 0.09 U snake venom phosphodiesterase (e.g., Worthington Biochemical) in a 30 μl volume.
As a reference standard, use a synthetic 4SU labeled RNA (previously we used CGUACGCGGAAUACUUCGA(4SU)U), which is subjected to complete enzymatic digestion.
Separate the resulting mixtures of ribonucleosides by HPLC on a Supelco Discovery C18 (bonded phase silica 5 μM particle, 250 × 4.6 mm) reverse phase column (Bellefont). HPLC buffers are 0.1 M triethylammonium acetate (TEAA) in 3 % acetonitrile (A) and 90 % acetonitrile in 0.1 M TEAA (B).
Use an isocratic gradient: 0 % B for 15 min, 0–10 % B for 20 min, 10–100 % B for 30 min.
Clean HPLC column with a 5 min 100 % wash between runs.
3.4 PAR-CLIP Analysis
With current depths of Illumina sequencing reaching >200 million sequence reads per sample, PAR-CLIP data analysis requires sophisticated approaches to identify binding sites [17]. Several biocomputational pipelines for PAR-CLIP data analysis have been made available, including PARalyzer [18], PIPE-CLIP [19], WavclusteR [20], doRina [21], CLIPZ [22], Starbase [23], miRTarCLIP [24], Piranha [25], and dCLIP [26]. After initial analysis, you may calculate the common sequence motifs of the RRE using one of the several programs initially developed for the analysis of transcription-factor binding sites on DNA, including MEME [27], MDScan [28], PhyloGibbs [29], cERMIT [30], and Gimsan [31].
Generally, the analysis of the sequence reads begins by alignment to the genome, allowing for at least one error (substitution, insertion, or deletion) to capture cross-linked reads with cross-linking-induced mutations. Next, overlapping sequence reads are grouped, taking into account the frequency of cross-linking-induced mutations. To allow insights into the RBP’s binding preferences, these groups of overlapping sequence reads can then be mapped against the transcriptome to annotate and categorize them as derived from 5′ untranslated region (UTR), coding sequence (CDS), 3′ UTR, introns, rRNA, long noncoding RNAs, tRNAs, and so forth.
The frequency of the T-to-C mutations (or G-to-A mutations when using 6SG) allows ranking of groups to predict those interactions with the highest functional impact. In addition, it may be useful to provide a limited set of high-confidence interaction sites as input into motif-finding programs to facilitate the detection of the underlying RRE. Some of the analysis pipelines, such as PARalyzer, take advantage of the frequency and distribution of cross-linking-induced mutations to predict the shortest possible region of interaction between RBP and RNA that harbors the RRE.
CLIP-based approaches provide a genome-wide view of the protein–RNA interaction sites and routinely identify tens of thousands of interaction sites in the transcriptome. However, additional experimentation—as well as clear ranking of binding sites—is necessary to relate RNA binding to phenotypes arising from knockout, overexpression, or mutation of the RBP. For example, the effect of RNA binding on transcript stability and alternative splicing can be assayed using microarray analysis and RNA sequencing analysis. Quantitative proteomics (SILAC, iTRAQ) and ribosome profiling are increasingly available as methods to assess translational regulation by RBPs [32]. Analysis of RBPs involved in RNA transport and other processes may require the development of more specialized assays.
Footnotes
For NP40 Lysis Buffer prepare a stock of 5× buffer without DTT and protease inhibitors. Add DTT and protease inhibitor to 1× buffer directly before use.
Not every antibody will retain its binding ability in 500 mM KCl—adjust the salt concentration accordingly for the high salt wash buffer. If in doubt use lysis buffer for washing. Also add DTT and protease inhibitor directly to high salt wash buffer before experiment.
This protocol describes the procedure for analysis of endogenously expressed, or recombinant constitutively expressed, or inducibly expressed RBPs. The PAR-CLIP protocol will work with any cell line expressing detectable levels of RBP as long as there is an efficient antibody for immunoprecipitation (IP). However, some antibody quality testing is necessary before beginning PAR-CLIP. If using an antibody that specifically recognizes your RBP-of-interest, perform stringent quality testing of the IP with your antibody before attempting PAR-CLIP. We recommend transiently transfecting the cells with a vector for expression of the protein of interest with an N-terminal or C-terminal epitope fusion, such as FLAG, MYC, or HA. Follow transfection with IP using an RBP-specific antibody and Western blotting for the epitope tag using reliable commercial antibodies. At this time you should also test for the maximal monovalent salt concentration compatible with your IP. Increasing salt concentration will result in fewer co-purifying proteins and RNAs but can also lead to loss of bound RNP. For reference, the FLAG antibody tolerates up to 500 mM KCl.
Guidelines for the use of 4-thiouridine (4SU) may need to be adapted for use in the desired cell lines or model organisms; the concentration of 4SU and the length of UV-light exposure in this protocol were optimized for HEK293 cells. For other cell lines, the user may want to determine the optimal, nontoxic 4SU concentration and labeling time. In cell lines or model organisms with weak 4SU uptake, it may be necessary to enhance or introduce expression of nucleoside transporters, such as uracil phophoribosyltransferase (UPRT) [33, 34]. We have also included an optional section at the end of the PAR-CLIP procedure for determining the incorporation of 4SU into total RNA. The energy dose of UV light necessary for cross-linking may vary due to differing transparency of the sample compared to mammalian cells grown in monolayers. For example, cells plated as dense suspensions, yeast, and worms exhibit higher opacity [35].
We recommend use of positive and negative controls, particularly when performing the pilot PAR-CLIP experiments. An appropriate negative control could comprise the use of IgG isotype control as a substitute for the RBP antibody; this will allow the user to visualize fragments of abundant cellular RNAs, as well as RNPs co-purifying through nonspecific interactions with antibodies and magnetic beads (Thermo Scientific MA1-10407). For a positive control, plasmids encoding FLAG/HA-tagged RBPs previously characterized by PAR-CLIP are available on www.addgene.org.
The on-bead RNase T1 digestion described in Subheading 3.2.2, step 7 should be optimized for your individual RBP. Each RBP binding footprint provides a different level of protection from RNase T1, resulting in shorter or longer RNA fragments after the RNA is isolated by Proteinase K digestion. RNA fragments between 19 and 35 nt are ideal for small cDNA library preparation. Fragments shorter than 19 nt have a higher probability of mismapping compared to longer reads. Fragments longer than 35 nt cannot be fully sequenced by standard 50 base single-end sequencing. The concentration of RNase T1 suggested in this protocol may be too high for certain RBPs, resulting in RNA less than 19 nt long. To determine the correct concentration of RNase T1 for the on-bead RNase T1 digestion, perform the PAR-CLIP protocol through Subheading 2. When you reach Subheading 3.2.2, step 7, perform a set of separate digestions with RNase T1 concentrations ranging from 0 to 100 U/μl. After Subheading 2 is complete, analyze the resulting RNA on a denaturing polyacrylamide gel as described in Subheading 3.3.1, steps 10–16. If the majority of RNA is below 19 nt, over-digestion has occurred and the RNase T1 concentration must be reduced appropriately.
Use low adhesion microcentrifuge tubes (e.g., siliconized or DNA LoBind tubes) for all manipulations of the small RNAs after the Proteinase K digestion. The minute amounts of small RNAs to be recovered after RNA isolation will readily adsorb to the walls of standard tubes.
It is also possible to use 100 μM of 6-thioguanine (6SG) as the photoactivatable ribonucleoside. 6SG has a lower cross-linking efficiency compared to 4SU and will result in a G-to-A mutation instead of a T-to-C mutation at the cross-linking site.
A thin film of remaining media helps prevent cells from drying, and does not interfere with cross-linking.
Incubation at room temperature is also sufficient if there are no means of incubation at 22 °C.
-
–Before pipetting beads from the source container, always mix thoroughly by shaking or vortexing.
-
–To prevent drying and loss of function, do not leave beads uncovered for prolonged periods of time
- Place the beads in suspension on a magnetic separator and let stand for 1 min or until solution clears.
- Carefully remove buffer from the tube without disturbing the beads.
- Add buffer to the tube while the tube is on the magnetic separator.
- Remove the tube from the magnetic separator and resuspend the beads either by flicking, shaking, or vortexing. To prevent loss of beads, we do not recommend mixing by pipetting.
- Briefly centrifuge the tube to collect beads caught on the tube cap.
- Place the beads in suspension on a magnetic separator and let stand for 1 min or until solution clears.
- Remove the supernatant and resuspend in the appropriate buffer, or repeat steps 1–5 for additional wash steps.
For small volumes of lysate do not use less than 35 μl of magnetic beads to account for minor loss during handling.
Make sure that you do not exceed the maximum salt concentration at which the antibody recognizes its antigen.
Optional: Reduce IP background by performing a high salt wash. Replace 1× NP40 lysis buffer with 1× high salt wash buffer. Only perform this step if you are confident you will not exceed the maximum salt concentration at which the antibody recognizes its antigen.
To avoid bead damage, do not expose magnetic beads to high DTT concentration for prolonged time.
Take care to avoid contamination of the minute amounts of RNA, e.g., with RNases. Use RNAse-free water and store RNA at −20 or −80 °C. Previously prepared cDNA libraries may contaminate lab surfaces and equipment and will readily amplify during PCR. Use sterile filter tips wherever possible.
Avoid recovering RNA <19 nt, which have the potential to complicate the subsequent bioinformatics analysis, as they have a higher probability of mismapping compared to longer reads.
Optional: Excise the markers and keep them as controls for the reverse transcription and PCR.
As the PCR reaction approaches saturation of PCR product, reagents within the reaction become limiting, leading to selective amplification of certain transcripts over others.
It is important to add 0.1 mM dithiothreitol (DTT) to wash buffers and subsequent enzymatic steps to prevent oxidization of 4SU during RNA isolation and analysis.
References
- 1.Sonenberg N, Hinnebusch AG. Regulation of translation initiation in eukaryotes: mechanisms and biological targets. Cell. 2009;136:731–745. doi: 10.1016/j.cell.2009.01.042. [DOI] [PMC free article] [PubMed] [Google Scholar]
- 2.Moore MJ, Proudfoot NJ. Pre-mRNA processing reaches back to transcription and ahead to translation. Cell. 2009;136:688–700. doi: 10.1016/j.cell.2009.02.001. [DOI] [PubMed] [Google Scholar]
- 3.Martin KC, Ephrussi A. mRNA localization: gene expression in the spatial dimension. Cell. 2009;136:719–730. doi: 10.1016/j.cell.2009.01.044. [DOI] [PMC free article] [PubMed] [Google Scholar]
- 4.Cech TR, Steitz JA. The noncoding RNA revolution-trashing old rules to forge new ones. Cell. 2014;157:77–94. doi: 10.1016/j.cell.2014.03.008. [DOI] [PubMed] [Google Scholar]
- 5.Lukong KE, Chang K-W, Khandjian EW, Richard S. RNA-binding proteins in human genetic disease. Trends Genet. 2008;24:416–425. doi: 10.1016/j.tig.2008.05.004. [DOI] [PubMed] [Google Scholar]
- 6.Cooper TA, Wan L, Dreyfuss G. RNA and disease. Cell. 2009;136:777–793. doi: 10.1016/j.cell.2009.02.011. [DOI] [PMC free article] [PubMed] [Google Scholar]
- 7.Castello A, Fischer B, Hentze MW, Preiss T. RNA-binding proteins in Mendelian disease. Trends Genet. 2013;29:318–327. doi: 10.1016/j.tig.2013.01.004. [DOI] [PubMed] [Google Scholar]
- 8.Gerstberger S, Hafner M, Tuschl T. A census of human RNA-binding proteins. Nat Rev Genet. 2014;15:829–845. doi: 10.1038/nrg3813. [DOI] [PMC free article] [PubMed] [Google Scholar]
- 9.König J, Zarnack K, Luscombe NM, Ule J. Protein-RNA interactions: new genomic technologies and perspectives. Nat Publ Group. 2011;13:77–83. doi: 10.1038/nrg3141. [DOI] [PubMed] [Google Scholar]
- 10.Tenenbaum SA, Carson CC, Lager PJ, Keene JD. Identifying mRNA subsets in messenger ribonucleoprotein complexes by using cDNA arrays. Proc Natl Acad Sci U S A. 2000;97:14085–14090. doi: 10.1073/pnas.97.26.14085. [DOI] [PMC free article] [PubMed] [Google Scholar]
- 11.Gilbert C, Svejstrup JQ. RNA immunoprecipitation for determining RNA-protein associations in vivo. Curr Protoc Mol Biol. 2006 doi: 10.1002/0471142727.mb2704s75. Chapter 27, Unit 27.4–27.4.11. [DOI] [PubMed] [Google Scholar]
- 12.Gerber AP, Luschnig S, Krasnow MA, et al. Genome-wide identification of mRNAs associated with the translational regulator PUMILIO in Drosophila melanogaster. Proc Natl Acad Sci U S A. 2006;103:4487–4492. doi: 10.1073/pnas.0509260103. [DOI] [PMC free article] [PubMed] [Google Scholar]
- 13.López de Silanes I, Zhan M, Lal A, et al. Identification of a target RNA motif for RNA-binding protein HuR. Proc Natl Acad Sci U S A. 2004;101:2987–2992. doi: 10.1073/pnas.0306453101. [DOI] [PMC free article] [PubMed] [Google Scholar]
- 14.Maes OC, Chertkow HM, Wang E, Schipper HM. MicroRNA: implications for Alzheimer disease and other human CNS disorders. Curr Genomics. 2009;10:154–168. doi: 10.2174/138920209788185252. [DOI] [PMC free article] [PubMed] [Google Scholar]
- 15.Hafner M, Landthaler M, Burger L, et al. Transcriptome-wide identification of RNA-binding protein and microRNA target sites by PAR-CLIP. Cell. 2010;141:129–141. doi: 10.1016/j.cell.2010.03.009. [DOI] [PMC free article] [PubMed] [Google Scholar]
- 16.Hafner M, Renwick N, Farazi TA, et al. Barcoded cDNA library preparation for small RNA profiling by next-generation sequencing. Methods. 2012;58:164–170. doi: 10.1016/j.ymeth.2012.07.030. [DOI] [PMC free article] [PubMed] [Google Scholar]
- 17.Ascano M, Hafner M, Cekan P, et al. Identification of RNA-protein interaction networks using PAR-CLIP. WIREs Interdiscip Rev RNA. 2011;3:159–177. doi: 10.1002/wrna.1103. [DOI] [PMC free article] [PubMed] [Google Scholar]
- 18.Corcorabin DL, Georgiev S, Mukherjee N, et al. PARalyzer: definition of RNAding sites from PAR-CLIP short-read sequence data. Genome Biol. 2011;12:R79. doi: 10.1186/gb-2011-12-8-r79. [DOI] [PMC free article] [PubMed] [Google Scholar]
- 19.Chen B, Yun J, Kim MS, et al. PIPE-CLIP: a comprehensive online tool for CLIP-seq data analysis. Genome Biol. 2014;15:1–10. doi: 10.1186/gb-2014-15-1-r18. [DOI] [PMC free article] [PubMed] [Google Scholar]
- 20.Sievers C, Schlumpf T, Sawarkar R, Comoglio F, Paro R. Mixture models and wavelet transforms reveal high confidence RNA-protein interaction sites in MOV10 PAR-CLIP data. Nucleic Acids Res. 2012;40(2):160. doi: 10.1093/nar/gks697. [DOI] [PMC free article] [PubMed] [Google Scholar]
- 21.Anders G, Mackowiak SD, Jens M, et al. doRiNA: a database of RNA interactions in post-transcriptional regulation. Nucleic Acids Res. 2012;40:D180–D186. doi: 10.1093/nar/gkr1007. [DOI] [PMC free article] [PubMed] [Google Scholar]
- 22.Khorshid M, Rodak C, Zavolan M. CLIPZ: a database and analysis environment for experimentally determined binding sites of RNA-binding proteins. Nucleic Acids Res. 2011;39:D245–D252. doi: 10.1093/nar/gkq940. [DOI] [PMC free article] [PubMed] [Google Scholar]
- 23.Yang JH, Li JH, Shao P, et al. starBase: a database for exploring microRNA-mRNA interaction maps from Argonaute CLIP-Seq and Degradome-Seq data. Nucleic Acids Res. 2011;39:D202–D209. doi: 10.1093/nar/gkq1056. [DOI] [PMC free article] [PubMed] [Google Scholar]
- 24.Chou CH, Lin FM, Chou MT, et al. A computational approach for identifying microRNA-target interactions using high-throughput CLIP and PAR-CLIP sequencing. BMC Genomics. 2013;14(Suppl 1):S2. doi: 10.1186/1471-2164-14-S1-S2. [DOI] [PMC free article] [PubMed] [Google Scholar]
- 25.Uren PJ, Bahrami-Samani E, Burns SC, et al. Site identification in high-throughput RNA-protein interaction data. Bioinformatics. 2012;28:3013–3020. doi: 10.1093/bioinformatics/bts569. [DOI] [PMC free article] [PubMed] [Google Scholar]
- 26.Wang T, Xie Y, Xiao G. dCLIP: a computational approach for comparative CLIP-seq analyses. Genome Biol. 2014;15:R11. doi: 10.1186/gb-2014-15-1-r11. [DOI] [PMC free article] [PubMed] [Google Scholar]
- 27.Bailey TL. Discovering novel sequence motifs with MEME. Curr Protoc Bioinformatics. 2002 doi: 10.1002/0471250953.bi0204s00. Chapter 2, Unit 2.4–2.4.35. [DOI] [PubMed] [Google Scholar]
- 28.Liu XS, Brutlag DL, Liu JS. An algorithm for finding protein–DNA binding sites with applications to chromatin-immunoprecipitation microarray experiments. Nat Biotechnol. 2002;20:835–839. doi: 10.1038/nbt717. [DOI] [PubMed] [Google Scholar]
- 29.Siddharthan R, Siggia ED, van Nimwegen E. PhyloGibbs: a Gibbs sampling motif finder that incorporates phylogeny. PLoS Comput Biol. 2005;1:e67. doi: 10.1371/journal.pcbi.0010067. [DOI] [PMC free article] [PubMed] [Google Scholar]
- 30.Georgiev S, Boyle AP, Jayasurya K, et al. Evidence-ranked motif identification. Genome Biol. 2010;11:R19. doi: 10.1186/gb-2010-11-2-r19. [DOI] [PMC free article] [PubMed] [Google Scholar]
- 31.Ng P, Keich U. GIMSAN: a Gibbs motif finder with significance analysis. Bioinformatics. 2008;24:2256–2257. doi: 10.1093/bioinformatics/btn408. [DOI] [PubMed] [Google Scholar]
- 32.Brewis IA, Brennan P. Proteomics technologies for the global identification and quantification of proteins. Adv Protein Chem Struct Biol. 2010;80:1–44. doi: 10.1016/B978-0-12-381264-3.00001-1. [DOI] [PubMed] [Google Scholar]
- 33.Guruharsha KG, Rual JF, Zhai B, et al. A protein complex network of Drosophila melanogaster. Cell. 2011;147:690–703. doi: 10.1016/j.cell.2011.08.047. [DOI] [PMC free article] [PubMed] [Google Scholar]
- 34.Kucerova L, Poturnajova M, Tyciakova S, Matuskova M. Increased proliferation and chemosensitivity of human mesenchymal stromal cells expressing fusion yeast cytosine deaminase. Stem Cell Res. 2012;8:247–258. doi: 10.1016/j.scr.2011.11.006. [DOI] [PubMed] [Google Scholar]
- 35.Jungkamp AC, Stoeckius M, Mecenas D, et al. In vivo and transcriptome-wide identification of RNA binding protein target sites. Mol Cell. 2011;44:828–840. doi: 10.1016/j.molcel.2011.11.009. [DOI] [PMC free article] [PubMed] [Google Scholar]