Abstract
The renal phenotype in Bardet-Biedl syndrome (BBS) is highly variable. The present study describes renal findings in 41 BBS patients and analyzes the pathogenesis of hyposthenuria, the most common renal dysfunction. Five of 41 patients (12%) showed an estimated glomerular filtration rate < 60 ml·min−1·1.73 m−2. Urine protein and urine albumin-to-creatinine ratio were over 200 and 30 mg/g in 9/24 and 7/23 patients, respectively. Four of 41 patients showed no renal anomalies on ultrasound. Twenty of 34 patients had hyposthenuria in the absence of renal insufficiency. In all 8 of the hyposthenuric patients studied, dDAVP failed to elevate urine osmolality (Uosm), suggesting a nephrogenic origin. Interestingly, water loading (WL) did not result in a significant reduction of Uosm, indicating combined concentrating and diluting defects. dDAVP infusion induced a significant increase of plasma Factor VIII and von Willebrand Factor levels, supporting normal function of the type 2 vasopressin receptor at least in endothelial cells. While urinary aquaporin 2 (u-AQP2) abundance was not different between patients and controls at baseline, the dDAVP-induced increased u-AQP2 and the WL-induced reduction of u-AQP2 were blunted in patients with a combined concentrating and diluting defect, suggesting a potential role of AQP2 in the defective regulation of water absorption. Urine Uromodulin excretion was reduced in all hyposthenuric patients, suggesting a thick ascending limb defect. Interestingly, renal Na, Cl, Ca, but not K handling was impaired after acute WL but not at basal. In summary, BBS patients show combined urinary concentration and dilution defects; a thick ascending limb and collecting duct tubulopathy may underlie impaired water handling.
Keywords: BBS, hyposthenuria, AQP2, UMOD
bardet-biedl syndrome (BBS) is a rare genetic disorder characterized by retinal dystrophy, polydactyly, obesity, cognitive impairment, and renal dysfunction (19). The renal phenotype of BBS is highly variable, and significant renal defects are much less prevalent than other classical features in both patients and murine models (10). The majority of reports have shown that decline of GFR is rare (15), while structural abnormalities are common. Fetal lobulation, calyceal cysts, and clubbing have been found in over 90% of BBS patients (11). Whether these anomalies led ultimately to a progression of renal disease remains to be elucidated. The occurrence of tubular dysfunction such as defective urine-concentrating ability has been described (14); however, the pathogenesis is largely unknown.
BBS has been considered a ciliopathy and polyuria with hyposthenuria is a common finding in several ciliopathies (14). Polyuria of renal origin is often an early presenting symptom in nephronopthisis (NPHP) (16). Moreover, reduced urine concentrating ability has been demonstrated also in autosomal dominant polycystic kidney disease (ADPKD) and medullary cystic disease (8). However, whether the primary cilium is involved in urine-concentrating ability is not well established.
BBS patients commonly show urine-concentrating defects (4–7). We and others have proposed that mutations in BBS10 are associated with hyposthenuria (9, 18). In the present study, we analyzed renal function and sonographic findings in 41 BBS patients. In addition, the pathogenesis of hyposthenuria, the most common renal dysfunction, was further investigated by provocative tests and urinary excretion of antigens of interest.
MATERIALS AND METHODS
Ethics Statement
This study is in full compliance with the Declaration of Helsinki. In addition, ethical approval was obtained from the Institution Review Board of the Azienda Ospedaliera Universitaria, Second University of Naples. All participants gave written informed consent.
BBS Cohort
Forty-one patients were diagnosed BBS according to Beals criteria (1). Retinal degeneration was assessed by ophthalmologists, through electroretinogram and visual field test. Obesity was defined as body mass index over 30 kg/m2. Learning disabilities included defects in ability to write, read, speak, and spell, and deficits of memory, coordination, social skills, and emotional maturity. The clinical characteristics of the cohort are listed in Table 1.
Table 1.
Clinical features
| Feature | Value |
|---|---|
| No. of patients | 41 |
| Age, yr [mean (range)] | 26 (4–45) |
| Sex | 20F/21M |
| Obesity | 31/41 |
| History of childhood obesity | 41/41 |
| Retinal degeneration in patients older than 4 yr-old | 39/40 |
| Learning disabilities | 30/41 |
| Polydactyly | 30/41 |
| Diabetes mellitus | 5/41 |
Characterization of Renal Phenotype
Estimated glomerular filtration rate (eGFR), proteinuria, and albuminuria.
eGFR was estimated with CKD-EPI formula using standardized plasma creatinine measurement. In children, eGFR was estimated using the Schwartz formula [GFR (ml·min−1·1.73 m−2) = 0.41 × height (cm)/SCr (mg/dl)]. Total urinary protein was measured with standard colorimetric method and protein excretion was expressed as urine protein-to-creatinine ratio (PCR) in milligrams per gram. Urine albumin excretion was measured by a radioimmunoassay and expressed as albumin-to-creatinine ratio (ACR) in milligrams per gram.
Evaluation of tubular functions.
Arterial blood gas and urinary and plasma electrolytes were measured by standard analysis. Urine osmolality was measured by Osmometer (model 3320, A. De Mari). To test the maximum urine-concentrating ability, patients were fasted overnight. After the first morning urine void, patients were kept fasted and with water restriction (WR) under supervision until the second urine void, collected at least 12 h (12–14 h) after WR. The test was considered accurate and well performed only if patients showed less than 30% difference in Uosm between the first and the second sample (data not shown). This enabled us to address at the same time 1) whether the patients were compliant with the WR and 2) whether Uosm reached a plateau, corresponding to the maximum concentrating ability. Defective urine-concentrating capability was defined as urine osmolality lower than 750 mOsm/kg in the second void urine sample, after at least 12 h of WR.
Dehydration and desamino-8-d-arginine vasopressin (dDAVP) test.
Patients and controls were fasted overnight with WR. Second morning urine void was collected and immediately stored at −80°C until use. Then, subjects drank 1 liter of water in 20 min (acute water load, WL) and urine samples were collected hourly thereafter for 2 h. dDAVP was injected over 20 min at the dose of 0.3 μg/kg body wt in 100 ml of 0.9% saline solution. Urine was collected hourly for 2 h to determine osmolality, Na+, K+, Cl−, Ca2+, and creatinine. A single blood sample was taken from each participant every 30 min for 120 min to measure plasma vWF and Factor VIII levels. Two patients suffering from X-linked DI were used as negative controls and five healthy volunteers as positive controls.
Renal ultrasound was performed in all patients using HD11XE ultrasound system (Philips).
Urine AQP2 and UMOD antigen.
Urine samples were spun at 5,500 g for 10 min at 4°C. Cleared samples were mixed with methanol, chloroform, and deionized distilled H2O in a ratio of 1:4:1:3 to precipitate proteins and then centrifuged at 5,500 g for 20 min at 10°C. The upper phase was discarded; the lower phase was mixed with methanol and centrifuged again at 10,000 rpm for 60 min at 10°C. The sediment was suspended in 150 μl of buffer (0.3 M sucrose, 25 mM imidazole, 1 mM EDTA, 1 mg/ml leupeptin, 1 mM PMSF). Urine samples were diluted with the loading buffer and normalized to urinary creatinine for loading. Samples were resolved by SDS polyacrylamide gradient gel electrophoresis and then transferred to Invitrolon PVDF membranes (Invitrogen). Filters were blocked in casein/10% Triton X-100 and then incubated overnight with anti-AQP2 antibody (661AP, kindly provided by Prof. Sebastian Frische) and anti-UMOD (cat. no FZ20C, Europa Bioproducts). After washing, membranes were incubated with a phosphatase-conjugated anti-rabbit IgG secondary antibody for 1 h, and bands were visualized with the Tropix chemiluminescence kit (Applied Biosystem) and quantified by the Versadoc Imaging System (Bio-Rad).
Statistical Analyses
The results are shown as means ± SD. Significance of the results have been determined by unpaired t-test; the dDAVP-dependent increased plasma concentration of Factor VIII and von Willebrand factor have been determined by paired t-test; the differences in urine osmolality, u-AQP2, and u-UMOD excretion between BBS patients and controls was tested by analysis of variance (ANOVA). Statistical significance was accepted for P ≤ 0.05.
RESULTS
GFR, Proteinuria, and Albuminuria
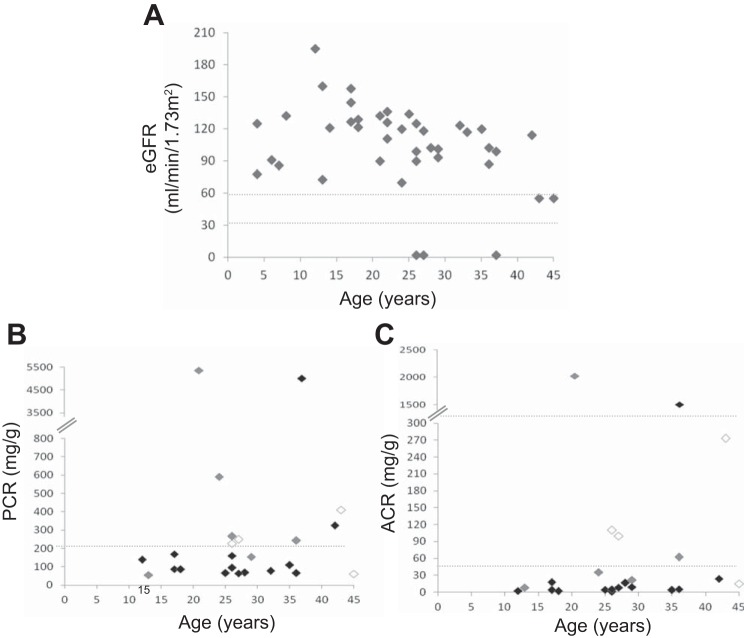
Twenty-seven of 41 patients (66%) showed an eGFR > 90 ml·min−1·1.73 m−2, while 9 patients (22%) had eGFR between 60 and 90 and 5 patients (12%)< 60 ml·min−1·1.73 m−2 (Fig. 1A). Urine protein-to-creatinine ratio (uPCR) was measured in 24 patients. Nine of 24 patients (38%) had uPCR >200 mg/g creatinine (Fig. 1B). Among the subgroup of proteinuric patients, two subjects showed uPCR >3,000 mg/g, and the remaining 7 patients showed uPCR between 200 and 1,000 mg/g. The majority of proteinuric adult BBS patients had renal insufficiency. Urine albumin-to-creatinine ratio (uACR) was measured in 23 BBS patients. Seven of 23 patients (30%) showed uACR > 30 mg/g (Fig. 1C). Albuminuria was present mainly in patients with CKD, with only one albuminuric patient having eGFR >90 ml·min−1·1.73 m−2.
Fig. 1.
Clinical characteristics of the cohort. A: eGFR of BBS patients plotted against age. N = 41. B: spot urine protein-to-creatinine ratio (PCR) (mg/g) of BBS patients. N = 24. C: spot urine albumin-to-creatinine ratio (ACR) (mg/g) in BBS patients. N = 23. In B and C, BBS patients with an eGFR lower than 60 ml·min−1·1.73 m−2 are represented by white, while patients with an eGFR between 60 and 90 and over 90 ml·min−1·1.73 m−2 by gray and black symbols, respectively.
Kidney Ultrasound
Abdomen ultrasound revealed a broad range of renal anomalies (Table 2).The most common lesion was persistent fetal lobulations and unilateral pelvic dilation/pelvic cysts. One patient had horseshoe kidney. Some patients showed parenchymal cysts, renal hypoplasia, and diminished corticomedullary differentiation. Only four patients showed no abnormal kidney ultrasound images.
Table 2.
Renal sonographic findings
| Kidney Anomalies | No. of Patients |
|---|---|
| Fetal lobulations | 16/41 |
| Parenchymal cysts | 10/41 |
| Calyces defects | 18/41 |
| Renal hypoplasia | 17/41 |
| Absence of any abnormality | 4/41 |
Plasma and Urine Electrolytes
To exclude tubular defects due to CKD, tubular function was evaluated only in subjects with an eGFR higher than 60 ml·min−1·1.73 m−2 (Table 3). Plasma electrolytes were within the normal range, and the 24-h urine chemistries of BBS patients were unremarkable (not shown). Urine Ca2+/creatinine ratio was lower than 0.2 mg/mg in all patients. Acid-base status was normal in all individuals except one who had metabolic acidosis.
Table 3.
Electrolyte and acid-base balance in BBS patients with an eGFR higher than 60 ml·min−1·1.73 m−2
| Mean ± SD | Range | |
|---|---|---|
| Plasma Na+, meq/l | 141.44 ± 1.5 | 139–145 |
| Plasma Cl−, meq/l | 103.56 ± 3.6 | 99–116 |
| Plasma K+, meq/l | 4.48 ± 0.36 | 3.7–5.19 |
| Urine Ca2+/creatinine, mg/mg | 0.08 ± 0.04 | 0.05–0.18 |
| Arterial pH | 7.40 ± 0.04 | 7.31–7.46 |
| Arterial HCO3−, meq/l | 24.14 ± 2.13 | 20.2–27.4 |
| Arterial Pco2, mmHg | 39.49 ± 3.43 | 36.3–44.7 |
Renal Tubular Origin of Hyposthenuria in All BBS Patients
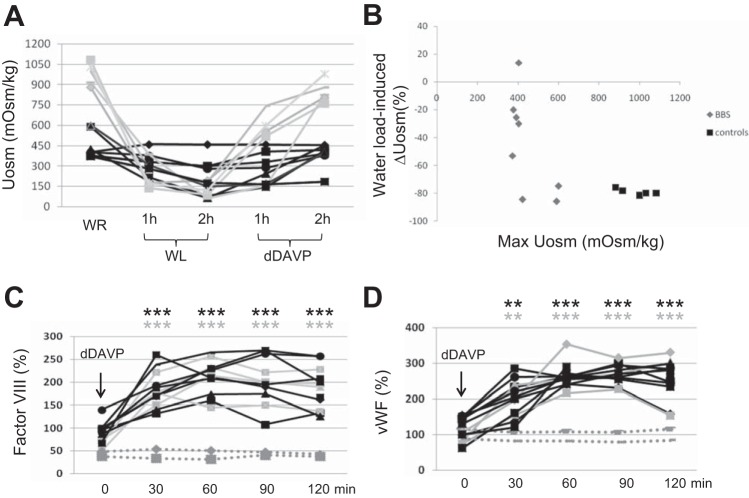
As shown in Fig. 2A, 20/34 patients had Uosm under 750 mOsm despite 12 h of water restriction (WR), while only 3 patients were frankly polyuric (Fig. 2B). Eight hyposthenuric BBS patients underwent dDAVP test to further address the pathogenesis of hyposthenuria; five age-matched healthy volunteers were used as controls. The main features of the patients and controls are shown in Table 4. The higher plasma uric acid (UA) levels, the lower fractional excretion of UA (Fig. 3), and the higher plasma levels of Na+ retentive hormones, as plasma renin activity, support the hypothesis that hyposthenuric BBS patients were volume deplete. Baseline Uosm was lower in all BBS patients compared with controls (444.8 ± 116.2 vs. 982 ± 82.8, P < 0.001). During the dehydration period, and the following phases of the test, the patients showed no significant changes in blood pressure, heart rate, and body weight; no signs of general discomfort were registered. dDAVP infusion resulted in a smaller elevation of Uosm in BBS patients after 2 h (ΔUosm; dDAVP-WL = 170 ± 145 mOsm/kg in BBS patients vs. 695 ± 45 mOsm/kg in controls, P < 0.001), without reaching the arbitrary normal target of 750 mOsm/kg, indicating a renal origin of hyposthenuria (Fig. 4A). Interestingly, acute water loading (WL) resulted in a lesser decrease of Uosm from the basal [ΔUosm (WL − WR) of −236 ± 198 mOsm/kg (a 47.8 ± 35.6% decrease from baseline) in BBS patients compared with control which decreased by −883 ± 109 mOsm/kg (85.7 ± 6.6% decrease from basal) (P < 0.001)]. Patients with the lowest max Uosm (i.e., patients with a more severe defect in urine-concentrating ability) also had a simultaneous defect in urine dilution (Fig. 4B). These findings indicate that hyposthenuric BBS patients have a combined concentrating and diluting defect.
Fig. 2.
A: maximal urine osmolality of BBS patients. Uosm in BBS patients with an eGFR higher than 60 ml·min−1·1.73 m−2 after 12 h of dehydration. N = 34. B: daily urine output.
Table 4.
Main features of the 8 hyposthenuric BBS patients that underwent the WR, WL, and dDAVP test and the controls
| BBS Patients | Controls | P Value | |
|---|---|---|---|
| Sex | 4M/4F | 2M/3F | |
| Age, yr | 27.8 ± 6.2 | 32 ± 4.1 | 0.10 |
| BMI, kg/m2 | 29.3 ± 5.04 | 25.1 ± 1.8 | 0.18 |
| eGFR, ml·min−1·1.73 m−2 | 85.6 ± 7.6 | 90.2 ± 7.2 | 0.28 |
| Daily urine output, liters | 2.3 ± 1.5 | 1.5 ± 0.8 | 0.27 |
| Plasma [Na], meq/l | 141 ± 2.27 | 139 ± 2.1 | 0.41 |
| Maximum Uosm, mOsm/kg | 443 ± 116 | 982 ± 82 | <0.0001 |
| PRA, ng·ml−1·h−1 | 3.5 ± 0.6 | 0.9 ± 0.3 | <0.001 |
| Plasma uric acid, mg/dl | 6.2 ± 1.4 | 4.5 ± 0.8 | <0.01 |
| Basal FEUA% | 5.1 ± 2.2 | 7.1 ± 1.1 | <0.05 |
Values are means ± SD. BMI, body max index; PRA, plasma renin activity; FEUA%, fractional excretion of uric acid.
Fig. 3.
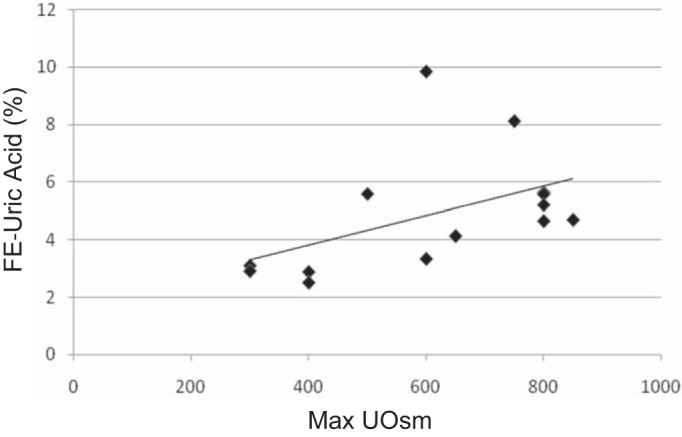
Uric acid excretion compared with maximum Uosm in BBS patients. Fractional excretion of UA (FEUA%) increases with increasing maximum Uosm suggesting that patients with low Uosm lose water, which ultimately leads to increased UA reabsorption.
Fig. 4.
Renal response to hydration status and dDAVP infusion. A: Uosm was measured in 8 hyposthenuric BBS patients (black lines) and 5 helthy volunteers (grey lines). WR = water restriction overnight; WL = water load; dDAVP = desmopressin. B: changes of Uosm after the WL compared with max Uosm (%). Five BBS patients showed both a reduced max Uosm and a lower decrease in Uosm after the water loading compared with controls, suggesting a combined concentrating and diluting defect. C: dDAVP-dependent plasma release of Factor VIII. Both patients (black lines) and controls (solid gray lines) showed a significant increased plasma release of Factor VIII upon dDAVP infusion compared with the baseline. The dashed gray lines indicate the response of two X-linked DI patients. D: dDAVP-dependent plasma release of von Willebrand factor (vWF). Both patients and controls showed a significant increase in plasma release of Factor VIII upon dDAVP infusion compared with the baseline. Significant differences: **P ≤ 0.01, ***P ≤ 0.001 compared with baseline.
Plasma Levels of Factor VIII and von Willebrand Factor (vWF) after dDAVP Infusion
The dDAVP test allows differentiation of renal from extrarenal hyposthenuria but does not provide additional information on the pathogenesis of this defect. Vasopressin (ADH), acting via V2R, has two extrarenal effects: 1) the decrease of peripheral resistance via vasodilation; and 2) the release of coagulation factors, including Factor VIII and the vWF from the endothelium. Bichet et al. have demonstrated that upon dDAVP binding to the V2R, endothelial cells release these coagulation factors to the plasma (3), and this test is well established to distinguish patients with diabetes insipidus from mutations in V2R gene from those carrying AQP2 mutations. Plasma levels of both Factor VIII and vWF in response to dDAVP in BBS patients resembled normal subjects (Fig. 4, C and D), suggesting that V2R, at least in endothelial cells, is not affected and that hyposthenuria in BBS patients is not due to a defective function of V2R.
Renal Na+, K+, Cl−, and Ca2+ Handling after WR, WL, and dDAVP Infusion
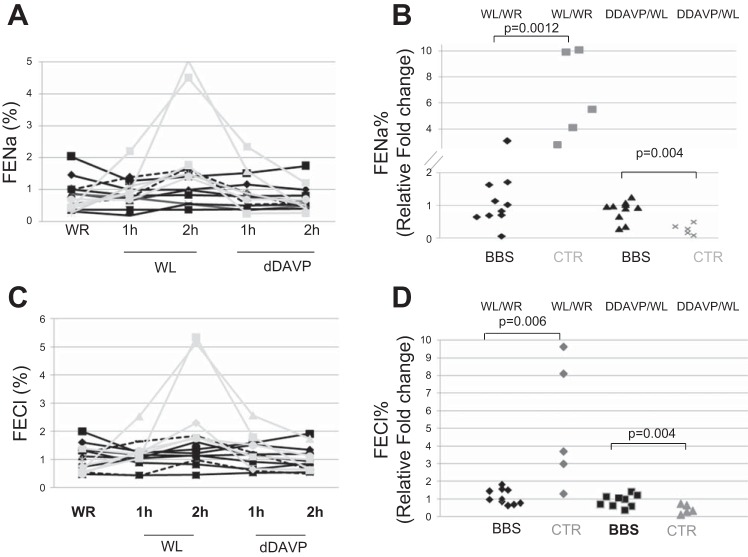
Hyposthenuric BBS patients and controls showed no difference in FENa% at baseline (mean 0.47 ± 0.10% in controls vs. 0.95 ± 0.54% in BBS patients, P = 0.08). However, WL caused an increase in FENa% within 2 h in controls but not in BBS patients (2.84 ± 1.78% in controls vs. 1.00 ± 0.48% in BBS patients, P < 0.01). Two hours after dDAVP infusion, FENa% was not different in the two groups (0.62 ± 0.37 in controls vs. 0.74 ± 0.42 in patients, P = 0.60). Figure 5, A and B, shows that the changes of FENa% during the test were blunted in hyposthenuric patients, in the absence of significant differences at basal and post-dDAVP infusion between patients and controls. Similarly, The FECl% increased after the WL and went back to normal upon dDAVP infusion in controls (mean: 0.76 ± 0.37%, 3.27 ± 1.82%, and 1.02 ± 0.45% after WR, WL, and post-dDAVP infusion), while FECl% was essentially constant in BBS patients (mean: 1.15 ± 0.50%, 1.26 ± 0.47%, and 0.97 ± 0.45% after WR, WL, and post-dDAVP infusion) (Fig. 5, C and D).
Fig. 5.
Renal Na+ and Cl− excretion after WR, WL, and dDAVP infusion. A and C: solid black lines indicate hyposthenuric BBS patients (n = 8), while the dashed black lines are the nonhyposthenuric BBS patients (n = 2) and the gray lines are the controls (n = 5). B and D: WL and the dDAVP induced changes of FENa% and FECl% compared with basal in controls and hyposthenuric BBS patients.
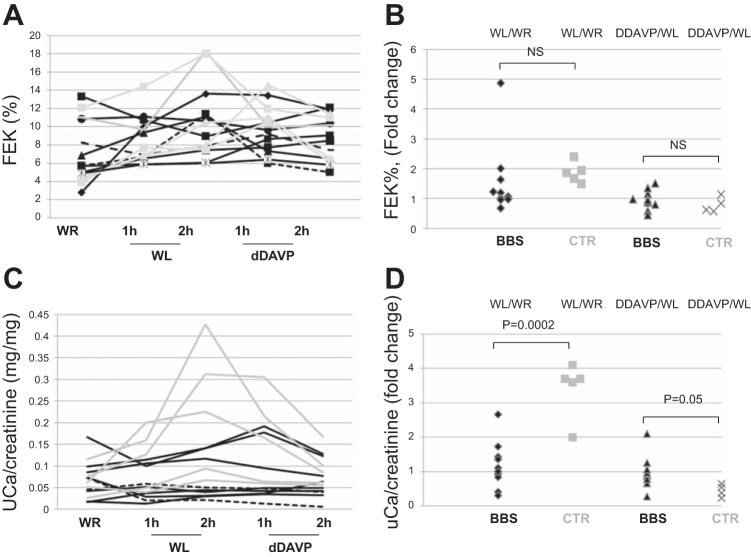
The fractional excretion of K+ (FEK%) during the test was not different between patients and controls, as shown in Fig. 6, A and B, while the increased urine Ca2+ excretion induced by the water loading was blunted in BBS patients (Fig. 6, C and D), similarly to Na+ and Cl− excretion. The difference in electrolyte handling in the patients was not limited to hyposthenuric BBS patients, as two BBS patients with no defective urine-concentrating ability also showed an impaired Na+, Cl−, and Ca2+ handling.
Fig. 6.
A and B: renal K+ and Ca2+ excretion after WR, WL, and dDAVP infusion. K excretion was not different between controls (gray lines), hyposthenuric (solid black lines), and not hyposthenuric (dashed black lines) BBS patients. C and D: Ca/creatinine concentration was increased in controls (gray lines/symbols) after the WL, but not in BBS patients.
u-AQP2 Excretion in Hyposthenuric BBS Patients
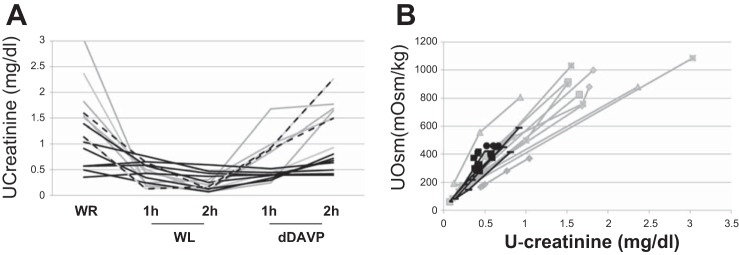
uAQP2 excretion was demonstrated to correlate with AQP2 abundance on the apical membrane of the CD (6). The excretion of u-AQP2 was measured as u-AQP2/u-creatinine ratio. To ensure that BBS patients did not differ from controls in urine creatinine excretion, we compared u-creatinine concentration in the experimental conditions in controls and patients. Figure 7A shows that u-creatinine concentration has a similar trend of Uosm (compare with Fig. 3A) in both controls and BBS patients, with changes in normal subjects according with hydration status and with no change between the experimental conditions in hyposthenuric BBS patients. Figure 7B shows that in both BBS patients and controls, u-creatinine concentration had a linear relationship with Uosm during the different experimental conditions, indicating that u-creatinine excretion was similar in BBS patients and controls.
Fig. 7.
A: urine creatinine concentration in hyposthenuric BBS patients (solid black lines), two not hyposthenuric BBS patients (dashed black lines), and controls (gray lines) after water restriction, water loading, and dDAVP infusion. B: urine creatinine concentration compared with Uosm during the test in patients (black symbols) and controls (gray symbols).
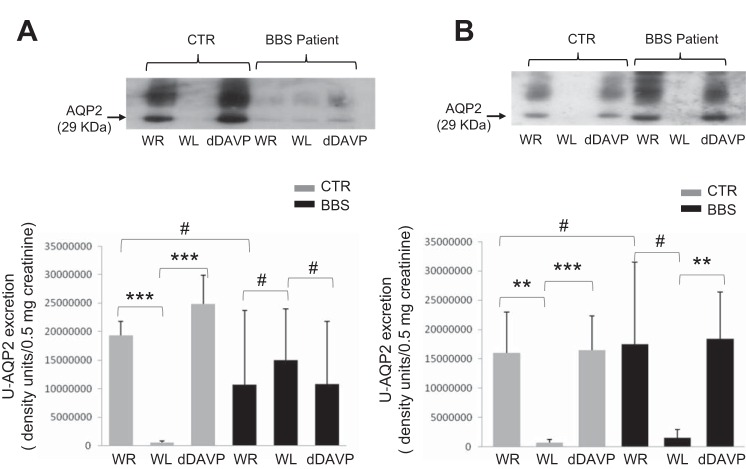
Interestingly, at basal state after overnight WR, u-AQP2 excretion in hyposthenuric BBS patients showed a trend toward a reduction compared with controls, but this difference was not statistically significant (Fig. 8, A and B). However, 5 of 8 hyposthenuric BBS patients showed no change of u-AQP2 excretion throughout the three experimental maneuvers, WR, WL, and dDAVP infusion, while 3 of 8 patients showed the normal increase in u-AQP2 excretion in WR and after dDAVP.
Fig. 8.
Urine AQP2 (uAQP2)-to-creatinine ratio in healthy volunteers and hyposthenuric BBS patients. A: representative immunoblotting of uAQP2 excretion in a BBS patient with a combined defect to concentrate and dilute the urine. Each lane is representative of uAQP2 abundance per 0.5 mg creatinine loaded. Densitometric analysis was applied to 5 BBS patients. Analysis of variance revealed significantly decreased uAQP2 excretion after water load (P < 0.001 vs. WR) and increased uAQP2 after dDAVP (P < 0.001 vs. WL) in controls, but not in hyposthenuric BBS patients (P = 0.92 and 0.93, WL vs. WR and dDAVP vs. WL, respectively). uAQP2 excretion after overnight WR showed a trend to a reduction in BBS patients compared with controls (P = 0.25). B: u-AQP2 excretion in a control and a BBS patient with the defect to concentrate the urine only. Representative immunoblot of one of three hyposthenuric BBS patients with normal diluting ability, showing normal increased uAQP2 excretion after dDAVP (**P < 0.01, and a trend toward the reduction of uAQP2 after the WL (#P = 0.12 compared with baseline). Basal uAQP2 excretion was not different between patients (N = 3) and control (N = 3) (P = 0.89). **P < 0.01. ***P < 0.001. #P > 0.05.
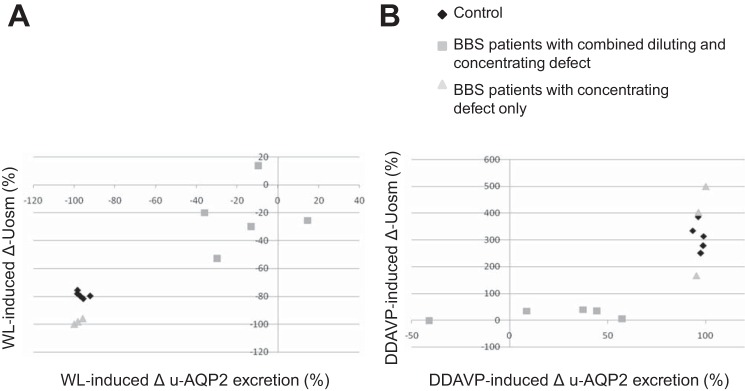
We addressed whether the defective AQP2 regulation could be the cause of abnormal water handling in response to an acute water load and dDAVP infusion. Figure 9 shows that in controls the reduction of Uosm induced by the WL and the increased Uosm induced by the dDAVP were accompanied by changes of u-AQP2 excretion. Figure 9A shows that three BBS patients that underwent a significant reduction of Uosm upon the WL (i.e., patients with no diluting defects) showed also a reduction of u-AQP2 excretion, while patients who were unable to dilute the urine showed a blunted reduction of u-AQP2. Interestingly, the second subgroup of patients had also a compromised increased u-AQP2 excretion upon dDAVP infusion, with a smaller increased Uosm from the basal as depicted in Fig. 9B, indicating defective regulation of AQP2 trafficking under acute stimuli.
Fig. 9.
Effect of acute water loading and dDAVP infusion on u-AQP2 excretion and Uosm. A: correlation between the WL-induced reduction of Uosm and u-AQP2 excretion. B: dDAVP-dependent changes of Uosm and u-AQP2 excretion. u-AQP2 was analyzed by densitometric analysis and is displayed as a percentage change over the basal.
u-UMOD Excretion in BBS Patients
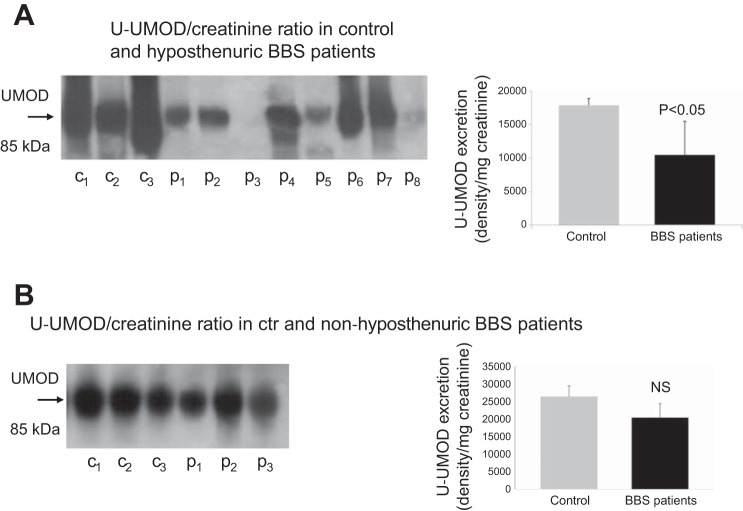
Figure 10A shows that hyposthenuric BBS patients exhibited a reduction in u-UMOD excretion. To better address whether reduced u-UMOD excretion was specifically associated with hyposthenuria, we measured u-UMOD abundance also in three BBS patients with normal urine-concentrating ability (Fig. 10B). Interestingly, u-UMOD excretion in these patients were no different compared with normal subjects.
Fig. 10.
A: u-UMOD excretion in healthy volunteers (C) and hyposthenuric BBS patients (P). B: u-UMOD excretion in controls and BBS patients without urine-concentrating defect.
DISCUSSION
The present study aims to investigate renal function in BBS patients and provides some elements that may explain at least in part the pathogenesis of hyposthenuria, the most common renal defect in this condition.
The novelty of the study lies in the following: 1) the characterization of renal function, the main cause of morbidity and mortality in BBS patients, in one of the largest cohort of BBS patients among those described in literature; 2) the analysis of the pathogenesis of hyposthenuria; even though the renal origin has been already addressed, to our knowledge this is the first study that has demonstrated the coexistence of urine concentration and dilution defect, has measured urine AQP2 and UMOD excretion, and the dDAVP-dependent plasma release of coagulation factors; and 3) the evaluations of renal electrolytes handling under stress conditions.
The majority of our BBS patients showed eGFR > 90 ml·min−1·1.73 m−2. Five patients had an eGFR lower than 60 ml·min−1·1.73 m−2, and 9 patients had an eGFR between 60 and 90 ml·min−1·1.73 m−2. Three patients had ESRD requiring renal replacement therapy. Two of them reached ESRD before adulthood, secondary to presumed severe renal and urinary tract malformation diagnosed before the birth. The third patient started hemodialysis at the age of 38. The remaining two patients with CKD stage III-IV were the oldest patients of our cohort. The patients with CKD stage II were individuals with fairly severe renal malformations, diagnosed early in life (prenatal or perinatal), as multicystic kidneys, and experienced a progressive decline of renal function. The majority of patients with normal GFR showed some abnormal structure on renal ultrasound. Whether these anomalies predispose to future progression of renal disease needs to be followed. O'Dea et al. (11) showed that the frequency of renal impairment increased with age. Our cohort consisted mainly of young individuals and the oldest patients did show some degree of renal impairment. Thus our observations are compatible with BBS as a predisposing factor to a progressive decline of renal function. Most BBS patients with CKD showed proteinuria and albuminuria, while it is unusual to see high urine protein or albumin excretion with normal GFR. Therefore, the presence of structural abnormalities and proteinuria/albuminuria should alert the clinician of possible impending CKD deserving more vigilant surveillance.
We found a high incidence of hyposthenuria (58.8%) in the absence of renal insufficiency. Besides the lower maximum Uosm after prolonged dehydration than controls, further data support the hypothesis of defective urine-concentrating ability: 1) the increased plasma levels of Na+ retentive hormones such as renin activity; and 2) the lower FEUA%, indicating an increased uric acid absorption as a surrogate for increased solute reabsorption along the proximal tubule. A deeper examination demonstrated that the majority of hyposthenuric patients had a combined defect in maximally concentrating and diluting the urine. A defect of urine concentration can be attributed to the following tubular dysfunctions: 1) defective NaCl absorption along the thick ascending limb (TAL) to establish a high medullary Na gradient, and 2) a failure of the CD to increase luminal water permeability during dehydration (8). These defects singly or in combination may affect the maximal Uosm.
Our data indicate that the hyposthenuria of BBS patients has a renal origin. Previous studies demonstrated that hyposthenuria in BBS patients was resistant to dDAVP administration, which is against central diabetes insipidus but does not address the specific nephrogenic defect (5). The analysis of tubular function in our cohort did not reveal the presence of significant electrolytes and acid-base imbalance at basal state, and no signs of Bartter-like dysfunctions have been observed other than impaired urinary concentration. The defective Na+, Cl−, and Ca2+ handling after acute WL is a novel finding in BBS patients, and the underlying mechanism is currently unknown. However, these dysfunctions are not specific for hyposthenuric BBS patients, but were common also to BBS patients with no defective urine-concentrating ability. Whether BBS proteins may somehow affect the function of Na+, Cl−, and Ca2+ transporters has not been studied and remains to be investigated.
In the absence of clear signs of Bartter-like syndrome, our first hypothesis of the molecular basis of hyposthenuria focused on the CD. In normal subjects, dDAVP infusion results in the increased plasma levels of Factor VIII and vWF, as a consequence of endothelial release via V2R. Moreover, dDAVP infusion, as well as WR-induced endogenous ADH, leads to AQP2 insertion into the apical membrane (12), and increased u-AQP2 excretion (6). We addressed whether receptor or post-receptor defects are present in hyposthenuric BBS patients. dDAVP infusion resulted in a normal increase of Factor VIII and vWF in plasma, compatible with normal V2R function at least in endothelial cells. Surprisingly, u-AQP2 excretion after WR was not different in hyposthenuric BBS patients compared with controls which speaks against the role of AQP2 defect as the sole cause of renal hyposthenuria. However, 5 of 8 hyposthenuric BBS patients showed the same abundance of u-AQP2 excretion after WR, WL, and dDAVP infusion, indicating dissociation between u-AQP2 excretion and AVP/dDAVP plasma levels in acute conditions. Thus our data suggest that the majority of hyposthenuric BBS patients show defective regulation of AQP2 trafficking after an acute stimulus, but after “chronic” dehydration uAQP2 excretion/trafficking appears not to be impaired.
Interestingly, the defective regulation of AQP2 excretion occurred only in the subset of BBS patients who cannot maximally dilute their urine, suggesting a potential role in the regulation of AQP2 trafficking as cause of urine diluting defect.
There are data to date to support the correlation between AQP2 trafficking and BBS proteins. Marion et al. (9) showed that nonciliated BBS10-deprived cells failed to insert AQP2 to the apical membrane upon ADH exposure. In contrast, kidney-specific BBS10 KO mice showed no imbalance in water homeostasis and AQP2 trafficking (4). We demonstrated that a BBS patient with a mutation of BBS10 showed hyposthenuria, while three BBS1 patients did not (18). Hyposthenuria in the BBS10 patient was associated with a blunted increased u-AQP2 excretion in antidiuresis. In addition, we found that in polarized MCD4 cells BBS10 gene inactivation, but not BBS1 inactivation, prevented forskolin-induced AQP2 accumulation at the apical membrane and caused AQP2 misdirection to the basolateral membrane. The dramatic reduction in subapical acetylated tubulin could explain the defective AQP2 routing (18). These findings may at least in part provide an explanation for the defective regulation of AQP2 trafficking in BBS patients. Whether BBS proteins may also cause the inability to recruit AQP2 from the plasma membrane under low ADH plasma levels is under study.
Even though defective AQP2 trafficking is clearly present in the majority of hyposthenuric BBS patients and may underlie the defect in urine dilution, our data suggest that other mechanisms may also be involved in the pathogenesis of urine-concentrating defect: 1) at baseline u-AQP2 excretion was not different between patients and controls despite the difference in maximal Uosm; and 2) three of the eight hyposthenuric patients had normal u-AQP2 excretion in antidiuresis and after the water loading.
However, even if we did not detect significant plasma electrolytes and acid-base disturbance in BBS patients at basal state, we cannot exclude a latent TAL dysfunction which may result in renal hyposthenuria. This hypothesis is supported by the evidence that BBS shares several analogies with the UMOD-associated kidney disease (UAKD), as polyuria, renal cysts, and the progressive decline of GFR. Interestingly, in vitro studies have demonstrated that UAKD-associated mutations in UMOD caused endoplasmic reticulum retention of the mutant protein (13–17), leading to tubulointerstitial damage, starting from the TAL. Indeed in UAKD patients, u-UMOD excretion was lower than normal subjects (2). We showed that BBS patients have a reduction in u-UMOD excretion and this finding was restricted to hyposthenuric BBS patients. We speculate that BBS mutations may cause two defects. First, it can impair the generation of a hypertonic interstitium so even in the presence of intact AQP2 insertion, Uosm fails to increase. Second, it can lead to UMOD intracellular accumulation, as in UAKD, causing ultimately tubulointerstitial fibrosis, hyposthenuria, and eventually decline in GFR.
The present study has several limitations: 1) the absence of the genetic analysis of the patients and the consequent lack of genotype-phenotype correlations; 2) the use of the CKD-EPI formula to estimate the GFR may not be ideal considering that our cohort included obese individuals; 3) the use of endothelial V2R function as marker of its function in the kidney does not enable us to definitively exclude kidney-specific signaling defects; and 4) the lack of information on a potential role of defective osmosensing and/or ADH plasma levels, that may contribute to the genesis of hyposthenuria in addition to renal defects, as shown in other ciliopathies as ADPKD.
In conclusion, our study shows that in our cohort of BBS patients reduced eGFR occurs in the presence of severe renal malformation, or it can develop later in life after 38–40 yr of age. The most common renal defect was renal hyposthenuria. A more thorough analysis revealed that BBS patients with the most severe concentrating defect showed a combined concentrating and diluting defect, and that even though at basal state electrolytes homeostasis appeared normal, under an acute water load the patients showed an impaired renal Na+, Cl−, Ca2+, but not K+ handling. A potential mechanism underlying the defective water handling in hyposthenuric BBS patients may be explained by 1) the absence of any regulation of u-AQP2 in antidiuresis and water loading, and normal endothelial response upon dDAVP infusion, suggesting a defective trafficking of AQP2, downstream of V2R; and 2) the reduced u-UMOD excretion, suggesting a combined defect, along the CD and the TAL.
GRANTS
This work was supported, in part, by a grant from the Italian Ministry Scientific Research to G. Capasso.
O. W. Moe was supported by the National Institutes of Health (R01-DK-091392, R01-DK-092461, R01-DK-081423), the O'Brien Kidney Center (P30 DK-079328), the American Society of Nephrology, and the Charles and Jane Pak Foundation.
We thank the Associazione Italiana Sindrome di Bardet-Biedl (ASBBI) for its support.
DISCLOSURES
No conflicts of interest, financial or otherwise, are declared by the author(s).
AUTHOR CONTRIBUTIONS
M.Z. and O.W.M. conception and design of research; M.Z., E. Zacchia, E. Zona, G. Capolongo, D.I., A.P., and F.S. analyzed data; M.Z., G. Capolongo, I.R., O.W.M., and G. Capasso interpreted results of experiments; M.Z., E. Zona, F.T., and A.P. prepared figures; M.Z. drafted manuscript; E. Zacchia, E. Zona, L.R., D.I., and V.D.I. performed experiments; F.T., F.S., and O.W.M. edited and revised manuscript; O.W.M. and G. Capasso approved final version of manuscript.
ACKNOWLEDGMENTS
We thank S. Frische for providing the anti-AQP2 antibody.
REFERENCES
- 1.Beales PL, Elcioglu N, Woolf AS, Parker D, Flinter FA. New criteria for improved diagnosis of Bardet-Biedl syndrome: results of a population survey. J Med Genet 36: 437–446, 1999. [PMC free article] [PubMed] [Google Scholar]
- 2.Bernascone I, Janas S, Ikehata M, Trudu M, Corbelli A, Schaeffer C, Rastaldi MP, Devuyst O, Rampoldi L. A transgenic mouse model for uromodulin-associated kidney diseases shows specific tubulo-interstitial damage, urinary concentrating defect and renal failure. Hum Mol Genet 19: 2998–3010, 2010. [DOI] [PubMed] [Google Scholar]
- 3.Bichet DG, Razi M, Lonergan M, Arthus MF, Papukna V, Kortas C, Barjon JN. Hemodynamic and coagulation responses to 1-desamino[8-d-arginine] vasopressin in patients with congenital nephrogenic diabetes insipidus. N Engl J Med 318: 881–887, 1988. [DOI] [PubMed] [Google Scholar]
- 4.Cognard N, Scerbo MJ, Obringer C, Yu X, Costa F, Haser E, Le D, Stoetzel C, Roux MJ, Moulin B, Dollfus H, Marion V. Comparing the Bbs10 complete knockout phenotype with a specific renal epithelial knockout one highlights the link between renal defects and systemic inactivation in mice. Cilia 13: 4–10, 2015. [DOI] [PMC free article] [PubMed] [Google Scholar]
- 5.Harnett JD, Green JS, Cramer BC, Johnson G, Chafe L, McManamon P, Farid NR, Pryse-Phillips W, Parfrey PS. The spectrum of renal disease in Laurence-Moon-Biedl syndrome. N Engl J Med 319: 615–618, 1988. [DOI] [PubMed] [Google Scholar]
- 6.Ishikawa S. Urinary excretion of aquaporin-2 in pathological states of water metabolism. Ann Med 32: 90–93, 2000. [DOI] [PubMed] [Google Scholar]
- 7.Imhoff O, Marion V, Stoetzel C, Durand M, Holder M, Sigaudy S, Sarda P, Hamel CP, Brandt C, Dollfus H, Moulin B. Bardet-Biedl syndrome: a study of the renal and cardiovascular phenotypes in a Frencohort. Clin J Am Soc Nephrol 6: 22–29, 2011. [DOI] [PMC free article] [PubMed] [Google Scholar]
- 8.Krishnan R, Eley L, Sayer JA. Urinary concentration defects and mechanisms underlying nephronophthisis. Kidney Blood Press Res 31: 152–162, 2008. [DOI] [PubMed] [Google Scholar]
- 9.Marion V, Schlicht D, Mockel A, Caillard S, Imhoff O, Stoetzel C, van Dijk P, Brandt C, Moulin B, Dollfus H. Bardet-Biedl syndrome highlights the major role of the primary cilium in efficient water reabsorption. Kidney Int 79: 1013–1025, 2011. [DOI] [PubMed] [Google Scholar]
- 10.Norris DP, Grimes DT. Mouse models of ciliopathies: the state of the art. Dis Model Mech 5: 299–312, 2012. [DOI] [PMC free article] [PubMed] [Google Scholar]
- 11.O'Dea D, Parfrey PS, Harnett JD, Hefferton D, Cramer BC, Green J. The importance of renal impairment in the natural history of Bardet-Biedl syndrome. Am J Kidney Dis 27: 776–783, 1996.8651240 [Google Scholar]
- 12.Procino G, Carmosino M, Tamma G, Gouraud S, Laera A, Riccardi D, Svelto M, Valenti G. Extracellular calcium antagonizes forskolin-induced aquaporin 2 trafficking in collecting duct cells. Kidney Int 66: 2245–2255, 2004. [DOI] [PubMed] [Google Scholar]
- 13.Rampoldi L, Scolari F, Amoroso A, Ghiggeri G, Devuyst O. The rediscovery of uromodulin (Tamm-Horsfall protein): from tubulointerstitial nephropathy to chronic kidney disease. Kidney Int 80: 338–347, 2011. [DOI] [PubMed] [Google Scholar]
- 14.Simms RJ, Hynes AM, Eley L, Sayer JA. Nephronophthisis: a genetically diverse ciliopathy. Int J Nephrol 2011: 527137, 2011. [DOI] [PMC free article] [PubMed] [Google Scholar]
- 15.Tobin JL, Beales PL. Bardet-Biedl Syndrome: beyond the cilium. Pediatr Nephrol 22: 926–936, 2007. [DOI] [PMC free article] [PubMed] [Google Scholar]
- 16.Wolf MTF, Hildebrandt F. Nephronophthisis. Pediatr Nephrol 26: 181–194, 2011. [DOI] [PMC free article] [PubMed] [Google Scholar]
- 17.Zacchia M, Capasso G. The importance of uromodulin as regulator of salt reabsorption along the thick ascending limb. Nephrol Dial Transplant 30: 158–160, 2015. [DOI] [PubMed] [Google Scholar]
- 18.Zacchia M, Esposito G, Carmosino M, Barbieri C, Zacchia E, Crispo AA, Fioretti T, Trepiccione F, Di Iorio V, Simonelli F, Salvatore F, Capasso G, Svelto M, Procino G. Knockdown of the BBS10 gene product affects apical targeting of AQP2 in renal cells: a possible explanation for the polyuria associated with Bardet-Biedl Syndrome. J Genet Syndr Gene Ther 5: 3, 2014. [Google Scholar]
- 19.Zaghloul NA, Katsanis N. Mechanistic insights into Bardet-Biedl syndrome, a model ciliopathy. J Clin Invest 119: 428–437, 2009. [DOI] [PMC free article] [PubMed] [Google Scholar]


