

This is the first study to report single muscle fiber strength, speed, and power in the oldest-old. These data suggest an improvement in myocellular quality with age that is more pronounced in the fast-twitch muscle fibers. The improved quality of these remaining muscle fibers suggests a “survival of the fittest” phenomenon that is in contrast to the classic aging skeletal muscle dogma.
Keywords: single fiber, oldest-old, muscle quality, aging, contractile function
Abstract
We examined single muscle fiber contractile function of the oldest-old (3F/2M, 89 ± 1 yr old) enrolled in The Health, Aging, and Body Composition Study (The Health ABC Study). Vastus lateralis muscle biopsies were obtained and single muscle fiber function was determined (n = 105) prior to myosin heavy chain (MHC) isoform identification with sodium dodecyl sulfate-polyacrylamide gel electrophoresis. Cross-sectional area of MHC I muscle fibers (5,576 ± 333 μm2; n = 58) was 21% larger (P < 0.05) than MHC IIa fibers (4,518 ± 386 μm2; n = 47). Normalized power (an indicator of muscle fiber quality incorporating size, strength, and speed) of MHC I and IIa muscle fibers was 2.3 ± 0.1 and 17.4 ± 0.8 W/l, respectively. Compared with previous research from our lab using identical procedures, MHC I normalized power was 28% higher than healthy 20 yr olds and similar to younger octogenarians (∼80 yr old). Normalized power of MHC IIa fibers was 63% greater than 20 yr olds and 39% greater than younger octogenarians. These comparative data suggest that power output per unit size (i.e., muscle quality) of remaining muscle fibers improves with age, a phenomenon more pronounced in MHC IIa fibers. Age-related single muscle fiber quality improvements may be a compensatory mechanism to help offset decrements in whole muscle function.
NEW & NOTEWORTHY
This is the first study to report single muscle fiber strength, speed, and power in the oldest-old. These data suggest an improvement in myocellular quality with age that is more pronounced in the fast-twitch muscle fibers. The improved quality of these remaining muscle fibers suggests a “survival of the fittest” phenomenon that is in contrast to the classic aging skeletal muscle dogma.
the 2010 U.S. census projects the number of people in the oldest-old age group (those age 85 yr old and older) will triple from 5.8 to 19 million by 2050 (71). A hallmark characteristic of advancing age is a decline in the number (41) and size (67) of muscle fibers contributing to a loss of muscle mass and strength in older adults (25). Impaired muscle function is related to mobility impairment (15), disability (29), and loss of independence (52). A more definitive understanding of the physiological mechanisms underlying age-related skeletal muscle decline may help guide therapeutic interventions to ameliorate mobility limitations, subsequently enhancing quality of life in the expanding demographic of the oldest-old.
Age-associated muscle mass declines (3-8% per decade) begin during the fourth decade of life (14, 42, 60) and accelerate after the age of 75 yr (72). Decreases in muscle mass with age are suggested to contribute to a loss of muscle strength and, perhaps more importantly, muscle power (17, 28, 54). However, muscle atrophy has been proposed to account for only half of the lower peak muscle power observed in elderly individuals (63). This suggests a loss in whole muscle quality (power output per muscle cross-sectional area) during the aging process. Muscle power is shown to decline earlier (beginning as early as 20 yr of age) and 10% more per decade than muscle strength with aging (46). Furthermore, low muscle power is associated with a 2- to 3-fold greater risk for mobility limitation compared with low muscle strength (4). Whole muscle quality reductions in older individuals could be due to a number of factors such as fiber type transition (39, 42), alterations in neuromuscular function (11, 66), excitation-contraction uncoupling (51), fat infiltration (24), or alterations to the intrinsic properties of the individual muscle fibers (40).
Investigations of the cellular response to the aging process provide unique insights into age-related muscle dysfunction. Preliminary studies inspecting single muscle fiber quality in aged rodents reported 20–25% lower single fiber specific force (force adjusted for size) compared with young animals (6, 43, 64). These findings were corroborated by early aging human single fiber studies (19, 40, 50), suggesting that age-related alterations at the cross-bridge level contribute to whole muscle quality decline. However, recent human investigations contrast these early reports showing a preservation of single fiber specific force with age (18, 36, 53, 61). While the reasons for the differences among the early and more recent studies are not clear, we suspect it may be related to overall fiber yield (i.e., the number of fibers studied per individual) in combination with different physical activity levels between older and younger participants studied (9, 67).
The purpose of this investigation was to evaluate single muscle fiber quality in slow- and fast-twitch muscle fibers of a unique ageing cohort (>85 yr of age). Our primary interest was normalized power (a measure accounting for size, strength, and speed) since this provides an integrated performance index incorporating quantitative and qualitative aspects of contractile function. We also assessed specific force to complement normalized power as an additional measure of muscle quality and to compare our findings to previous literature.
METHODS
Subjects
Five healthy independently living older adults, 3 females and 2 males (Table 1), were recruited as part of The Health, Aging, and Body Composition Study (Health ABC Study) and included in the analysis. All subjects were over 85 yr of age (87–90 yr), nonexercising, nonobese, and otherwise healthy. Before participation in the study, subjects were informed of all risks and procedures, and written informed consent was obtained. Institutional Review Boards approved all procedures at the participating institutions in a manner consistent with the Declaration of Helsinki.
Table 1.
Subject characteristics
| Subject | Sex | Age, yr | Ht, cm | Wt, kg | BMI, kg/m2 |
|---|---|---|---|---|---|
| 1 | M | 88 | 169.1 | 67.6 | 23.6 |
| 2 | M | 89 | 150.9 | 66.8 | 29.3 |
| 3 | F | 90 | 155.4 | 59.2 | 24.5 |
| 4 | F | 87 | 160.4 | 76.7 | 29.8 |
| 5 | F | 89 | 140.1 | 46.5 | 23.7 |
| Mean | 88.6 | 155.2 | 63.4 | 26.2 | |
| SD | 1.1 | 10.8 | 11.3 | 3.1 | |
| SE | 0.5 | 4.8 | 5.0 | 1.4 |
Muscle Biopsy
Resting muscle biopsies (5) were obtained from the vastus lateralis (VL) of each subject. Muscle samples were sectioned longitudinally into several pieces and placed in cold skinning solution prior to being stored at −20°C for later analysis of single muscle fiber physiology. Following a single muscle fiber experiment, each fiber was analyzed for MHC composition, as described in Fiber type analysis.
Skinning, Relaxing, and Activating Solutions
The skinning solution contained (in mM) 125.0 K propionate, 2.0 EGTA, 4.0 ATP, 1.0 MgCl2, 20.0 imidazole (pH 7.0), and 50% (vol/vol) glycerol. The compositions of the relaxing and activating solutions were calculated using an interactive computer program described by Fabiato and Fabiato (16). These solutions were adjusted for temperature, pH, and ionic strength using stability constants in the calculations (22). Each solution contained (in mM) 7.0 EGTA, 20.0 imidazole, 14.5 creatine phosphate, 1.0 free Mg2+, 4.0 free MgATP, KCl, and KOH to produce an ionic strength of 180 mM and a pH of 7.0. The relaxing and activating solution had a free [Ca2+] of pCa 9.0 and pCa 4.5, respectively (where pCa = −log [Ca2+]).
Single Muscle Fiber Experimental Set-Up
On the day of an experiment, a 2.5- to 3.0-mm muscle fiber segment was randomly isolated from a muscle bundle and transferred to an experimental chamber filled with relaxing solution where the ends were securely fastened between a force transducer (model 400A, Cambridge Technology, Lexington, MA) and a direct-current torque motor (model 308B, Cambridge Technology) as described by Moss (48). The force transducer and torque motor were calibrated before each experiment. Instrumentation was arranged so a muscle fiber could be rapidly transferred back and forth between experimental chambers filled with relaxing (pCa 9.0) or activating (pCa 4.5) solutions. The apparatus was mounted on a microscope (Olympus BH-2, Japan) to view the fiber (×800) during an experiment. Using an eyepiece micrometer, sarcomere length along the isolated muscle was adjusted to 2.5 μm, and the fiber length (FL) was measured (69). All single fiber experiments were performed at 15°C.
Unamplified force and length signals were sent to a digital oscilloscope (Nicolet 310, Madison, WI), enabling monitoring of muscle fiber performance throughout data collection. Analog force and position signals were amplified (Positron Development, Dual Differential Amplifier, 300-DIF2, Inglewood, CA), converted to digital signals (National Instruments, Austin, TX), and transferred to a computer (Micron Electronics, Nampa, ID) for analysis using customized software. Servomotor arm and isotonic force clamps were controlled using a computer-interfaced force-position controller (Positron Development, Force Controller, 300-FC1, Inglewood, CA).
For each single muscle fiber experiment, a fiber with a compliance (calculated as FL divided by y-intercept) >10% and/or a decrease in peak force (Po) of >10% was discarded and not used for analysis. The within-fiber test/retest of a single muscle fiber in our lab for the measurements of size, force-power relationships, Po, and contractile velocity was <1%. The coefficients of variation for the force transducer and servomechanical lever mechanism during the timeframe of this investigation was <1%. Following completion of single muscle fiber physiology experiments, each fiber was solubilized in 80 μl of 1% SDS sample buffer and stored at −20°C until assayed for MHC fiber type.
Single Muscle Fiber Analysis
Individual muscle fibers were analyzed for force-velocity relationships and power, peak force (Po), maximal unloaded shortening velocity (Vo), diameter, and fiber type. Experimental procedures were identical to those previously used in our human studies (67, 69).
Single muscle fiber power.
Submaximal isotonic load clamps were performed on each fiber for determination of force-velocity parameters and power. Each fiber segment was fully activated in pCa 4.5 solution and subjected to a series of three isotonic load steps. This procedure was performed at various loads so that each fiber underwent a total of 15–18 isotonic contractions.
For the resultant force-velocity relationships, load was expressed as P/Po (P = force during load clamping, Po = peak isometric force developed before submaximal load clamps). Force and shortening velocity data points were derived from the isotonic contractions and fit by the hyperbolic Hill equation (32). Only individual experiments in which R2 was ≥0.98 were included for analysis.
Fiber peak power was calculated from the fitted force-velocity parameters (Po, Vmax, and a/Po, where a is a force constant and Vmax is the y-intercept). Absolute power (μN·FL/s) was defined as the product of force (μN) and shortening velocity (FL/s). Normalized power (W/l) was defined as the product of normalized force and shortening velocity.
Single muscle fiber Po.
Force and position transducer outputs were amplified and sent to a microcomputer via a Lab-PC+ 16-bit data acquisition board (National Instruments, Austin, TX). Resting force was monitored and then the fiber was maximally activated in pCa 4.5 solution. Peak active force (Po) was determined in each fiber by computer subtraction of the baseline force from the peak force in the pCa 4.5 solution.
Single muscle fiber Vo.
Fiber unloaded shortening velocity (Vo) was measured by the slack-test technique as described by Edman (13). The fiber was fully activated in pCa 4.5 solution and rapidly released to a shorter length, such that force fell to baseline. The fiber shortened, taking up slack, after which force began to redevelop. Then the fiber was placed in pCa 9.0 solution and returned to original length. Computer analysis determined the duration of unloaded shortening, or time between onset of slack and redevelopment of force. Four different activation and length steps (150, 200, 250, and 300 μm; ≤15% of FL) were used for each fiber, with the slack distance plotted as a function of the duration of unloaded shortening. Fiber Vo (FL/s) was calculated by dividing the slope of the fitted-line by the fiber segment length (data were normalized to a sarcomere length of 2.5 μm).
Single muscle fiber diameter.
A video camera (CCD-IRIS, DXC-107A; Sony, Japan) connected to the microscope and computer interface allowed for viewing and storage of single muscle fiber digital images. Fiber diameter was determined from an image taken with the fiber briefly suspended in air (<5 s). Fiber width (diameter) was determined at three points along the segment length of the captured image using NIH public domain software (Scion Image, release Beta 4.0.2, for Windows). For the fiber size-dependent variables (i.e., Po/CSA and normalized power), CSA was determined with the assumption that the fiber forms a cylindrical shape while suspended in air.
Fiber type analysis.
Following the single fiber contractile measurements, the MHC isoform profile was analyzed for each fiber segment using SDS-PAGE. Briefly, samples were run overnight at 4°C on a Hoefer SE 600 gel electrophoresis unit (San Francisco, CA) utilizing a 3.5% (wt/vol) acrylamide stacking gel with a 5% separating gel (74). After electrophoresis, gels were silver stained as described by Giulian et al. (21). MHC isoforms (I, I/IIa, IIa, IIa/IIx, IIx, I/IIa/IIx) of each single muscle fiber were identified according to migration rate as we have previously described (74). A MHC gel image from a Health ABC Study participant is shown in Fig. 1.
Fig. 1.

SDS-PAGE gel image of single muscle fibers from a Health ABC Study participant analyzed for MHC fiber type. Each lane represents a single muscle fiber with arrows representing MHC I and IIa isoforms.
Data Analysis
Single muscle fiber size and performance characteristics from the Health ABC Study participants are presented as means ± SE. Potential differences between size and contractile characteristics of MHC I and IIa fibers were analyzed using dependent two-tailed Student's t-tests with a Bonferroni adjustment for contractile measures. As a result of the descriptive nature of the study, exploratory data analysis (70) was used to examine and compare these data to previous investigations of single muscle fiber function and size.
RESULTS
Single Muscle Fiber Power
The normalized power values of individual MHC I and IIa muscle fibers from The Health ABC Study participants are shown in Fig. 2 alongside individual muscle fibers from two younger cohorts. Additional normalized power comparisons among various healthy, athletic, and unique (spinal cord injured and champion sprint runner) cohorts are shown in Fig. 3. MHC IIa single muscle fibers were 5× more powerful (P < 0.01) than MHC I fibers (Table 2). When power was normalized to cell size, the MHC IIa fibers (17.4 ± 0.8 W/l) were 7.5× more powerful (P < 0.01) than MHC I fibers (2.3 ± 0.1 W/l).
Fig. 2.
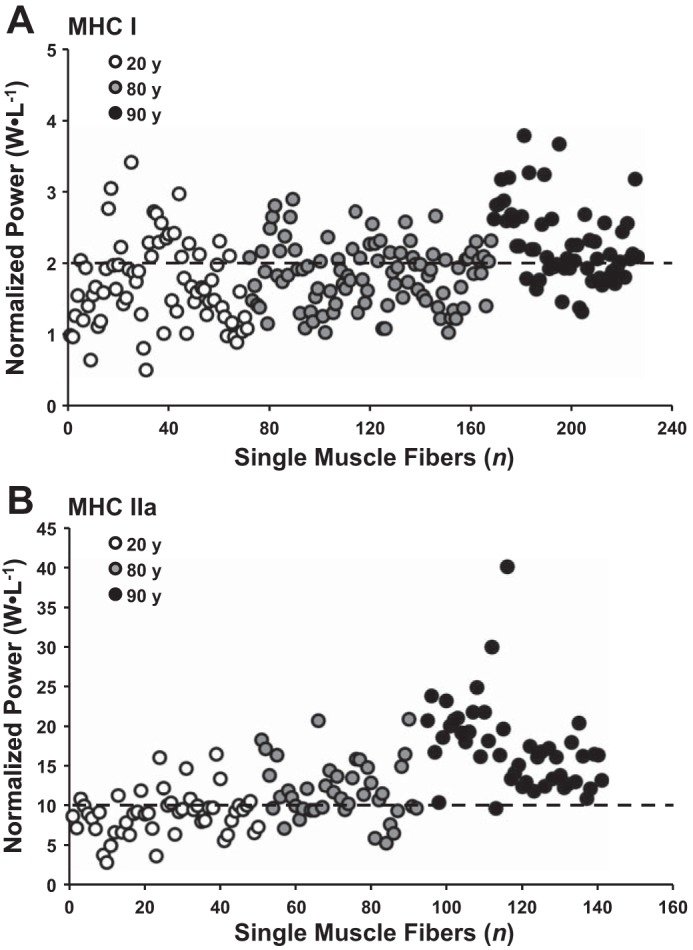
Normalized power (W/l) distribution of MHC I (A) and MHC IIa (B) single muscle fibers from 20-, 80-, and 90-yr-old individuals. Symbols represent individual muscle fibers from 20-yr-old healthy (n = 12, 6F/6M) (67); 80-yr-old healthy (n = 6M) (61); 90-yr-old healthy (n = 3F/2M) (current study). Dotted lines at 2 and 10 W/l represent average normalized power values in a large sample of older men and women (70–82 yr old) for MHC I and IIa fibers, respectively (61). All data were collected in the Human Performance Laboratory at Ball State University using identical procedures and instrumentation.
Fig. 3.
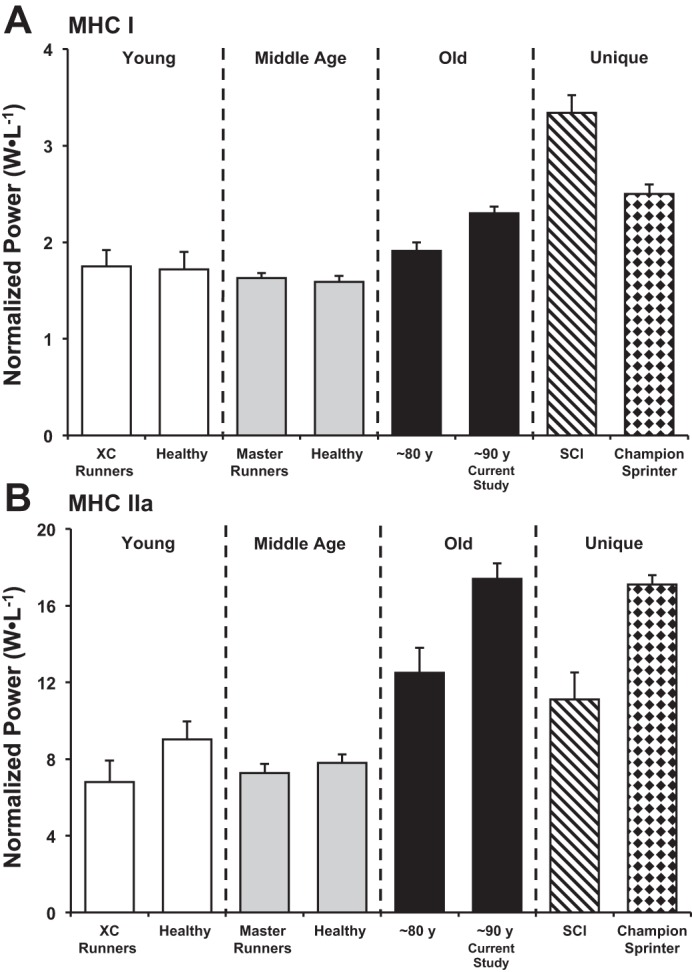
The effect of aging on MHC I (A) and MHC IIa (B) single fiber normalized power. Fiber type-specific normalized power comparisons were made to previous research from our lab using identical procedures. Data retrieved from young cross-country runners (n = 8M) (30); young healthy inactive (n = 12, 6F/6M) (67); middle age master's runners (n = 6M) and healthy inactive (n = 5M) (73); 80 yr old healthy (n = 6M) (61); 90 yr old healthy (n = 5, 3F/2M) (current study); SCI (n = 5M, 33 yr old) (45); Champion sprint runner (68). XC, cross-country; SCI, spinal cord injured.
Table 2.
Vastus lateralis single muscle fiber physiology of MHC I and IIa fibers
| Fiber Type | CSA, μm2 | Po, mN | Po/CSA, kN/m2 | Vo, FL/s | Vmax, FL/s | Power, μN·FL/s |
|---|---|---|---|---|---|---|
| MHC I (n = 58) | 5,576 ± 333 | 0.73 ± 0.05 | 130 ± 2.6 | 1.00 ± 0.03 | 0.75 ± 0.03 | 13.3 ± 1.2 |
| MHC IIa (n = 47) | 4,518 ± 386* | 0.81 ± 0.06 | 186 ± 3.4* | 3.75 ± 0.12* | 3.60 ± 0.12* | 67.2 ± 3.4* |
Values are means ± SE.
Po, peak force; Po/CSA, specific force; Vo, unloaded shortening velocity; Vmax, maximum shortening velocity obtained from isotonic load clamps.
P < 0.05 vs. MHC I value for size and P < 0.01 for function.
Single Muscle Fiber Force and Velocity
There was no difference in peak force (Po) between MHC I and IIa muscle fibers (Table 2). When peak force was adjusted to fiber cross-sectional area (Po/CSA: specific force), specific force of MHC IIa fibers was 41% greater (P < 0.01) than MHC I fibers. Contractile speed (Vo and Vmax) of the MHC IIa muscle fibers was ∼4-fold faster (P < 0.01) than MHC I fibers.
Single Muscle Fiber CSA
Single muscle fiber size data are summarized in Table 2. Cross-sectional area (CSA) of MHC I muscle fibers was 21% larger (P < 0.05) than MHC IIa fibers.
Single Muscle Fiber Analysis
The data presented from Health ABC Study participants were obtained from a total of 123 single muscle fibers. Of these, 105 single fibers were included in the analysis (58 MHC I and 47 MHC IIa). No fibers containing the MHC IIx isoform were found (MHC IIx, IIa/x, or I/IIa/IIx), and only 6 hybrid MHC I/IIa fibers were identified and were thus not included in the analysis. There were 12 additional fibers not included in the analysis due to failed single fiber experiments (n = 11) or inability to be typed with SDS-PAGE (n = 1), a result of low or missing protein in the SDS buffer tube. The low failure rate (<10%) of the single muscle fiber physiology experiments is an indication of the structural integrity of the muscle fibers studied from this cohort and thus reflective of the myocellular characteristics of these individuals.
DISCUSSION
Our comparative results suggest an improvement in single muscle fiber quality with advancing age, especially in MHC IIa fibers. It appears that myocellular and whole muscle quality in humans exhibit disparate responses to the aging process (55). Single muscle fiber quality improvements may serve as a compensatory mechanism to help attenuate deficits in whole muscle size and performance seen in aging individuals (23, 25).
Our laboratory previously reported comparable MHC IIa quality in a cohort of octogenarian and younger sedentary women (53). Comparison of MHC IIa normalized power data from the oldest-old with fibers from healthy 20 and 80 yr olds suggests that single fiber quality is not only preserved but appears to increase with advancing age (Fig. 2B). A typical normalized power output of a MHC IIa muscle fiber is ∼5–12 W/l across various age groups from our laboratory (68) and others (45, 55, 73). Previously, we indicated that 10 W/l represents an average value for MHC IIa normalized power in a large sample of older men and women (70–82 yr olds) (61). This value is greater than what is seen (Fig. 3B) in MHC IIa fibers from young (∼20 yr old) and middle age (∼40 yr old) individuals (6–8 W/l) engaged in vigorous aerobic exercise training (31, 73). Therefore, we interpret a MHC IIa muscle fiber producing >10 W/l to have above-average fiber quality. Ninety-eight percent of the MHC IIa single muscle fibers from the oldest-old had normalized power values above this threshold (Fig. 2B). When extended to a normalized power value > 20 W/l, more than 25% of the MHC IIa fibers from the oldest-old were above this value compared with zero from the young cohort and 5% from younger octogenarians (61).
It has been suggested that the greater single muscle fiber quality observed in elderly individuals is a product of a “survival of the fittest” phenomenon, in which only the best fibers are preserved as fiber number declines (18, 45, 55, 56). Survival of the highest quality muscle fibers is similarly proposed to occur in spinal cord injured (SCI) patients, who undergo significant muscle remodeling due to an absence of neuromuscular recruitment (45) (Fig. 3). However, a number of MHC IIa fibers from the oldest-old produced normalized power values far greater than were observed in any younger individuals (67) or even a champion sprint runner (17.1 ± 0.5 W/l) (68). Thus it seems some adaptive mechanism exists to complement the survival of the fittest and further enhance muscle fiber quality in these elderly individuals.
The superior normalized power of MHC IIa fibers in the oldest-old is in close agreement with the greater specific force-producing capacity of these fibers [42% greater than 20 yr olds and 19% greater than younger octogenarians (61, 67)]. Enhanced muscle quality in MHC IIa fibers of elderly individuals may be related to fiber atrophy, which is characteristic of aging muscle. Greater specific force production in smaller MHC IIa fibers of elderly individuals (∼70 yr olds) was recently observed by Miller et al. (47), who attributed this difference to an age-related slowing of cross-bridge kinetics leading to greater myofilament stiffness and enhanced force transmission. Sluggish cross-bridge kinetics in atrophying MHC IIa fibers may be explained by increased packing density of contractile proteins which is postulated to prolong cross-bridge attachment and increase internal drag (57). Inconsistent with this proposition, MHC IIa contractile velocity of the oldest-old was no slower than that of healthy 20 yr olds (67). This suggests that the MHC IIa fibers in this cohort have developed unique architectural arrangements to overcome the greater internal drag suspected to occur with atrophy (8). Molecular alterations to regulate myosin light chain composition and/or phosphorylation status may also help to attenuate the slower shortening velocity observed in previous aging single fiber investigations (37, 40). Collectively, these aging single muscle fiber comparisons suggest that atrophy with minimal changes in absolute force and shortening velocity contributes to improvements in MHC IIa single fiber quality of the oldest-old.
Equivalent MHC I fiber quality has been demonstrated by previous research from our lab in younger (∼20 yr old) and older (∼80 yr old) men and women (67). Normalized power of MHC I fibers from the oldest-old, a cohort 10 years older than the aforementioned older cohort, was 28% greater than healthy 20 yr olds (67) and similar to younger octogenarians (61) (Fig. 2A). Similar to what was seen in MHC IIa fibers, greater MHC I normalized power is in agreement with improvements in specific force (32% greater in the oldest-old than healthy 20 yr olds) (67). The comparatively modest difference in MHC I quality between younger and older individuals has been shown previously (47), and may be due to the preservation or compensatory increase in MHC I fiber size observed with aging (3, 56). Dissimilar to what was seen in MHC IIa fibers, unloaded shortening velocity of the slow (MHC I) fibers was lower in elderly individuals (34% less than healthy 20 yr olds) (67). Depressed shortening velocity of MHC I fibers is generally a characteristic of habitual use (such as distance running) and has been observed by previous aging single fiber investigations (18, 31, 47). Taken together, these cross-sectional findings suggest that MHC I quality improvements are less than that of MHC IIa muscle fibers, likely due to maintenance of MHC I fiber size and a reduction in shortening velocity.
As a complement to the greater single muscle fiber quality in the oldest-old, very few (<5%) MHC-coexpressing muscle fibers were identified. This is in contrast to previous aging literature (35, 74) demonstrating a far greater (∼30%) occurrence of hybrid fibers in aging muscle. Considerable proportions (∼50%) of MHC-coexpressing muscle fibers have also been observed with extreme disuse such as paralysis (45) and following 90 days of bed rest (20). The small hybrid fiber population observed in aging athletes (1, 34) in conjunction with the substantial reduction of MHC coexpression demonstrated in older adults after exercise training (74) and spinal cord injured patients with functional electrical stimulation (2) suggests that frequent use curtails hybrid fiber expression. Although the number of fibers sampled was relatively small, perhaps the paucity of MHC-coexpressing muscle fibers observed in the oldest-old is a result of apoptotic eradication of hybrid fibers (58). Frequent recruitment of remaining fibers could then explain the lack of MHC coexpression observed in the oldest-old. Thus the substantial fiber loss combined with the habitual physical activity status associated with independently performing tasks of daily living in these individuals may serve as a stimulus to maintain and/or improve the contractile function as well as the phenotype of surviving fibers.
Interpretation of the present findings in light of previously published literature highlights that, while aging appears to have a positive impact on single muscle fiber quality in independent free-living humans, aging rodents demonstrate an inability to preserve contractile protein content (65) and function (43), resulting in lower single fiber quality (33, 44). At the whole muscle level, however, aging is shown to result in a progressive deterioration of both muscle mass and function in humans and animals (49). In aging humans, whole muscle atrophy is mediated by a reduction in fiber number (∼50% from 20 to 80 yr of age) and fast-fiber specific atrophy with a gradual compensatory improvement in quality of remaining fibers (18, 27, 42). In contrast, in the oldest-old rats (30 mo) (59), whole muscle atrophy occurs without a loss of muscle fibers (7, 12), and a decrease in single fiber size and quality is observed (33, 64). Collectively, these data suggest that although findings at the whole muscle level are similar between aging humans and rodents, it appears the underlying muscle biology regulating fiber number and quality between species is perhaps different. This hypothesis is not unprecedented, as additional evidence for interspecies differences in muscle regulation can be found in the absence of the MHC IIb isoform in humans (62). Differential regulation of myocellular size and quality in humans and rodents may be related to the relatively longer duration of the aging process between species (60 yr vs. 18 mo, respectively) but currently remains unresolved and warrants further discussion and research.
Study Limitations
We had a unique opportunity within the Health ABC project to examine muscle function at the cell level in the oldest-old. Obvious limitations to our data set involve the modest sample size for these types of measurements and cross-sectional comparisons. Gaining access to independent living healthy volunteers in this age range is challenging. The homogeneity of this new data set provides merit for our interpretation and guidance for future investigations. We were also limited in the amount of muscle tissue allocated for these single muscle fiber contractile function measurements. Based upon these findings, additional research on the proteins involved in the contractile process with aging is warranted. Indeed, a new paradigm is beginning to emerge that suggests multiple components of skeletal muscle remain intact (26, 53, 67) or are improved with aging beyond the 8th decade of life (47, 56). Very recent evidence suggests calcium kinetics (38) and mitochondrial function (10) may also track a similar pattern to the contractile function measurements presented here.
Summary
To our knowledge, this study was the first to examine single muscle fiber strength, speed, and power in the oldest-old (mean age > 85 yr old). Comparison of single muscle fiber data from this unique survival subset of individuals to various younger populations builds upon previous aging investigations from our lab (53, 61, 67) and others (18, 47, 55) corroborating a continued improvement in muscle fiber quality with advancing age, particularly in MHC IIa fibers. Myocellular quality improvements in surviving MHC IIa fibers appear to be largely a product of preserved contractile function in the presence of substantial fiber atrophy. Additional examinations of the myocellular proteome as well as other aspects of single fiber integrity (mitochondrial capacity and/or fiber architecture) may provide further insight into the cellular adaptations of skeletal muscle in response to the aging process.
GRANTS
This research was supported by National Institute on Aging (NIA) contracts N01-AG-6-2101, N01-AG-6-2103, N01-AG-6-2106; NIA Grants R01-AG-028050 and R01-AG038576; and NINR Grant R01-NR012459. This study was supported in part by the Intramural Research Program of the NIA.
DISCLOSURES
No conflicts of interest, financial or otherwise, are declared by the author(s).
AUTHOR CONTRIBUTIONS
G.J.G., R.S., K.A.M., U.R., K.M., and B.H.G. performed experiments; G.J.G., K.A.M., and S.W.T. analyzed data; G.J.G., K.A.M., U.R., and S.W.T. interpreted results of experiments; G.J.G., K.A.M., and S.W.T. prepared figures; G.J.G. and S.W.T. drafted manuscript; G.J.G., R.S., K.A.M., U.R., K.M., P.C., A.B.N., S.C., T.H., S.K., B.H.G., and S.W.T. approved final version of manuscript; R.S., K.A.M., U.R., K.M., P.C., A.B.N., S.C., T.H., S.K., B.H.G., and S.W.T. edited and revised manuscript; B.H.G. and S.W.T. conception and design of research.
ACKNOWLEDGMENTS
We thank Dr. Gwenaelle Begue for technical assistance with single muscle fiber classification.
REFERENCES
- 1.Andersen JL, Klitgaard H, Saltin B. Myosin heavy chain isoforms in single fibres from m. vastus lateralis of sprinters: influence of training. Acta Physiol Scand 151: 135–142, 1994. [DOI] [PubMed] [Google Scholar]
- 2.Andersen JL, Mohr T, Biering-Sørensen F, Galbo H, Kjaer M. Myosin heavy chain isoform transformation in single fibres from m. vastus lateralis in spinal cord injured individuals: effects of long-term functional electrical stimulation (FES). Pflügers Arch 431: 513–518, 1996. [DOI] [PubMed] [Google Scholar]
- 3.Aniansson A, Grimby G, Hedberg M. Compensatory muscle fiber hypertrophy in elderly men. J Appl Physiol 73: 812–816, 1992. [DOI] [PubMed] [Google Scholar]
- 4.Bean J, Leveille S, Kiely D, Bandinelli S, Guralnik J, Ferrucci L. A comparison of leg power and leg strength within the InCHIANTI study: which influences mobility more? J Gerontol A Biol Sci Med Sci 58: 728–733, 2003. [DOI] [PubMed] [Google Scholar]
- 5.Bergström J. Muscle electrolytes in man. Scand J Clin Lab Invest 68: 1–110, 1962. [Google Scholar]
- 6.Brooks SV, Faulkner JA. Contractile properties of skeletal muscles from young, adult and aged mice. J Physiol 404: 71–82, 1988. [DOI] [PMC free article] [PubMed] [Google Scholar]
- 7.Brown M. Change in fibre size, not number, in ageing skeletal muscle. Age Ageing 16: 244–248, 1987. [DOI] [PubMed] [Google Scholar]
- 8.Claflin DR, Faulkner JA. Shortening velocity extrapolated to zero load and unloaded shortening velocity of whole rat skeletal muscle. J Physiol 359: 357–363, 1985. [DOI] [PMC free article] [PubMed] [Google Scholar]
- 9.D'Antona G, Pellegrino MA, Carlizzi CN, Bottinelli R. Deterioration of contractile properties of muscle fibres in elderly subjects is modulated by the level of physical activity. Eur J Appl Physiol 100: 603–611, 2007. [DOI] [PubMed] [Google Scholar]
- 10.Distefano G, Standley RA, Dubé JJ, Carnero EA, Ritov VB, Stefanovic-Racic M, Toledo FGS, Piva SR, Goodpaster BH, Coen PM. Chronological age does not influence ex-vivo mitochondrial respiration and quality control in skeletal muscle. J Gerontol A Biol Sci Med Sci glw102, 2016. [DOI] [PMC free article] [PubMed] [Google Scholar]
- 11.Doherty T, Brown W. Effects of ageing on the motor unit: a brief review. Can J Appl Physiol 18: 331–358, 1993. [DOI] [PubMed] [Google Scholar]
- 12.Eddinger TJ, Moss RL, Cassens RG. Fiber number and type composition in extensor digitorum longus, soleus, and diaphragm muscles with aging in Fisher 344 rats. J Histochem Cytochem 33: 1033–1041, 1985. [DOI] [PubMed] [Google Scholar]
- 13.Edman K. The velocity of unloaded shortening and its relation to sarcomere length and isometric force in vertebrate muscle fibres. J Physiol 291: 143–159, 1979. [DOI] [PMC free article] [PubMed] [Google Scholar]
- 14.English KL, Paddon-Jones D. Protecting muscle mass and function in older adults during bed rest. Curr Opin Clin Nutr Metab Care 13: 34–39, 2010. [DOI] [PMC free article] [PubMed] [Google Scholar]
- 15.Evans W, Campbell W. Sarcopenia and age-related changes in body composition and functional capacity. J Nutr 123: 465–468, 1993. [DOI] [PubMed] [Google Scholar]
- 16.Fabiato A, Fabiato F. Calculator programs for computing the composition of the solutions containing multiple metals and ligans used for experiments in skinned muscle cells. J Physiol 75: 463–505, 1979. [PubMed] [Google Scholar]
- 17.Frontera WR, Hughes VA, Lutz KJ, Evans WJ. A cross-sectional study of muscle strength and mass in 45- to 78-yr-old men and women. J Appl Physiol 71: 644–650, 1991. [DOI] [PubMed] [Google Scholar]
- 18.Frontera WR, Reid KF, Phillips EM, Krivickas LS, Hughes VA, Roubenoff R, Fielding RA. Muscle fiber size and function in elderly humans: a longitudinal study. J Appl Physiol 105: 637–642, 2008. [DOI] [PMC free article] [PubMed] [Google Scholar]
- 19.Frontera WR, Suh D, Krivickas LS, Hughes VA, Goldstein R, Roubenoff R. Skeletal muscle fiber quality in older men and women. Am J Physiol Cell Physiol 279: C611–C618, 2000. [DOI] [PubMed] [Google Scholar]
- 20.Gallagher P, Trappe S, Harber M, Creer A, Mazzetti S, Trappe T, Alkner B, Tesch P. Effects of 84-days of bedrest and resistance training on single muscle fibre myosin heavy chain distribution in human vastus lateralis and soleus muscles. Acta Physiol Scand 185: 61–69, 2005. [DOI] [PubMed] [Google Scholar]
- 21.Giulian G, Moss R, Greaser M. Improved methodology for analysis and quantitation of proteins on one-dimensional silver-stained slab gels. Anal Biochem 129: 277–287, 1983. [DOI] [PubMed] [Google Scholar]
- 22.Godt R, Lindley B. Influence of temperature upon contractile activation and isometric force production in mechanically skinned muscle fibers of the frog. J Gen Physiol 80: 279–297, 1982. [DOI] [PMC free article] [PubMed] [Google Scholar]
- 23.Goodpaster BH, Carlson CL, Visser M, Kelley DE, Scherzinger A, Harris TB, Stamm E, Newman AB. Attenuation of skeletal muscle and strength in the elderly: The Health ABC Study. J Appl Physiol 90: 2157–2165, 2001. [DOI] [PubMed] [Google Scholar]
- 24.Goodpaster BH, Chomentowski P, Ward BK, Rossi A, Glynn NW, Delmonico MJ, Kritchevsky SB, Pahor M, Newman AB. Effects of physical activity on strength and skeletal muscle fat infiltration in older adults: a randomized controlled trial. J Appl Physiol 105: 1498–1503, 2008. [DOI] [PMC free article] [PubMed] [Google Scholar]
- 25.Goodpaster BH, Park SW, Harris TB, Kritchevsky SB, Nevitt M, Schwartz AV, Simonsick EM, Tylavsky FA, Visser M, Newman AB. The loss of skeletal muscle strength, mass, and quality in older adults: the health, aging and body composition study. J Gerontol A Biol Sci Med Sci 61: 1059–1064, 2006. [DOI] [PubMed] [Google Scholar]
- 26.Gouspillou G, Sgarioto N, Kapchinsky S, Purves-Smith F, Norris B, Pion CH, Barbat-Artigas S, Lemieux F, Taivassalo T, Morais JA, Aubertin-Leheudre M, Hepple RT. Increased sensitivity to mitochondrial permeability transition and myonuclear translocation of endonuclease G in atrophied muscle of physically active older humans. FASEB J 28: 1621–1633, 2014. [DOI] [PubMed] [Google Scholar]
- 27.Grimby G. Muscle performance and structure in the elderly as studied cross-sectionally and longitudinally. J Gerontol A Biol Sci Med Sci 50 Spec No: 17–22, 1995. [DOI] [PubMed] [Google Scholar]
- 28.Grimby G, Saltin B. The ageing muscle. Clin Physiol 3: 209–218, 1983. [DOI] [PubMed] [Google Scholar]
- 29.Guralnik JM, Simonsick EM. Physical disability in older Americans. J Gerontol 48: 3–10, 1993. [DOI] [PubMed] [Google Scholar]
- 30.Harber M, Trappe S. Single muscle fiber contractile properties of young competitive distance runners. J Appl Physiol 105: 629–636, 2008. [DOI] [PubMed] [Google Scholar]
- 31.Harber MP, Gallagher PM, Creer AR, Minchev KM, Trappe SW. Single muscle fiber contractile properties during a competitive season in male runners. Am J Physiol Regul Integr Comp Physiol 287: R1124–R1131, 2004. [DOI] [PubMed] [Google Scholar]
- 32.Hill AV. The heat of shortening and the dynamic constants of muscle. Proc R Soc B 126: 136–195, 1938. [Google Scholar]
- 33.Kim JH, Thompson LV. Inactivity, age, and exercise: single-muscle fiber power generation. J Appl Physiol 114: 90–98, 2013. [DOI] [PMC free article] [PubMed] [Google Scholar]
- 34.Klitgaard H, Bergman O, Betto R, Salviati G, Schiaffino S, Clausen T, Saltin B. Co-existence of myosin heavy chain I and IIa isoforms in human skeletal muscle fibres with endurance training. Pflügers Arch 416: 470–472, 1990. [DOI] [PubMed] [Google Scholar]
- 35.Klitgaard H, Zhou M, Schiaffino S, Betto R, Salviati G, Saltin B. Ageing alters the myosin heavy chain composition of single fibres from human skeletal muscle. Acta Physiol Scand 140: 55–62, 1990. [DOI] [PubMed] [Google Scholar]
- 36.Korhonen MT, Cristea A, Alen M, Hakkinen K, Sipilä S, Mero A, Viitasalo JT, Larsson L, Suominen H. Aging, muscle fiber type, and contractile function in sprint-trained athletes. J Appl Physiol 101: 906–917, 2006. [DOI] [PubMed] [Google Scholar]
- 37.Krivickas LS, Suh D, Wilkins J, Hughes VA, Roubenoff R, Frontera WR. Age- and gender-related differences in maximum shortening velocity of skeletal muscle fibers. Am J Phys Med Rehabil 80: 447–455; quiz 456–447, 2001. [DOI] [PubMed] [Google Scholar]
- 38.Lamboley CR, Wyckelsma VL, Dutka TL, McKenna MJ, Murphy RM, Lamb GD. Contractile properties and sarcoplasmic reticulum calcium content in type I and type II skeletal muscle fibres in active aged humans. J Physiol 593: 2499–2514, 2015. [DOI] [PMC free article] [PubMed] [Google Scholar]
- 39.Larsson L. Morphological and functional characteristics of the ageing skeletal muscle in man. A cross-sectional study. Acta Physiol Scand Suppl 457: 1–36, 1978. [PubMed] [Google Scholar]
- 40.Larsson L, Li X, Frontera WR. Effects of aging on shortening velocity and myosin isoform composition in single human skeletal muscle cells. Am J Physiol Cell Physiol 272: C638–C649, 1997. [DOI] [PubMed] [Google Scholar]
- 41.Lexell J, Henriksson-Larsén K, Winblad B, Sjöström M. Distribution of different fiber types in human skeletal muscles: effects of aging studied in whole muscle cross sections. Muscle Nerve 6: 588–595, 1983. [DOI] [PubMed] [Google Scholar]
- 42.Lexell J, Taylor C, Sjostrom M. What is the cause of the ageing atrophy? Total number, size and proportion of different fiber types studied in whole vastus lateralis muscle from 15- to 83-year old men. J Neurol Sci 84: 275–294, 1988. [DOI] [PubMed] [Google Scholar]
- 43.Lowe DA, Surek JT, Thomas DD, Thompson LV. Electron paramagnetic resonance reveals age-related myosin structural changes in rat skeletal muscle fibers. Am J Physiol Cell Physiol 280: C540–C547, 2001. [DOI] [PubMed] [Google Scholar]
- 44.Lowe DA, Thomas DD, Thompson LV. Force generation, but not myosin ATPase activity, declines with age in rat muscle fibers. Am J Physiol Cell Physiol 283: C187–C192, 2002. [DOI] [PubMed] [Google Scholar]
- 45.Malisoux L, Jamart C, Delplace K, Nielens H, Francaux M, Theisen D. Effect of long-term muscle paralysis on human single fiber mechanics. J Appl Physiol 102: 340–349, 2007. [DOI] [PubMed] [Google Scholar]
- 46.Metter EJ, Conwit R, Tobin J. Age-associated loss of power and strength in the upper extremities in women and men. J Gerontol A Biol Sci Med Sci 52: B267–B276, 1997. [DOI] [PubMed] [Google Scholar]
- 47.Miller MS, Bedrin NG, Callahan DM, Previs MJ, Jennings ME, Ades PA, Maughan DW, Palmer BM, Toth MJ. Age-related slowing of myosin actin cross-bridge kinetics is sex specific and predicts decrements in whole skeletal muscle performance in humans. J Appl Physiol 115: 1004–1014, 2013. [DOI] [PMC free article] [PubMed] [Google Scholar]
- 48.Moss RL. Sarcomere length-tension relations of frog skinned muscle fibres during calcium activation at short lengths. J Physiol 292: 177–192, 1979. [DOI] [PMC free article] [PubMed] [Google Scholar]
- 49.Nair KS. Aging muscle. Am J Clin Nutr 81: 953–963, 2005. [DOI] [PubMed] [Google Scholar]
- 50.Ochala J, Dorer DJ, Frontera WR, Krivickas LS. Single skeletal muscle fiber behavior after a quick stretch in young and older men: a possible explanation of the relative preservation of eccentric force in old age. Pflügers Arch 452: 464–470, 2006. [DOI] [PubMed] [Google Scholar]
- 51.Payne AM, Delbono O. Neurogenesis of excitation-contraction uncoupling in aging skeletal muscle. Exerc Sport Sci Rev 32: 36–40, 2004. [DOI] [PubMed] [Google Scholar]
- 52.Rantanen T, Avlund K, Suominen H, Schroll M, Fandin K, Pertti E. Muscle strength as a predictor of onset of ADL dependence in people aged 75 years. Aging Clin Exp Res 14: 10–15, 2002. [PubMed] [Google Scholar]
- 53.Raue U, Slivka D, Minchev K, Trappe S. Improvements in whole muscle and myocellular function are limited with high-intensity resistance training in octogenarian women. J Appl Physiol 106: 1611–1617, 2009. [DOI] [PMC free article] [PubMed] [Google Scholar]
- 54.Reed R, Pearlmutter L, Yochum K, Meredith K, Mooradian A. The relationship between muscle mass and muscle strength in the elderly. J Am Geriatr Soc 39: 555–561, 1991. [DOI] [PubMed] [Google Scholar]
- 55.Reid KF, Doros G, Clark DJ, Patten C, Carabello RJ, Cloutier GJ, Phillips EM, Krivickas LS, Frontera WR, Fielding RA. Muscle power failure in mobility-limited older adults: preserved single fiber function despite lower whole muscle size, quality and rate of neuromuscular activation. Eur J Appl Physiol 112: 2289–2301, 2012. [DOI] [PMC free article] [PubMed] [Google Scholar]
- 56.Reid KF, Pasha E, Doros G, Clark DJ, Patten C, Phillips EM, Frontera WR, Fielding RA. Longitudinal decline of lower extremity muscle power in healthy and mobility-limited older adults: influence of muscle mass, strength, composition, neuromuscular activation and single fiber contractile properties. Eur J Appl Physiol 114: 29–39, 2014. [DOI] [PMC free article] [PubMed] [Google Scholar]
- 57.Riley DA, Bain JL, Thompson JL, Fitts RH, Widrick JJ, Trappe SW, Trappe TA, Costill DL. Decreased thin filament density and length in human atrophic soleus muscle fibers after spaceflight. J Appl Physiol 88: 567–572, 2000. [DOI] [PubMed] [Google Scholar]
- 58.Rowan SL, Rygiel K, Purves-Smith FM, Solbak NM, Turnbull DM, Hepple RT. Denervation causes fiber atrophy and myosin heavy chain co-expression in senescent skeletal muscle. PLos One 7: e29082, 2012. [DOI] [PMC free article] [PubMed] [Google Scholar]
- 59.Sengupta P. The laboratory rat: relating its age with human's. Int J Prev Med 4: 624–630, 2013. [PMC free article] [PubMed] [Google Scholar]
- 60.Short KR, Vittone JL, Bigelow ML, Proctor DN, Nair KS. Age and aerobic exercise training effects on whole body and muscle protein metabolism. Am J Physiol Endocrinol Metab 286: E92–E101, 2004. [DOI] [PubMed] [Google Scholar]
- 61.Slivka D, Raue U, Hollon C, Minchev K, Trappe S. Single muscle fiber adaptations to resistance training in old (>80 yr) men: evidence for limited skeletal muscle plasticity. Am J Physiol Regul Integr Comp Physiol 295: R273–R280, 2008. [DOI] [PMC free article] [PubMed] [Google Scholar]
- 62.Smerdu V, Karsch-Mizrachi I, Campione M, Leinwand L, Schiaffino S. Type IIx myosin heavy chain transcripts are expressed in type IIb fibers of human skeletal muscle. Am J Physiol Cell Physiol 267: C1723–C1728, 1994. [DOI] [PubMed] [Google Scholar]
- 63.Thom JM, Morse CI, Birch KM, Narici MV. Triceps surae muscle power, volume, and quality in older versus younger healthy men. J Gerontol A Biol Sci Med Sci 60: 1111–1117, 2005. [DOI] [PubMed] [Google Scholar]
- 64.Thompson LV, Brown M. Age-related changes in contractile properties of single skeletal fibers from the soleus muscle. J Appl Physiol 86: 881–886, 1999. [DOI] [PubMed] [Google Scholar]
- 65.Thompson LV, Durand D, Fugere NA, Ferrington DA. Myosin and actin expression and oxidation in aging muscle. J Appl Physiol 101: 1581–1587, 2006. [DOI] [PMC free article] [PubMed] [Google Scholar]
- 66.Tomlinson BE, Irving D. The numbers of limb motor neurons in the human lumbosacral cord throughout life. J Neurol Sci 34: 213–219, 1977. [DOI] [PubMed] [Google Scholar]
- 67.Trappe S, Gallagher P, Harber M, Carrithers J, Fluckey J, Trappe T. Single muscle fibre contractile properties in young and old men and women. J Physiol 552: 47–58, 2003. [DOI] [PMC free article] [PubMed] [Google Scholar]
- 68.Trappe S, Luden N, Minchev K, Raue U, Jemiolo B, Trappe TA. Skeletal muscle signature of a champion sprint runner. J Appl Physiol 118: 1460–1466, 2015. [DOI] [PMC free article] [PubMed] [Google Scholar]
- 69.Trappe S, Williamson D, Godard M, Porter D, Rowden G, Costill D. Effect of resistance training on single muscle fiber contractile function in older men. J Appl Physiol 89: 143–152, 2000. [DOI] [PubMed] [Google Scholar]
- 70.Tukey J. Exploratory Data Analysis. Addison-Wesley, 1977. [Google Scholar]
- 71.Vincent G, Velkoff V. The Next Four Decades: The Older Population in the United States 2010 to 2050, edited by U.S. Department of Commerce EaSA2010, p. 25–1138. [Google Scholar]
- 72.Waters D, Baumgartner R, Garry P. Sarcopenia: current perspectives. J Nutr Health Aging 4: 133–139, 2000. [PubMed] [Google Scholar]
- 73.Widrick JJ, Trappe SW, Costill DL, Fitts RH. Force-velocity and force-power properties of single muscle fibers from elite master runners and sedentary men. Am J Physiol Cell Physiol 271: C676–C683, 1996. [DOI] [PubMed] [Google Scholar]
- 74.Williamson DL, Godard MP, Porter DA, Costill DL, Trappe SW. Progressive resistance training reduces myosin heavy chain coexpression in single muscle fibers from older men. J Appl Physiol 88: 627–633, 2000. [DOI] [PubMed] [Google Scholar]