

World champion master athletes in their ninth decade of life had a greater number of surviving motor units, reduced collateral reinnervation, better neuromuscular transmission stability, and a greater amount of excitable muscle mass compared with age-matched controls. The presumed better maintenance of motor units occurs at a time point when motor unit loss is greatest and the loss of muscle mass becomes functionally relevant, potentially maintaining function and attenuating the deleterious effects of sarcopenia.
Keywords: aging, physical activity, muscle function, master athletes, electromyography, sarcopenia, dynapenia
Abstract
Our group has shown a greater number of functioning motor units (MU) in a cohort of highly active older (∼65 yr) masters runners relative to age-matched controls. Because of the precipitous loss in the number of functioning MUs in the eighth and ninth decades of life it is unknown whether older world class octogenarian masters athletes (MA) would also have greater numbers of functioning MUs compared with age-matched controls. We measured MU numbers and neuromuscular transmission stability in the tibialis anterior of world champion MAs (∼80 yr) and compared the values with healthy age-matched controls (∼80 yr). Decomposition-enhanced spike-triggered averaging was used to collect surface and intramuscular electromyography signals during dorsiflexion at ∼25% of maximum voluntary isometric contraction. Near fiber (NF) MU potential analysis was used to assess neuromuscular transmission stability. For the MAs compared with age-matched controls, the amount of excitable muscle mass (compound muscle action potential) was 14% greater (P < 0.05), there was a trend (P = 0.07) toward a 27% smaller surface-detected MU potential representative of less collateral reinnervation, and 28% more functioning MUs (P < 0.05). Additionally, the MAs had greater MU neuromuscular stability than the controls, as indicated by lower NF jitter and jiggle values (P < 0.05). These results demonstrate that high-performing octogenarians better maintain neuromuscular stability of the MU and mitigate the loss of MUs associated with aging well into the later decades of life during which time the loss of muscle mass and strength becomes functionally relevant. Future studies may identify the concomitant roles genetics and exercise play in neuroprotection.
NEW & NOTEWORTHY
World champion master athletes in their ninth decade of life had a greater number of surviving motor units, reduced collateral reinnervation, better neuromuscular transmission stability, and a greater amount of excitable muscle mass compared with age-matched controls. The presumed better maintenance of motor units occurs at a time point when motor unit loss is greatest and the loss of muscle mass becomes functionally relevant, potentially maintaining function and attenuating the deleterious effects of sarcopenia.
aging is associated with a loss of functioning motor units (MU) (7, 9, 12, 27, 36). The loss of MUs is concomitant with the denervation of muscle, loss of motor axons, and eventual α-motoneuron (MN) death (11, 16). With electrophysiological techniques it is possible to estimate the number of functioning MUs and thus make inferences on the number of surviving MNs in old age. Additionally, we can gain insight into neurophysiological changes associated with aging, such as MU neuromuscular transmission instability (17, 31). Age-related alterations to neuromuscular transmission instability may reflect clinical conditions of neuromuscular transmission disturbance and may represent early axonal denervation (2, 11). Moreover, alterations to electrophysiological measures of MU transmission may indicate MU dysfunction preceding the functionally relevant loss of strength and excitable muscle mass known as sarcopenia (16).
From cross-sectional studies it appears there is a gradual reduction in the number of functioning MUs after the third decade of life until the seventh decade followed by a rapid decline into very old age (26, 28, 32). The early adult loss of MUs does not appear to be associated with weakness or functional decline due to the preservation of muscle mass and strength (28), through the process of collateral reinnervation whereby healthy MNs sprout axons that reinnervate those muscle fibers remaining following the death of a MN. The number of functioning MUs can be estimated (MUNE) electrophysiologically by dividing the mean “electrical” size of surface-detected motor unit potentials (S-MUP) into the corresponding size parameter of the compound muscle action potential (CMAP) (Ref. 36 and Fig. 1). Age-related reductions of 40-60% in the number of functioning MUs have been reported for several human limb muscles, including the biceps brachii (8, 14, 33), extensor digitorum brevis (29), vastus lateralis (31), tibialis anterior (TA) (17, 28, 32, 34), soleus (10, 40), and small intrinsic hand muscles (7, 14, 15).
Fig. 1.

Exemplar data of near fiber MUPTs raster plots created from accelerated data from a subject in the MA group (A) and one in the control group (B). The rasters show sequential firings of motor unit potentials. The NF MUP shimmer plots are an overlay of MU firings from a single MU. NF jiggle values are presented as a percentage.
Our group has reported greater MUNE in individuals with high levels of lifelong physical activity in a muscle that typically demonstrates age-related MU loss (34). We found that masters runners in their seventh decade of life had a similar CMAP and a smaller mean S-MUP compared with their age-matched counterparts. These parameters likely indicate the masters runners have not undergone the same extent of MU remodeling (i.e., MU loss and subsequent collateral reinnervation) as did their age-matched controls. Moreover, cross-sectional studies indicate that the age-related loss of MUs is exacerbated in healthy older adults who are in their eighth and ninth decades of life (28, 32). Thus, the purpose of this study is to compare cross-sectionally, a cohort of masters athletes (MAs) and age-matched controls to answer the important question: if functioning MUs are maintained in a group of MAs in their seventh decade of life, can world class MAs two decades older also show a maintenance of MUs, during a time point in which MU loss is typically greatest, and the loss of muscle mass becomes functionally relevant? We investigated, electrophysiologically, MU number and MU stability in a cohort of some of the world's most successful agers: octogenarian world class MAs. We hypothesized there will be MU remodeling as indicated by changes in the electrophysiological measures of MU stability, and S-MUPs in both groups, albeit less in the MAs. In addition, the MA will have a higher MUNE compared with age-matched controls because of more excitable muscle mass (as indicated by a larger CMAP) through improved collateral reinnervation.
METHODS
Participants.
Participants consisted of 29 (Table 1) elderly males and females with no known neurological, musculoskeletal, metabolic, or cardiovascular health conditions. The MA consisted of track and field athletes ranked in the top four of their respective events at the world masters championships (including 7 current world record holders). Event specialties ranged from sprint and power events to middle and long distance running events (800 m up to marathon). The age- and sex-matched controls were living independently and recruited from the local community. All participants were asked to refrain from unaccustomed and strenuous exercise before testing. This study was approved by the McGill Faculty of Medicine Institutional Review Board for research involving human subjects (A08-M66-12B) and conformed to the Declaration of Helsinki. Informed written consent was obtained from all participants before the study.
Table 1.
Participant characteristics
| Male Controls (n = 9) | Male Athletes (n = 7) | Female Controls (n = 6) | Female Athletes (n = 7) | |
|---|---|---|---|---|
| Age, yr | 82.8 ± 4.5 | 79.4 ± 3.7 | 79.3 ± 3.8 | 79.9 ± 6.2 |
| Height, m | 1.71 ± 0.08† | 1.74 ± 0.07† | 1.53 ± 0.06 | 1.57 ± 0.06 |
| Mass, kg | 77.7 ± 10.8† | 71.2 ± 10.9† | 63.9 ± 11.0 | 52.9 ± 4.5* |
| Dorsiflexion strength, N·m | 22.8 ± 6.8† | 31.6 ± 11.1*† | 12.8 ± 2.7 | 16.5 ± 2.5* |
Data are means ± SD;
n, no. of subjects.
Significant difference between masters athletes and age-matched controls.
Significant difference between sex.
Experimental arrangement.
All procedures were conducted during a single testing session on a Biodex System 3 dynamometer (Biodex Medical Systems, Shirley, NY) using the isometric mode. The hip and knee angle were maintained at 90° while the participants were seated and reclined comfortably. Ankle angle was positioned to 30° of plantar flexion. The foot of the dominant leg (right) was secured to the footplate with two hook and loop inelastic straps (Velcro USA, Manchester, NH) across the toes and the dorsum of the foot, and another strap secured the ankle. The torso of the participant was secured to the Biodex seat back by inelastic straps fastened across the shoulders and waist. To minimize extraneous leg movement, the thigh was supported and stabilized with an inelastic strap. The lateral malleolus was aligned with the dynamometer's axis of rotation.
TA electromyographic data acquisition.
For the present investigation, the TA was selected because of its known loss of MUs with normal adult aging (17, 28, 32, 34) and the role of high levels of activity related to greater MUNE in masters runners (34). Participants performed three dorsiflexion maximal voluntary contractions (MVCs), with at least 3 min of rest between attempts. Each MVC was held for ∼3 s, and participants were provided with real-time visual feedback of their torque output and were verbally encouraged.
Voluntary activation and torque.
Voluntary activation during the second and third MVC attempts was assessed using the interpolated twitch technique (ITT; see Ref. 3). This technique involved supramaximal percutaneous electrical stimulation of the common fibular nerve inferior to the fibular head using a clinical stimulator/EMG system (Neuroscan Comperio system; Neurosoft, El Paso, TX). The amplitude of the interpolated torque electrically evoked during the plateau of the MVC was compared with a resting twitch evoked ∼1 s following the MVC. Voluntary activation (VA) was calculated as a percent using the equation: [1 − (interpolated twitch/resting twitch)] × 100. The ITT ensured the participants were providing a maximal voluntary effort during MVCs to allow comparison of submaximal contraction levels (see below) between groups. Participants were required to achieve 95% VA or greater before continuing with data collection; and, typical for this muscle group (18, 24, 37), this was achieved following familiarization in all participants. The peak torque of the three MVC attempts was taken as the maximal torque amplitude for the participant. All torque signals were collected and sampled online at 500 Hz and stored on the Biodex computer for additional off-line analysis.
Surface EMG signals were recorded from the TA using self-adhering Ag-AgCl electrodes (1 × 3 cm). The active electrode was placed over the TA motor point, ∼7 cm distal to the tibial tuberosity and 2 cm lateral to the anterior border of the TA. This placement was adjusted as needed to maximize TA CMAP amplitude and minimize rise time. The reference electrode was placed over the distal tendon of the TA. A ground electrode was placed over the patella.
Decomposition-based quantitative electromyography (DQEMG) data were acquired using a protocol described in detail elsewhere (13, 39). Intramuscular EMG signals were recorded via a disposable concentric needle electrode (model N53153; Teca, Hawthorne, NY) inserted in the TA, 5–10 mm distal to the active surface electrode. The surface and intramuscular EMG signals were bandpass filtered at 5 Hz to 1 kHz and 10 Hz to 10 kHz, respectively. Surface EMG signals were sampled at 3 kHz; intramuscular EMG signals were sampled at 30 kHz. To evoke the maximum CMAP a bar electrode held distal to the fibular head provided the delivery of supramaximal electrical stimuli to the common fibular nerve. Subsequently, participants matched a target line of 25% MVC, visible on a computer monitor, for all isometric dorsiflexion contractions while the intramuscular needle electrode was inserted and gently manipulated in the muscle to minimize the rise times of the majority of detected motor unit potentials (MUPs). This contraction intensity has been shown to be the most effective intensity for obtaining a representative MUNE in the TA (28). Surface and intramuscular EMG signals were recorded during ∼30 s of sustained steady target torque. Between contractions, the concentric needle electrode was repositioned to ensure sampling of different MUs. These procedures were repeated until at least 20 suitable MUP trains and their respective S-MUPs were acquired.
TA decomposition-based quantitative electromyography analysis.
Decomposed intramuscular EMG signals were reviewed off-line to determine the acceptability of the extracted MUP trains and their corresponding S-MUPs. MUP trains were inspected visually to ensure that their MUP occurrence patterns were consistent with the expected activity of a single MU (consistent firing pattern and interdischarge coefficient of variation of <0.3). Invalid MUP trains and their associated S-MUPs were excluded from further analyses. The DQEMG algorithms estimate a MUP and S-MUP template waveform and automatically place markers related to onset, end, negative peak, and positive peak positions with respect to the MUP template and onset, negative peak onset, end, negative peak, and positive positions with respect to the S-MUP template. All MUP and S-MUP markers were subsequently reviewed visually by the same operator. A MUNE was derived by dividing the negative peak amplitude of the maximal CMAP by the negative peak amplitude of the mean S-MUP.
For the assessment of MUP stability, used to reflect the stability of neuromuscular transmission, MUPs that represent the isolated activity of a single MU were automatically selected by the DQEMG algorithms. The sets of automatically selected isolated MUPs were inspected visually, and any MUPs found to be significantly contaminated by the activity of other MUs were removed. The DQEMG technique described has been shown to possess strong test-retest reliability within individuals (5) and high degrees of intra- and inter-rater reliability in control and clinical populations (2). The investigator was blinded to the status of the participant (MA vs. age-matched controls) during off-line analysis.
Near fiber MUP parameters: near fiber MUP template.
The MUP template provided by the DQEMG algorithms was high-pass filtered using a second-ordered low-pass differentiator (39). The second-order filter equation is: [xt = yt+2 − yt+1 − yt + yt−1] where yt is the sampled raw signal and xt is the sampled filtered signal. Because of the spatial low-pass filtering properties of volume conduction, the resulting near fiber (NF) MUP template waveform is used to focus on characteristics of a MU's muscle fibers in close proximity (within ∼350 μm) to the needle electrode and is defined as a MUP containing contributions from the fibers that are close to the detection surface of the needle electrode. As such, a NF “contribution” is the specific electrophysiological contribution of an individual NF (an individual muscle fiber or small group of MU muscle fibers) to a NF MUP. This methodology is particularly useful for studying variables related to neuromuscular transmission stability (i.e., jitter, jiggle), since it allows for the examination of individual MU waveforms with much less contamination from other more distant MUs compared with signals collected with traditional Butterworth filtering. This is the result of the spatial filtering applied to create NF MUPs, which filters out more distant volume conducted MU activity that could potentially reduce the ability to detect individual muscle fiber activity. Measures of NF MUPs in turn can be used to reflect relative conduction times of muscle fiber action potentials to the electrode detection surface. Further details regarding NF MUP parameters have been described previously (2).
NF parameters.
The following NF parameters were originally described in clinical populations (1, 2), and some have been used in the investigation of normal adult aging (17). NF area is the sum of the absolute values of the NF MUP between the onset and end positions multiplied by the sampling interval (i.e., 1/sampling rate). NF count (NF fiber count) is the number of detected NF contributions to the NF MUP. A positive turn detected in the NF MUP with sufficient symmetry and amplitude is considered a distinct NF contribution. The NF fiber count reflects the density of fibers composing a MU. The maximum NF interval is the maximum time between consecutive detected NF contributions. Large maximum NF interval values may indicate long reinnervating axonal sprouts. NF jiggle (Fig. 1) is a statistic that measures the variability in the shape of consecutive isolated NF MUPs of a MUP train. The statistic is the same as originally applied to traditional MUPs (38). The NF MUPs of a MUP train are created by high-pass filtering each MUP using the same second-ordered low-pass differentiator used to create the NF MUP template. Isolated NF MUPs are selected as described previously (39). NF jitter is the mean consecutive difference of time intervals between a pair of distinct NF contributions found consistently within the NF MUPs of a selection of isolated NF MUPs as described by others (2, 38, 39). Suitable NF contribution pair tracking was confirmed by visual inspection.
Statistical analyses of the data were performed with SPSS version 22 (SPSS, Chicago, IL). Unpaired t-tests were used to compare participant characteristic values. A two-way analysis of variance (sex × activity status) was used to analyze all electrophysiological data. If no interactions were present for sex and activity status, the data were collapsed for sex and compared across activity level using unpaired t-tests. The level of significance was set at P ≤ 0.05. To explore the strength of apparent statistical effects, effect sizes (ES) were calculated using Cohen's d. Pearson product correlations (r) were implemented to test the strength of independent relationships between the NF MUP and MUNE parameters. Descriptive data in the text and Tables 1 and 2 are reported as means ± SD, whereas data reported in Figs. 1–3 are means ± SE.
Table 2.
Neuromuscular transmission stability and near fiber parameters
| Parameter | Masters Athletes | Age-Matched Controls | Difference, % |
|---|---|---|---|
| NF area, kV·s−1·ms−1 | 7.5 ± 2.6 | 8.1 ± 3.8 | |
| NF duration, ms | 4.3 ± 0.8 | 4.8 ± 1.3 | |
| Maximum NF interval, ms | 1.3 ± 0.3 | 1.2 ± 0.3 | |
| NF fiber count, no. | 2.2 ± 0.3 | 2.7 ± 0.7* | −19 |
| NF jiggle, % | 49.8 ± 8.6 | 63.2 ± 13.1* | −21 |
| NF jitter, μs | 47.4 ± 7.8 | 58.2 ± 13.1* | −19 |
Data are means ± SD.
NF, near fiber.
Significant difference between masters athletes and age-matched controls.
Fig. 3.

Relationships between NF jiggle (A), NF jitter and S-MUP (B), NF jiggle (C), and NF jitter and MUNE (D) between MA (open circles) and age-matched controls (gray circles). All relationships were statistically significant (P < 0.01). The participant (88 yr) with the largest mean S-MUP had the lowest MUNE count and also had the highest values for NF jiggle and second highest for NF jitter (black circles). Removing this participant reduces the “r” values slightly, but statistical significance is maintained.
RESULTS
Participant characteristics are presented in Table 1. Voluntary activation, as assessed using the interpolated twitch technique, was >95% for all groups. There was a sex × activity status interaction for dorsiflexion strength; therefore, the strength data were not collapsed across sex. The MA males were 28% stronger compared with age-matched controls (P < 0.01; ES = 1.88), and MA females were 22% stronger compared with age-matched controls (P < 0.01; ES = 1.93). For all other variables listed below there were no interactions or main effects for sex. Therefore, data were collapsed across sex and compared for activity status.
MU number estimates.
The groups did not differ (P > 0.05) in the root mean square (RMS) value of the surface EMG during the targeting contractions (∼25% MVC) expressed as a percentage of MVC-RMS (25–30%), and the mean MU discharge rates did not differ (P > 0.05) between the groups. The negative peak amplitude of the CMAP was 14% larger in the MAs compared with age-matched controls (P < 0.05; ES = 0.98; Fig. 2A), likely indicating a greater amount of excitable muscle mass. The negative peak amplitude of the mean S-MUP was not statistically different across groups. Nonetheless, there was a statistical trend (P = 0.07; ES = 0.67) for the MA group to have a 27% smaller value (Fig. 2B). This may indicate that collateral reinnervation is occurring in the MAs, but the extent to which MUs are being remodeled, as further evidenced by the 20-μV smaller S-MUP, is less than age-matched controls. With a presumed greater amount of excitable muscle mass and less collateral reinnervation, MAs had a 28% greater number of functioning MUs compared with their age-matched counterparts (P < 0.01; ES = 1.14; Fig. 2C).
Fig. 2.
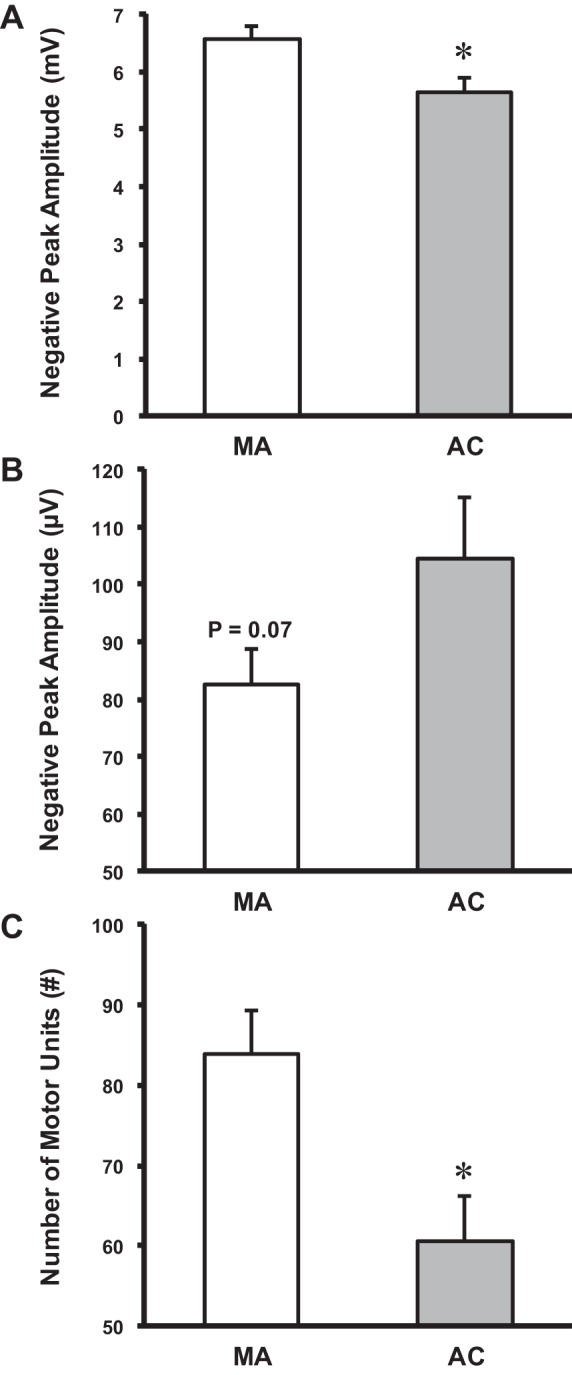
Derived motor unit number estimates (MUNE). A: negative peak amplitude of the compound muscle action potential was higher for the MA compared with the age-matched controls (AC). B: negative peak amplitude of the mean surface motor unit potential (S-MUP) was not significantly different for the MA compared with the age-matched controls. However, there was a trend toward significance. C: MUNEs were higher for the MA compared with the age-matched controls. Mean ± SE. *Significant difference between MA and age-matched controls.
Neuromuscular transmission stability.
NF MUP parameter values are presented in Table 2. MA had similar NF area, duration, and maximum NF interval values compared with age-matched controls (P > 0.05). However, for all other measures of neuromuscular transmission stability, MAs had smaller values compared with age-matched controls: NF fiber counts (−19%, P < 0.05; ES = 0.93), NF jiggle (−21%; P < 0.01; ES = 1.21), and NF jitter values (−19%; P < 0.05; ES = 1.02), indicating greater neuromuscular transmission stability compared with their age-matched counterparts. Additionally, across groups there was a significant positive association between increasing S-MUP amplitude and increases in NF jiggle (r = 0.56; P < 0.01) and NF jitter (r = 0.52; P < 0.01; Fig. 3). Furthermore, as expected, there was a significant negative association with MUNE and NF jiggle (r = −0.59; P < 0.01) and NF jitter (r = −0.55; P < 0.01). These associations would indicate that, as MUs are being remodeled (collateral reinnervation) with increasing MU size, there is less stable neuromuscular transmission in the age-matched controls but not MAs.
DISCUSSION
The purpose of the present study was to investigate whether MUNE was higher in world class octogenarian MA compared with age-matched controls. Using electrophysiological techniques, we investigated the number of functioning MU and neuromuscular transmission stability in a cohort of the world's most successful agers: very old world class MAs. The hypothesis was confirmed. Despite evidence of MU remodeling (S-MUP; Fig. 2B), because of a greater amount of excitable muscle mass as reflected by a larger CMAP (Fig. 2A), there was a higher MUNE in the MAs compared with age-matched controls (Fig. 2C). Additionally, the MAs had greater neuromuscular transmission stability than the controls, as indicated by lower values for NF jitter and NF jiggle, indicating relatively healthier MUs (Table 2). Previously we showed (34) that lifelong high-intensity physical activity may have the potential to limit the loss of functional MUs associated with natural aging well into the seventh decade of life. Our current findings show this is also evident in world class athletes nearly two decades older, a critical time point when MU loss may be a great contributor to the loss of muscle mass (sarcopenia), resulting in substantial strength and functional deficits.
MU number estimation.
Indirect evidence of collateral reinnervation can be found from the size of the negative peak amplitude of the mean S-MUP. In a previous investigation of old masters runners (65 yr), there was a similar-sized S-MUP compared with young adults, whereas age-matched controls had a higher value (34). A higher S-MUP in age-matched controls compared with masters runners and a similar CMAP indicated that the older runners had not undergone substantial collateral reinnervation, and therefore had higher MUNEs than age-matched controls, similar to that of young adults. In the present investigation, we showed that MAs in their ninth decade of life did not differ from age-matched controls for S-MUP values. However, presumably because of a greater amount of excitable muscle mass (CMAP), the MAs had a higher number of functioning MUs. It is important to note there was a trend toward a difference in S-MUP across groups with an ∼20-μV lower value for the MAs, likely indicating that, while there was MN loss and MUs are being remodeled, this process is occurring to a lesser extent in MAs than for age-matched controls (Fig. 2B). Through collateral reinnervation muscle mass is maintained, but subsequently larger MUs are formed as represented by the S-MUP and NF size parameters (Table 2), and it appears these larger MUs in both groups have different neuromuscular transmission stability properties (see below).
Our current findings in “very old” age-matched controls are similar to that of McNeil et al. (28) who investigated MUNE in the TA across young, old, and very old adults ranging from 23 to 89 yr. They found, while there was no difference in strength between the young and old groups, there was a reduction in MUNE. Moreover, in the very old group, there was a significant loss of both strength and MUNE, suggesting that functional significance of MU loss may not occur until after the seventh decade of life. In the present study the male and female MAs both had higher MUNE and higher strength values compared with sex- and age-matched controls (Table 1). Additionally, with advanced aging, the capacity of MUs to continue sprouting is potentially less effective (30), and this could be the case in the age-matched controls. A possible explanation is that reinnervation may not be keeping pace with denervation in advanced age, which could explain the reduced CMAP. By the nature of cross-sectional designs, selection bias can be a limitation. Hence, further research is needed to establish longitudinal changes and whether physical activity can prevent or slow the age-related loss of the number of functional MUs.
NF MUP parameters.
Standard concentric needle EMG can provide detailed information regarding the denervation-reinnervation process underlying age-related MU loss. The integrity of neuromuscular transmission can be identified through variability in the overall shape of consecutively detected NF MUPs and in the relative timings of their significant NF contributions (2, 38). Two key features related to variability in NF MUP shape and in the relative timings of significant NF contributions are jiggle and jitter, respectively (2, 38). Jiggle refers to the variability in overall NF MUP shape from one MU discharge to the next, and jitter refers to the variability of the time intervals between pairs of significant NF contributions across a set of isolated NF MUPs. Increases in both jiggle and jitter have been reported under clinical conditions of neuromuscular transmission disturbance and can reflect early axonal denervation (2, 11).
Our age-matched control NF jiggle results are consistent with two recent investigations specific to aging that found increased NF jiggle in NF MUPs detected in the TA, vastus medialis (77 yr) (17), and vastus lateralis muscles of older adults (71 yr) compared with young (31). The age-matched controls in the present study had higher values of NF jiggle and NF jitter compared with MAs, and this may be reflective of aberrations in muscle fiber action potential propagation, or neuromuscular transmission instability, and could be the result of the development of dysfunctional neuromuscular junctions (NMJs) of newly reinnervated fibers (16). In the present study, NF area was not different across groups, which may be more reflective of intrinsic MU electrophysiological changes than the negative peak area of surface-detected potentials (S-MUP) that were trending but not significantly different between groups. Additionally, we show increased NF count in age-matched controls compared with MA, which is indicative of reinnervation presumably to compensate for prior denervation (i.e., MU remodeling) (6). These electrophysiological measures of grouping are consistent with histological evidence of increased MU homogeneity (i.e., fiber type grouping) in advanced age (16, 21, 25).
It appears that both groups of older adults are experiencing MU remodeling, but the MAs exhibit reduced and more effective reinnervation indicated by smaller S-MUPs and more stable neuromuscular transmission while the age-matched controls present with more extensive remodeling and less stable neuromuscular transmission. This nature of the remodeling for both groups is further characterized by the positive relationships between NF jiggle, NF jitter, and SMUP size, and a negative relationship with MUNE (Fig. 3). Thus, in advanced age, collateral reinnervation seems to result in less healthy MUs. Specifically, a decrease in neuromuscular transmission stability is thought to occur in association with partial loss of innervation by damaged motor axons, or incomplete reinnervation occurring between orphaned muscle fibers and their adopted axonal sprout during the process of collateral reinnervation (38). We suggest that the age-matched controls may have developed less stable new axons during reinnervation, resulting in increased NF jitter and NF jiggle values.
Maintained MU numbers and MU stability.
Lifelong physical activity has been shown to maintain spinal MN and MU numbers in rats (22) and humans (33–35), respectively. The upregulation of neurotrophic factors and sensitivity of the MN via increased neuromuscular activity (19, 20, 22), and maintained sympathetic input to the NMJ (23), may offset age-related MN death. As well, chronic activity into advanced age may have a protective effect at the epigenomic level initiating changes in the methylation landscape of gene promoter pathways associated with MUs (4). Whether thorough exercise training across a lifespan or being born with exceptional genetics is responsible for the MA's exceptional athletic performance, the MAs presented with improved MU survival and reduced and more mature collateral reinnervation with better neuromuscular transmission stability compared with age-matched controls. The challenge for future studies is to explore these key factors and to identify underlying mechanisms.
In conclusion, accompanying the substantial loss of MUs is a progressive loss of contractile muscle mass and impaired whole muscle force generation (28, 32). This time course of degradation is evident in the lower strength values and loss of MUs in the age-matched controls, whereas the MA had higher force production capacity of the ankle dorsiflexors possibly because of not only a maintenance of MU number but more electrophysiologically stable MUs (32). It seems that MU electrophysiological quality is lower in the age-matched controls, as indicated by reduced neuromuscular transmission stability compared with the MAs; how this may influence strength or function is currently unknown. World champion MAs in their ninth decade of life had a greater number of surviving MUs, reduced collateral reinnervation, better preservation of neuromuscular transmission stability, and hence better preservation of excitable muscle mass compared with age-matched controls. The presumed better maintenance of MUs in MAs occurs at a time point when MUNE loss is greatest and the loss of muscle mass and strength becomes functionally relevant, potentially maintaining function and attenuating sarcopenia in this exceptional cohort of older adults. Future studies on the potential neuroprotective effects of exercise in older humans need to identify the concomitant role of genetics and dose dependence of exercise in maintaining neuromuscular structure and function.
GRANTS
Funding support was provided by operating grants from the Canadian Institutes of Health Research (MOP 84408 to T. Taivassalo; MOP 125986 to R. T. Hepple) and Natural Sciences and Engineering Research Council of Canada (no. 180970-2011 to C. L. Rice) and infrastructure support from the Canadian Foundation for Innovation (T. Taivassalo). R. T. Hepple was supported by a Chercheur Boursier Senior award from the Fond de Recherches du Quebec-Sante. G. A. Power was supported by a Banting postdoctoral fellowship (Canadian Institutes for Health Research) and Alberta Innovates Health Solutions.
DISCLOSURES
No conflicts of interest, financial or otherwise, are declared by the authors.
AUTHOR CONTRIBUTIONS
G.A.P., M.D.A., R.T.H., T.T., and C.L.R. conception and design of research; G.A.P. and M.D.A. performed experiments; G.A.P., M.D.A., and K.J.G. analyzed data; G.A.P., M.D.A., K.J.G., D.W.S., T.J.D., R.T.H., and C.L.R. interpreted results of experiments; G.A.P. and K.J.G. prepared figures; G.A.P. drafted manuscript; G.A.P., M.D.A., K.J.G., D.W.S., T.J.D., R.T.H., T.T., and C.L.R. edited and revised manuscript; G.A.P., M.D.A., K.J.G., D.W.S., T.J.D., R.T.H., T.T., and C.L.R. approved final version of manuscript.
ACKNOWLEDGMENTS
We thank all of the participants in this study and members of the McGill Muscle Aging Diagnostics Lab for assistance in participant recruitment. We thank Drs. Anthony Vandervoort, Brian Dalton, and Chris McNeil for discussions pertaining to the age-related loss of MUs.
REFERENCES
- 1.Allen MD, Choi IH, Kimpinski K, Doherty TJ, Rice CL. Motor unit loss and weakness in association with diabetic neuropathy in humans. Muscle Nerve 48: 298–300, 2013. [DOI] [PubMed] [Google Scholar]
- 2.Allen MD, Stashuk DW, Kimpinski K, Doherty TJ, Hourigan ML, Rice CL. Increased neuromuscular transmission instability and motor unit remodelling with diabetic neuropathy as assessed using novel near fibre motor unit potential parameters. Clin Neurophys 126: 794–802, 2015. [DOI] [PubMed] [Google Scholar]
- 3.Belanger AY, McComas AJ. Extent of motor unit activation during effort. J Appl Physiol 51: 1131–1135, 1981. [DOI] [PubMed] [Google Scholar]
- 4.Bigot A, Duddy WJ, Ouandaogo ZG, Negroni E, Mariot V, Ghimbovschi S, Harmon B, Wielgosik A, Loiseau C, Devaney J, Dumonceaux J, Butler-Browne G, Mouly V, Duguez S. Age-associated methylation suppresses SPRY1, leading to a failure of re-quiescence and loss of the reserve stem cell pool in elderly muscle. Cell Reports 13: 1172–1182, 2015. [DOI] [PubMed] [Google Scholar]
- 5.Boe SG, Stashuk DW, Doherty TJ. Within-subject reliability of motor unit number estimates and quantitative motor unit analysis in a distal and proximal upper limb muscle. Clin Neurophys 117: 596–603, 2006. [DOI] [PubMed] [Google Scholar]
- 6.Bril V, Werb MR, Greene DA, Sima AA. Single-fiber electromyography in diabetic peripheral polyneuropathy. Muscle Nerve 19: 2–9, 1996. [DOI] [PubMed] [Google Scholar]
- 7.Brown WF. A method for estimating the number of motor units in thenar muscles and the changes in motor unit count with ageing. J Neurol Neurosurg Psychiatry 35: 845–852, 1972. [DOI] [PMC free article] [PubMed] [Google Scholar]
- 8.Brown WF, Strong MJ, Snow R. Methods for estimating numbers of motor units in biceps-brachialis muscles and losses of motor units with aging. Muscle Nerve 11: 423–432, 1988. [DOI] [PubMed] [Google Scholar]
- 9.Campbell MJ, McComas AJ, Petito F. Physiological changes in ageing muscles. J Neurol Neurosurg Psychiatry 36: 174–182, 1973. [DOI] [PMC free article] [PubMed] [Google Scholar]
- 10.Dalton BH, McNeil CJ, Doherty TJ, Rice CL. Age-related reductions in the estimated numbers of motor units are minimal in the human soleus. Muscle Nerve 38: 1108–1115, 2008. [DOI] [PubMed] [Google Scholar]
- 11.Deschenes MR. Motor unit and neuromuscular junction remodeling with aging. Curr Aging Sci 4: 209–220, 2011. [DOI] [PubMed] [Google Scholar]
- 12.Doherty TJ. Invited review: Aging and sarcopenia. J Appl Physiol 95: 1717–1727, 2003. [DOI] [PubMed] [Google Scholar]
- 13.Doherty TJ, Stashuk DW. Decomposition-based quantitative electromyography: methods and initial normative data in five muscles. Muscle Nerve 28: 204–211, 2003. [DOI] [PubMed] [Google Scholar]
- 14.Doherty TJ, Vandervoort AA, Taylor AW, Brown WF. Effects of motor unit losses on strength in older men and women. J Appl Physiol 74: 868–874, 1993. [DOI] [PubMed] [Google Scholar]
- 15.Drey M, Krieger B, Sieber CC, Bauer JM, Hettwer S, Bertsch T, Group DS. Motoneuron loss is associated with sarcopenia. J Am Med Dir Assoc 15: 435–439, 2014. [DOI] [PubMed] [Google Scholar]
- 16.Hepple RT, Rice CL. Innervation and neuromuscular control in ageing skeletal muscle. J Physiol 594: 1965–1978, 2016. [DOI] [PMC free article] [PubMed] [Google Scholar]
- 17.Hourigan ML, McKinnon NB, Johnson M, Rice CL, Stashuk DW, Doherty TJ. Increased motor unit potential shape variability across consecutive motor unit discharges in the tibialis anterior and vastus medialis muscles of healthy older subjects. Clin Neurophys 126: 2381–2389, 2015. [DOI] [PubMed] [Google Scholar]
- 18.Jakobi JM, Rice CL. Voluntary muscle activation varies with age and muscle group. J Appl Physiol 93: 457–462, 2002. [DOI] [PubMed] [Google Scholar]
- 19.Jasmin BJ, Lavoie PA, Gardiner PF. Fast axonal transport of acetylcholinesterase in rat sciatic motoneurons is enhanced following prolonged daily running, but not following swimming. Neurosci Lett 78: 156–160, 1987. [DOI] [PubMed] [Google Scholar]
- 20.Kalmar JM, Button DC, Gardiner K, Cahill F, Gardiner PF. Caloric restriction does not offset age-associated changes in the biophysical properties of motoneurons. J Neurophysiol 101: 548–557, 2009. [DOI] [PubMed] [Google Scholar]
- 21.Kanda K, Hashizume K. Changes in properties of the medial gastrocnemius motor units in aging rats. J Neurophysiol 61: 737–746, 1989. [DOI] [PubMed] [Google Scholar]
- 22.Kanda K, Hashizume K. Effects of long-term physical exercise on age-related changes of spinal motoneurons and peripheral nerves in rats. Neurosci Res 31: 69–75, 1998. [DOI] [PubMed] [Google Scholar]
- 23.Khan MM, Lustrino D, Silveira WA, Wild F, Straka T, Issop Y, O'Connor E, Cox D, Reischl M, Marquardt T, Labeit D, Labeit S, Benoit E, Molgo J, Lochmuller H, Witzemann V, Kettelhut IC, Navegantes LC, Pozzan T, Rudolf R. Sympathetic innervation controls homeostasis of neuromuscular junctions in health and disease. Proc Natl Acad Sci USA In Press, 2016. [DOI] [PMC free article] [PubMed] [Google Scholar]
- 24.Lanza IR, Towse TF, Caldwell GE, Wigmore DM, Kent-Braun JA. Effects of age on human muscle torque, velocity, and power in two muscle groups. J Appl Physiol 95: 2361–2369, 2003. [DOI] [PubMed] [Google Scholar]
- 25.Lexell J, Downham D, Sjostrom M. Distribution of different fibre types in human skeletal muscles. Fibre type arrangement in m vastus lateralis from three groups of healthy men between 15 and 83 years. J Neurol Sci 72: 211–222, 1986. [DOI] [PubMed] [Google Scholar]
- 26.McComas AJ. Invited review: motor unit estimation: methods, results, and present status. Muscle Nerve 14: 585–597, 1991. [DOI] [PubMed] [Google Scholar]
- 27.McComas AJ, Fawcett PR, Campbell MJ, Sica RE. Electrophysiological estimation of the number of motor units within a human muscle. J Neurol Neurosurg Psychiatry 34: 121–131, 1971. [DOI] [PMC free article] [PubMed] [Google Scholar]
- 28.McNeil CJ, Doherty TJ, Stashuk DW, Rice CL. Motor unit number estimates in the tibialis anterior muscle of young, old, and very old men. Muscle Nerve 31: 461–467, 2005. [DOI] [PubMed] [Google Scholar]
- 29.Murga Oporto L, Menendez-de Leon C, Bauzano Poley E, Nunez-Castain MJ. Statistical (Poisson) motor unit number estimation Methodological aspects and normal results in the extensor digitorum brevis muscle of healthy subjects. Rev Neurol 36: 601–604, 2003. [PubMed] [Google Scholar]
- 30.Pestronk A, Drachman DB, Griffin JW. Effects of aging on nerve sprouting and regeneration. Exp Neurol 70: 65–82, 1980. [DOI] [PubMed] [Google Scholar]
- 31.Piasecki M, Ireland A, Stashuk D, Hamilton-Wright A, Jones DA, McPhee JS. Age-related neuromuscular changes affecting human vastus lateralis. J Physiol In press. [DOI] [PMC free article] [PubMed] [Google Scholar]
- 32.Power GA, Allen MD, Booth WJ, Thompson RT, Marsh GD, Rice CL. The influence on sarcopenia of muscle quality and quantity derived from magnetic resonance imaging and neuromuscular properties. Age 36: 1377–1388, 2014. [DOI] [PMC free article] [PubMed] [Google Scholar]
- 33.Power GA, Dalton BH, Behm DG, Doherty TJ, Vandervoort AA, Rice CL. Motor unit survival in lifelong runners is muscle dependent. Med Sci Sports Exerc 44: 1235–1242, 2012. [DOI] [PubMed] [Google Scholar]
- 34.Power GA, Dalton BH, Behm DG, Vandervoort AA, Doherty TJ, Rice CL. Motor unit number estimates in masters runners: use it or lose it? Med Sci Sports Exerc 42: 1644–1650, 2010. [DOI] [PubMed] [Google Scholar]
- 35.Power GA, Dalton BH, Doherty TJ, Rice CL. If you don't use it you'll likely lose it. Clin Physiol Funct Imaging In press. [DOI] [PubMed] [Google Scholar]
- 36.Power GA, Dalton BH, Rice CL. Human neuromuscular structure and function in old age: a brief review. J Sport Health Sci 2: 215–226, 2013. [DOI] [PMC free article] [PubMed] [Google Scholar]
- 37.Power GA, Dalton BH, Rice CL, Vandervoort AA. Power loss is greater following lengthening contractions in old versus young women. Age 34: 737–750, 2012. [DOI] [PMC free article] [PubMed] [Google Scholar]
- 38.Stalberg EV, Sonoo M. Assessment of variability in the shape of the motor unit action potential, the “jiggle,” at consecutive discharges. Muscle Nerve 17: 1135–1144, 1994. [DOI] [PubMed] [Google Scholar]
- 39.Stashuk DW. Decomposition and quantitative analysis of clinical electromyographic signals. Med Eng Phys 21: 389–404, 1999. [DOI] [PubMed] [Google Scholar]
- 40.Vandervoort AA, McComas AJ. Contractile changes in opposing muscles of the human ankle joint with aging. J Appl Physiol 61: 361–367, 1986. [DOI] [PubMed] [Google Scholar]