Abstract
Background
Acute cellular rejection (ACR) is one of the main factors in transplanted organ failure in liver transplantation. A precise marker for diagnosing or predicting rejection is not currently available; therefore, invasive liver biopsy is standard procedure. To develop a noninvasive method for precise diagnosis of ACR, we evaluated autoantibodies from patient sera as potential biomarkers using protein microarrays (seromics).
Methods
Sera from hepatitis C virus–positive ACR patients were compared to three hepatitis C virus cirrhosis control groups and healthy volunteers. The control groups consisted of 2 no-ACR groups obtained on postoperative day 28 and 1 year after transplantation and a preoperative group obtained 1 day before transplantation. For validation, we evaluated whether the candidate antibodies can distinguish ACR from other types of liver dysfunction after liver transplantation using enzyme-linked immunosorbent assay.
Results
Seromic analysis by weighted average difference (WAD) ranking and Mann-Whitney U test revealed a significant increase of 57 autoantibodies in the sera of ACR patients with liver dysfunction. Among the 57 candidates, autoantibodies to charged multivesicular body protein 2B, potassium channel tetramerization domain containing 14, voltage gated subfamily A regulatory beta subunit 3, and triosephosphate isomerase 1 were regarded as potential biomarkers of ACR after liver transplantation. Using 20 ACR patients with variable backgrounds for validation, the autoantibodies to charged multivesicular body protein 2B and triosephosphate isomerase 1 were significantly increased in ACR patients compared to other control groups.
Conclusions
A panel of autoantibodies identified by seromics as potential noninvasive biomarkers was clinically useful for diagnosing ACR after liver transplantation.
Efficient immunosuppressive therapy and improved surgical techniques have developed liver transplantation as a well-established and life-saving treatment for various end-stage liver diseases or acute liver failure.1 However, according to the databases of the United Network for Organ Sharing, the short-term operative outcomes of liver transplantation are not adequate with 1-year survival rates of approximately 80%. Acute cellular rejection (ACR) is one of the main causes of liver dysfunction (LD) after liver transplantation, occurring 30% to 70% of transplanted patients and potentially leading to allograft failure.2–6 Therefore, accurate diagnosis of ACR is critical for saving the transplanted graft and increasing the lifespan of patients. Clinical assessment and histopathological diagnosis of liver biopsies have been the standard for accurate diagnosis of ACR after liver transplantation. Nevertheless, liver biopsy is invasive with moderate to severe complications, implying that transfusion or interventional therapies occur in up to 5% of cases.7 Laboratory tests are commonly used as less invasive methods of monitoring allograft rejection, but they are not specific to rejection and are often elevated in other types of LD, such as ischemic/reperfusion injury, cholangitis, and drug toxicity. Therefore, a specific diagnostic marker that can easily monitor immune status without invasive procedures is needed.
Microarray analysis is frequently used to perform high-throughput analysis of gene expression to study organ transplantation in mouse, rat, and human materials.8–13 Because of the unstable and rapidly degradable nature of mRNA, proteomic analysis may have advantages in identifying a stable molecular diagnostic marker. Several studies have identified molecular markers in serum that predict ACR. Massoud et al14 examined serum C4 levels in proteomic analysis and correlated them with ACR in liver transplantation using enzyme-linked immunosorbent assay (ELISA). Seromics allows the detection of specific serum antibodies against targets during the course of the disease, such as autoimmunity or cancer.15–31 Thus, we hypothesized that particular serum antibodies against molecules related to ACR may be upregulated after transplantation and can be used to monitor the condition.
In this study, we performed seromics to detect antibodies that are regulated in the ACR process. The analysis identified 57 candidate autoantibodies against specific antigens that increase in ACR after liver transplantation. In addition, 4 of the 57 autoantibodies were validated by ELISA using sera from patients with or without ACR. The results suggest that the autoantibodies to charged multivesicular body protein 2B (CHMP2B) and triosephosphate isomerase (TPI1) are promising diagnostic markers of ACR.
MATERIALS AND METHODS
The protocol of this study was approved by the Human Subjects Review Committee of Osaka University. The diagram of experiments included is shown as Figure 1.
FIGURE 1.
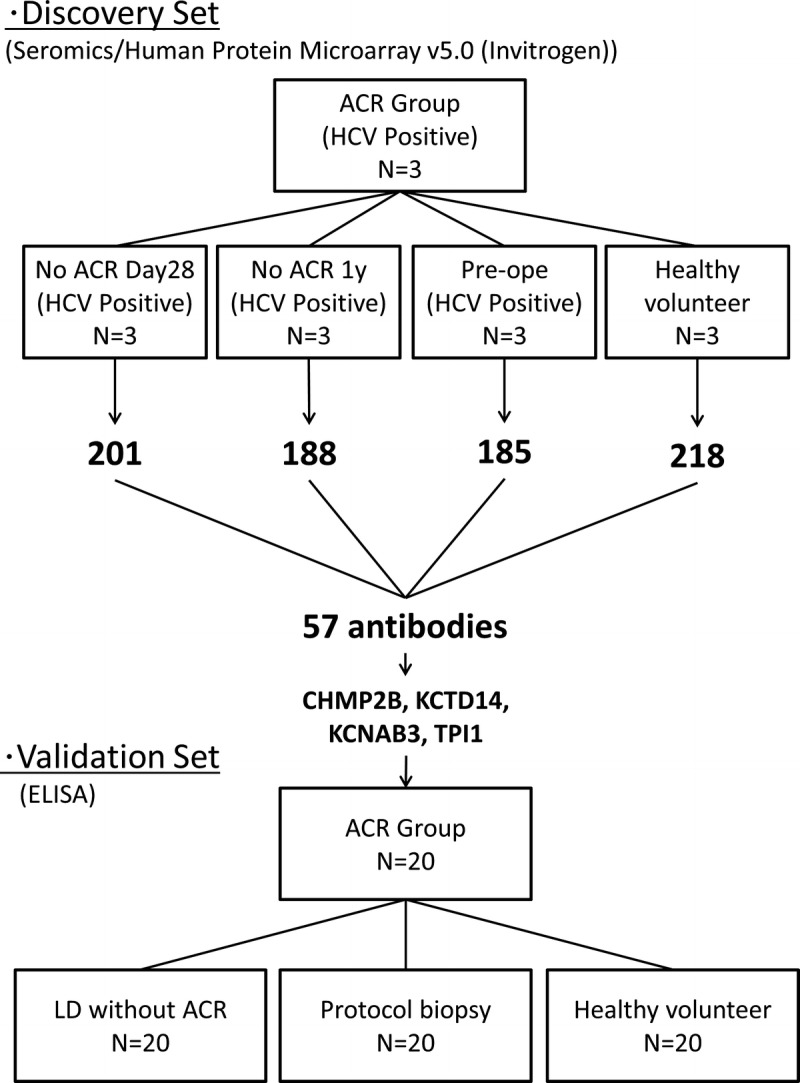
The diagram of experiments.
Patients and Sample Collection
From 2000 to 2013, 125 patients underwent liver transplantation at Osaka University. Sera samples were obtained before and after surgery. Hepatitis C virus (HCV) infection was the leading cause of end-stage liver disease and indication for liver transplantation among these patients. Therefore, we initially selected sera samples from HCV-positive recipients who developed LD after transplantation. LD was defined as elevated levels of total bilirubin (>2.0 mg/dL), aspartate aminotransferase (AST) (>40 IU/L), and/or alanine aminotransferase (ALT) (>40 IU/L).
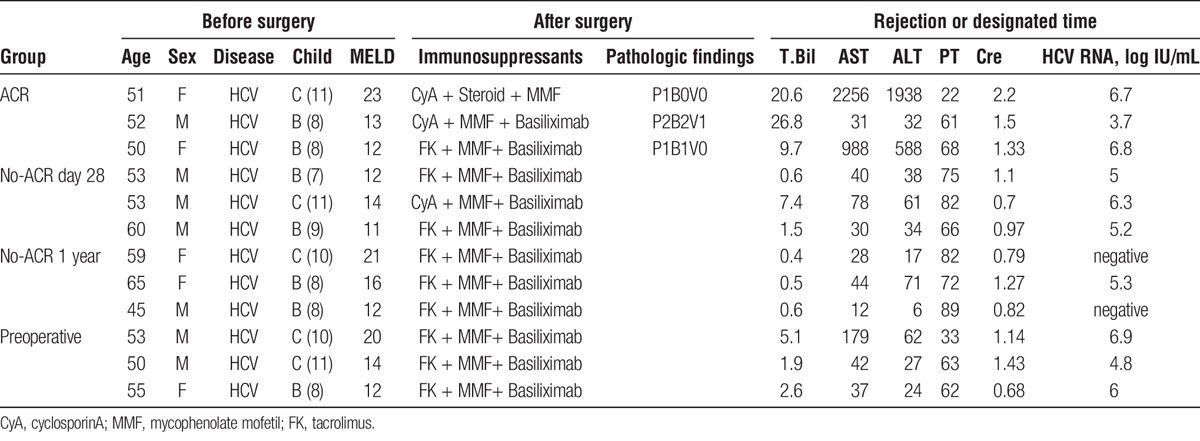
As a discovery set for seromic analysis, 3 sera samples were selected from patients who were diagnosed with ACR and LD by histopathological examination based on Banff criteria (ACR group). These patients showed good response to antirejection therapy, such as steroid therapy. The samples were gathered at the time when they were diagnosed ACR. Three distinct control groups of patients with HCV were selected for the discovery set. These groups consisted of 3 sera samples from distinct HCV-positive recipients without LD or ACR. In the no-ACR day 28 group, the samples were obtained on postoperative day (POD) 28. In the no-ACR 1 year group, the samples were obtained 1 year after liver transplantation. In preoperative group, the samples were obtained 1 day before transplantation. We also prepared a healthy volunteer group of 3 sera samples. In this analysis, we try to generate a hypothesis that specific autoantibodies were elevated in sera during ACR. The details are described in Table 1.
TABLE 1.
Clinical information on patients who underwent microarray analysis
To verify the candidate autoantibodies selected in the discovery set model, we evaluated the expression of autoantibodies in the sera of patients with LD after liver transplantation for various causes. We classified these recipients into 2 groups, LD with ACR (ACR group) and LD without ACR (LD without ACR group), according to Banff classification by histopathological examination. ACR episodes were confirmed by histological findings and responses to antirejection therapy. For a comparison, we sampled up the sera from recipients without liver dysfunction at POD 28 or protocol liver biopsy (protocol biopsy group) and from healthy volunteers. Each group consisted of 20 patients.
Seromic Microarray
To identify significant autoantibodies, present at different concentrations in patients with ACR after transplantation, we performed the microarray analysis using serum samples from HCV-positive transplant recipients with ACR and control groups. ProtoArrays microarrays (v4.0; Invitrogen) were used to identify candidate autoantibodies to predict ACR according to the manufacturer's instructions. Respective sera were diluted 1:500 in washing buffer (0.1% Tween 20, 1% bovine serum albumin in phosphate buffered saline (PBS)). After blocking for an hour, the arrays were incubated with diluted sera for 90 minutes at 4°C in Quadriperm dishes (Greiner Bio One) using a horizontal shaker (50 rpm). After washing, the arrays were incubated with 1:2000 diluted Alexa Fluor 647 goat antihuman IgG for 90 minutes at 4°C to detect binding of IgG. The arrays were scanned at 10-μm resolution using a microarray scanner (Axon 4200AL with GenePix Pro Software; Molecular Devices). Fluorescent images were saved as 16-bit tif files and analyzed by GenePix. The median intensity of each spot in relative fluorescence units was recorded.
Analysis of the Seromics Data
Data from arrays were adjusted and normalized as described previously.30,31 All values from each array were ranked and replaced by the average percentages for antigens, resulting in a data distribution that allowed interarray comparisons. To identify differential expression of individual antibodies, we evaluated each antibody titer on a logarithmic scale. To select the more significant candidate autoantibodies, we used the weighted average difference (WAD) ranking,32 a new type of statistical process based on the fold-change method that uses not only the average difference, but also the average signal intensity in arrays. The highly expressed molecules are then highly ranked. This method can exclude noise or nonspecific intensity of array data and avoid picking up candidates by a random chance. We also used the Mann-Whitney U test.
RNA Extraction and Quantitative Real-Time Polymerase Chain Reaction
To confirm the quantities of the target proteins of candidate autoantibodies, we performed quantitative real-time polymerase chain reaction (qRT-PCR) with pooled normal livers and lymphocytes from our hospital. Total RNA was extracted using the RNeasy Mini Kit (QIAGEN), and 1 μg subjected to reverse transcription. cDNA was generated using the Superscript III Reverse Transcriptase kit (Invitrogen) and oligo(dT) primer. A TaqMan probe-based qRT-PCR assay was performed to quantitate the cDNA (Applied Biosystems). All reactions were performed according to the manufacturer's instructions.
ELISA
For validation of the microarray results, sera samples were analyzed by ELISA for seroactivity to candidate recombinant proteins CHMP2B, potassium channel tetramerization domain containing 14 (KCTD14), voltage gated subfamily A regulatory beta subunit 3 (KCNAB3), and TPI1. Sera samples were diluted 1:100. Low volume 96-well plates (Corning) coated overnight with candidate proteins (1 μg/mL) at 4°C were blocked for 2 hours at room temperature with PBS containing 1% bovine serum albumin. After overnight incubation, the plates were washed thoroughly with PBS containing 0.2% Tween 20 and rinsed with PBS (BioTek ELx405 automated washer). Sera IgG bound to antigens were detected by monoclonal antibody conjugated to alkaline phosphatase (Southern Biotech) with ATTOPHOS substrate (Fisher Scientific). Absorbance was measured by a Cytofluor Series 4000 fluorescence reader (PerSeptive Biosystems).
To compare the autoantibody titers more precisely, we prepared rabbit polyclonal IgG as the positive control recommended for the detection of each target protein. We diluted the rabbit IgG to several densities and measured the optical density of each to draw a standard curve.
Statistical Analysis
Values were expressed as median and range. Differences were tested by the exact χ2 test or Student t test. Cutoff values for diagnosis were assessed by calculating the area under the receiver operator characteristic (ROC) curve. The sensitivity and specificity were calculated using the defined cutoff value. Correlation analysis between the 2 variables was performed using Pearson correlation coefficient. P values less than 0.01 were considered significant.
RESULTS
Microarray Analysis Identified 57 Autoantibodies as Candidate Biomarkers of ACR
We compared the microarray analysis of serum samples from the ACR group with those of the 4 different control groups. Autoantibodies were considered upregulated if there was a two-fold difference between the ACR group and control groups.
Among the more than 9000 autoantibodies scanned, 201 were upregulated in the ACR group compared with the no-ACR day 28 group. One hundred eighty-eight upregulated in the ACR group compared with the no-ACR 1 year group, 185 upregulated in the ACR group compared with the preoperative group, and 218 upregulated compared with the healthy volunteer group (Figure 2A). Fifty-seven of the antibodies were upregulated compared to all of the control groups (Figure 2B).
FIGURE 2.
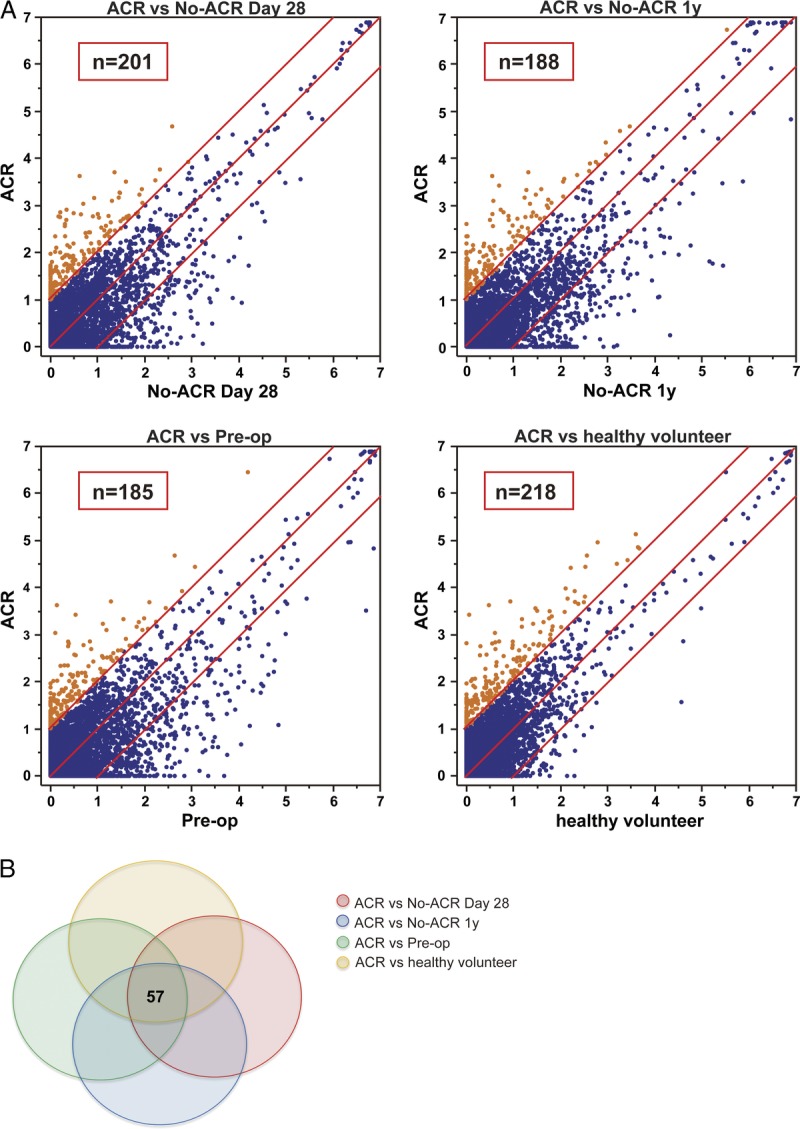
Expression and relationship of seroreactivity to target protein in seromic array. A, Scatter plot of seroreactivity to target protein in seromic microarrays. Sera samples were taken from the ACR patients (n = 3), patients in the no-ACR day 28 group (n = 3; samples were taken from patients without ACR or liver dysfunction on POD 28), and no-ACR 1 year group (n = 3; samples were taken from patients without ACR or liver dysfunction on POD one year), and subjects in the healthy volunteer group (n = 3). Each point represents the mean reactivity of triplicate samples to one antigen, indicating the strength of the antibody response. If the ratio of ACR to the respective control groups is greater than 2, the serum is considered to react significantly in ACR. Points appear in orange and numbers are indicated as shown. B, Outline of the autoantibody expression and heat map of the 57 selected autoantibodies.
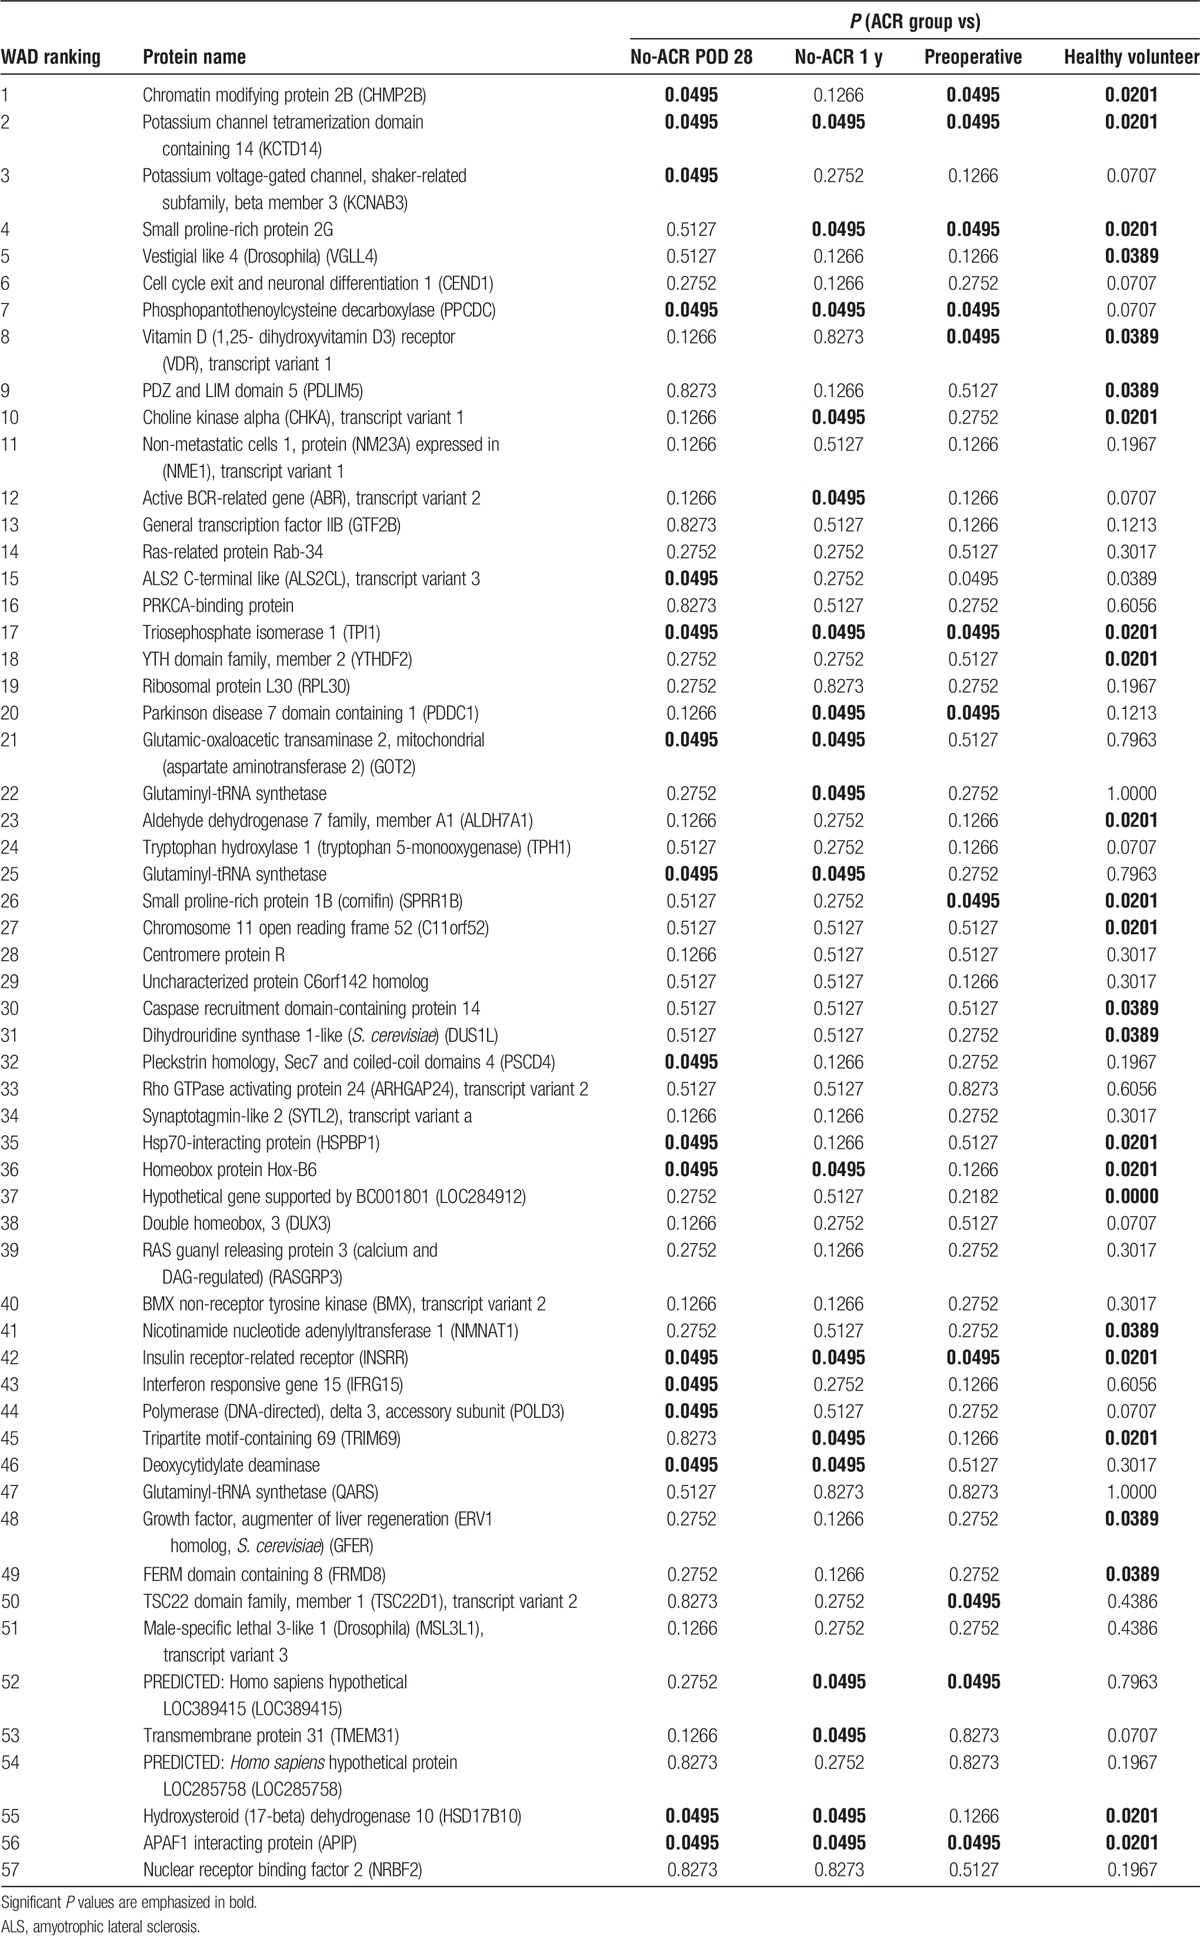
To select 57 superior candidate antigens, we applied the Mann-Whitney U test in addition to WAD ranking, which counts both fold change and the respective intensity of the antibodies (Table 2). The fold-change ranking may select candidates with low expression, but we used these methods to obtain candidates with significantly high expression in the ACR group. We focused on the top 3 antibodies based on WAD ranking: CHMP2B, KCTD14, and KCNAB3. We also focused on TPI1, which is highly ranked based on WAD and significantly increased based on the Mann-Whitney U test. We evaluated the potential significance as a biomarker of ACR after liver transplantation.
TABLE 2.
The 57 autoantibodies upregulated in ACR
Target mRNA of Candidate Autoantibodies Is Widely Distributed in Normal Liver and Lymphocytes
To confirm the distributions of the target mRNAs of the candidate antigens, we performed qRT-PCR using pooled samples of normal liver and lymphocytes from our hospital. As shown in Figure 3, all target mRNAs were expressed in both liver cells and lymphocytes. The expression level of each target mRNA was different in distinct cases, especially in the liver. Furthermore, the target genes of the candidate autoantibodies are expressed systemically according to the FANTOM5 deep CAGE database, which is consistent with our results.
FIGURE 3.
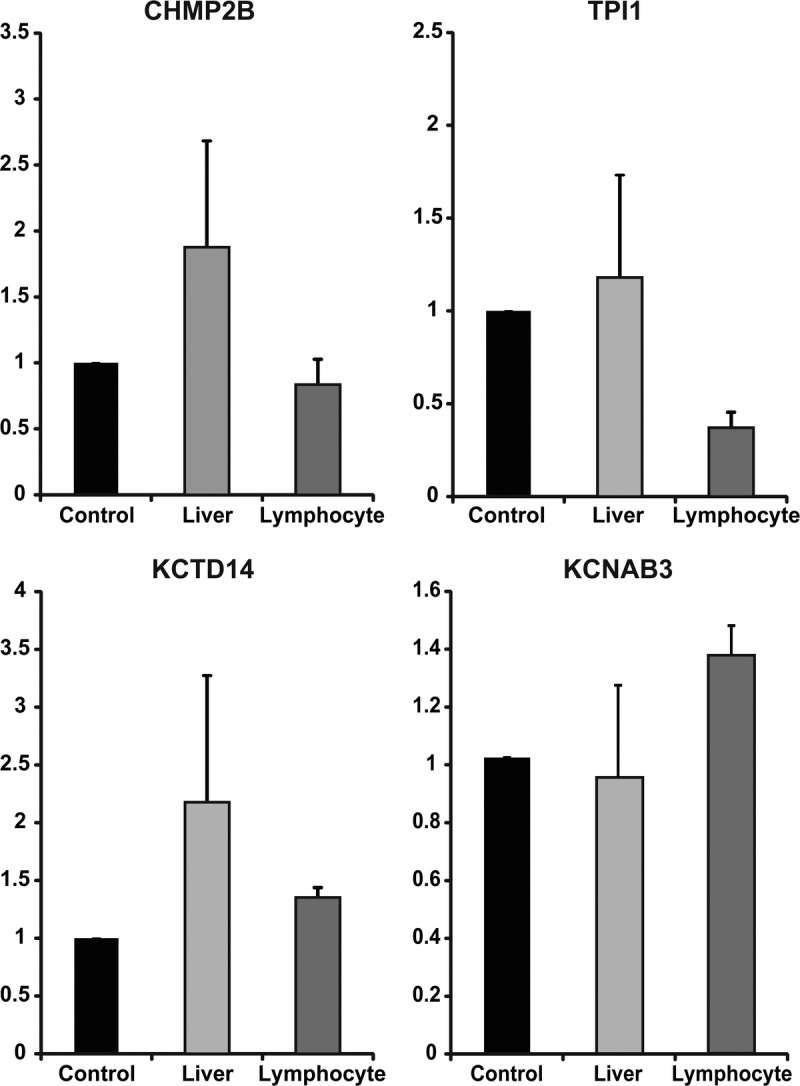
Distribution of target protein in normal liver and lymphocytes. qRT-PCR was performed to confirm the distribution of four genes (CHMP2B, TPI1, KCTD14, KCNAB3) using the original pooled samples (n = 10). The gene expression levels were rescaled relative to the control (testis). Error bars indicate standard error of the mean (SEM).
Clinical Characteristics of Transplant Recipients Used in Validation Study
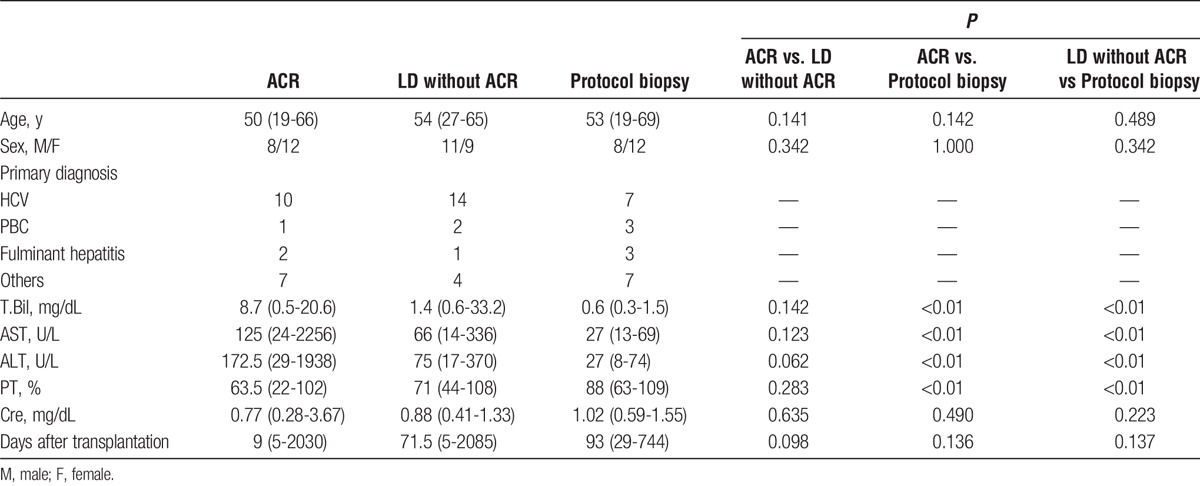
The clinical characteristics of the patients used for validation are summarized in Table 3. The diagnosis of ACR was based on histopathological examination by 2 independent liver transplant pathologists. We verified that all of the pathological diagnoses matched the clinical courses of the patients. The patients in the ACR group received rejection therapy containing a steroid pulse or increasing dose of immunosuppression; all exhibited a recovery of liver function. Patients in the LD without ACR group did not receive rejection therapy. The median time from liver transplantation was 61 days. We found no significant differences in age, sex, or duration after transplantation. We found no significant differences in serum total bilirubin, serum aspartate aminotransferase, serum ALT, prothrombin time, or serum creatinine, especially between the ACR group and LD without ACR group.
TABLE 3.
Clinical information on patients who underwent ELISA for validation
Autoantibodies to CHMP2B, KCTD14, KCNAB3, and TPI1 Were Highly Expressed in ACR
To validate the results of the microarray analysis, we performed ELISA with the antibodies markedly upregulated in the discovery set. Expression of the autoantibodies to CHMP2B, KCTD14, and TPI1 was significantly higher in ACR group than the LD without ACR group, protocol biopsy group, and healthy volunteer group. The expression of autoantibody to KCNAB3 was significantly higher in the ACR group than the LD without ACR group and protocol biopsy group (Figure 4). We also compared autoantibody titers by drawing a standard curve using rabbit polyclonal IgG to each target antigen. The significance of the difference in KCTD14 between the ACR group and protocol biopsy group disappeared (Figure S1, SDC, http://links.lww.com/TP/B362). In contrast, the expression of autoantibodies to CHMP2B and TPI1 was significantly higher in the ACR group than the other control groups. These results suggest that the autoantibodies to CHMP2B and TPI1 would be promising biomarkers of ACR after liver transplantation.
FIGURE 4.
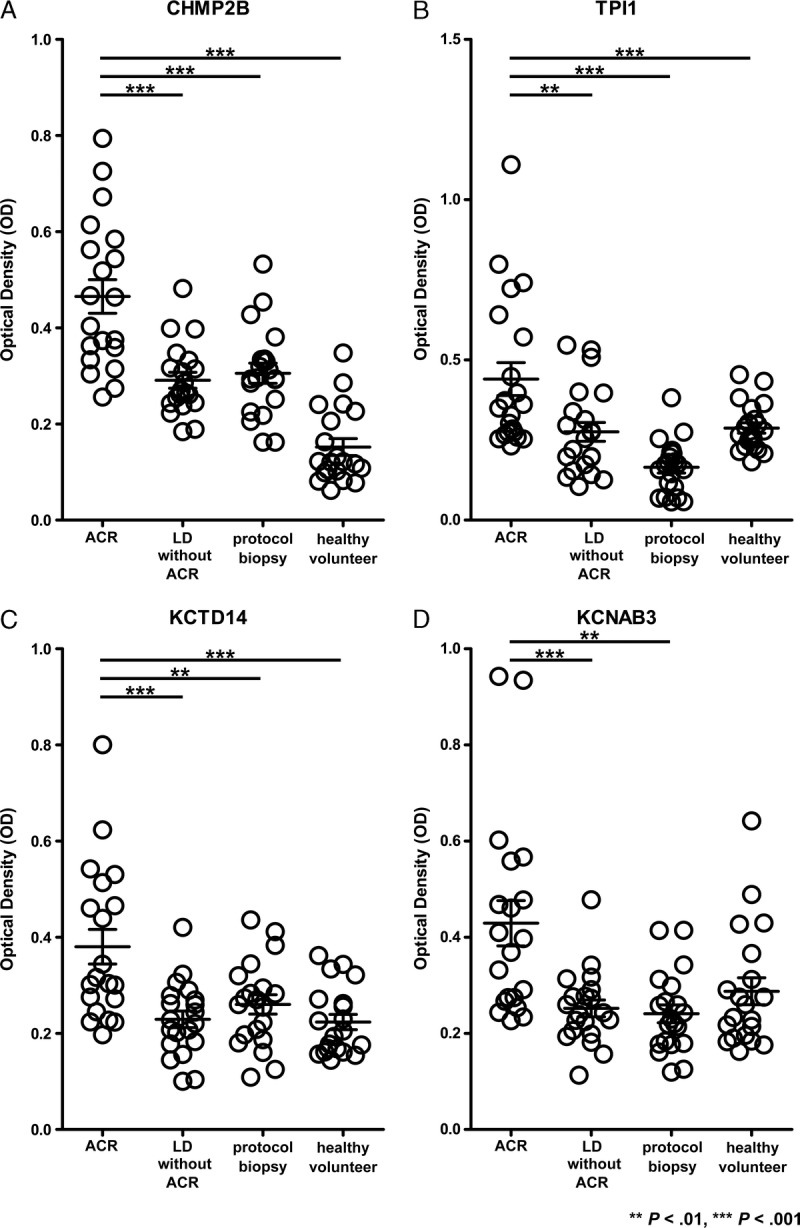
Validation of representative autoantibodies by ELISA. The expression levels of autoantibodies to CHMP2B, TPI1, KCTD14, and KCNAB3 were determined in sera from 20 ACR patients and 20 LD without ACR patients. Twenty patients without ACR or LD and 20 healthy volunteers served as controls. Pathological diagnosis was made for each case. The horizontal line indicates median values. Significant differences were derived from a nonparametric Mann-Whitney U test. **P < 0.01; ***P < 0.001.
Autoantibodies to CHMP2B, KCTD14, KCNAB3, and TPI1 Are Potential Biomarkers of ACR After Liver Transplantation
We evaluated ROC curves to assess the potential usefulness of the aforementioned 4 upregulated autoantibodies a noninvasive biomarkers of ACR after liver transplantation. Setting the LD without ACR group as a control, the ROC analysis showed that these antibodies were robust in discriminating patients with ACR from those with LD. The area under the curve was 0.8613 (95% confidence interval [CI], 0.7496-0.9729), 0.8150 (95% CI, 0.6858-0.9442), 0.8088 (95% CI, 0.6767-0.9408), and 0.7381 (95% CI, 0.5821-0.8904) for CHMP2B, KCTD14, KCNAB3, and TPI1, respectively (Figure 5). The sensitivity, specificity, and positive and negative predictive values for identifying a patient with ACR after liver transplantation are described in Table 4. At a cutoff value of 0.3330 for the CHMP2B antibody, the sensitivity and specificity of diagnosing ACR were 80% and 80%.
FIGURE 5.
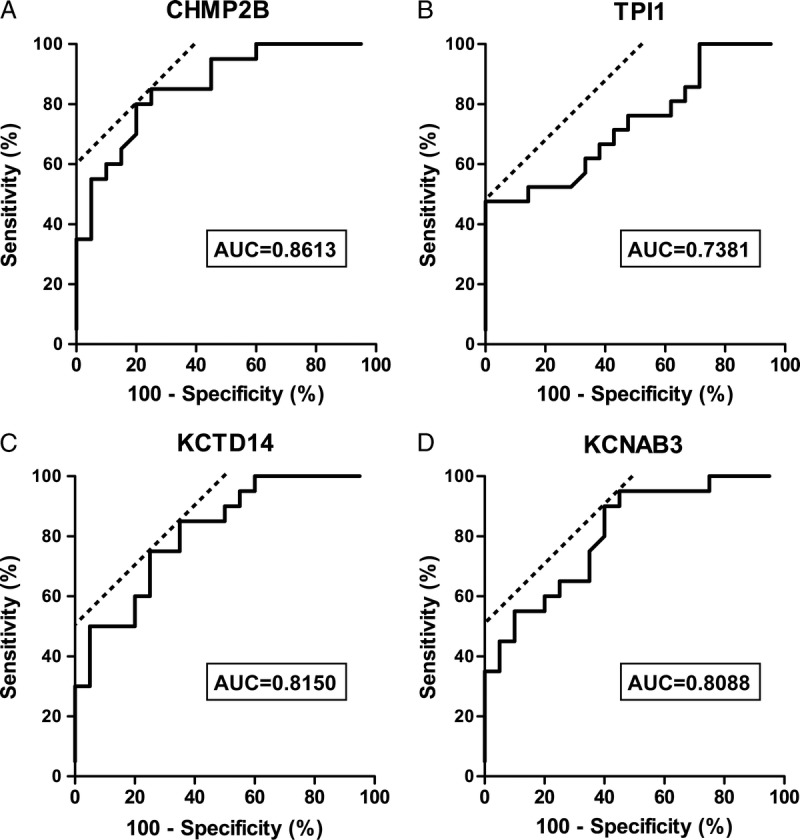
ROC curve analysis for distinguishing patients with ACR from patients with LD without ACR using the expression of autoantibodies to CHMP2B, TPI1, KCTD14, and KCNAB3. A, Serum autoantibody to CHMP2B yielded an AUC of 0.8613 (95% CI, 0.7496-0.9729) with 80% sensitivity and 80% specificity. B, The autoantibody to TPI1 had an AUC of 0.7381 (95% CI, 0.5821-0.8904) with 45% sensitivity and 100% specificity. C, Serum autoantibody to KCTD14 yielded an AUC of 0.8150 (95% CI, 0.6858-0.9442) with 85% sensitivity and 65% specificity. D, The autoantibody to KCNAB3 had an AUC of 0.8088 (95% CI, 0.6767-0.9408) with 90% sensitivity and 60% specificity. AUC, area under the curve.
TABLE 4.
Sensitivity and specificity of the diagnosis of ACR using representative autoantibody expression in sera

Time Course of Anti-CHMP2B and Anti-TPI1 Autoantibody Expression in Patients With ACR After Liver Transplantation
We tested the serial changes in the expression of anti-CHMP2B and anti-TPI1, which were significantly higher in the ACR group in the validation study. We used sera from patients with ACR diagnosed by histopathological examination on POD 15 and treated with steroid pulse therapy. The levels of anti-CHMP2B and anti-TPI1 were highest the day of ACR and did not increase before ACR. The autoantibody levels correlated well with the change in liver enzymes (Figure 6).
FIGURE 6.
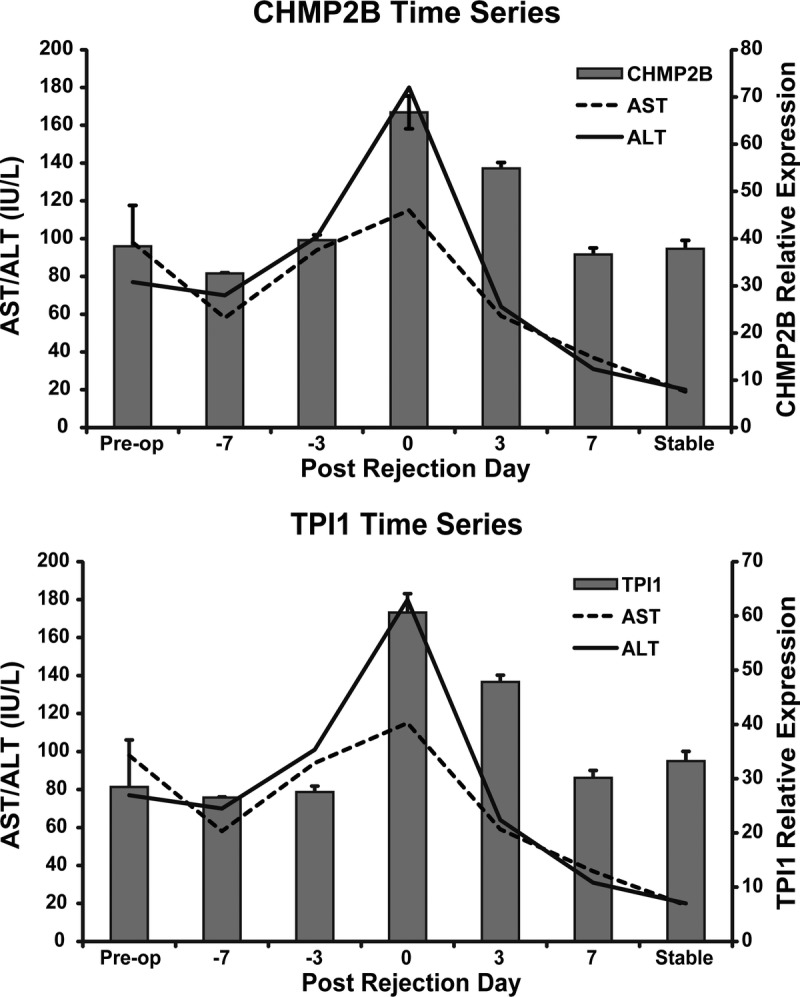
Serial changes in the activity of autoantibody to CHMP2B and TPI1 in sera samples obtained from a single patient with ACR as measured by ELISA. ACR was diagnosed at POD 15. The band plot represents the optical density and the line plot represents liver enzyme activity. Error bars indicate standard error of the mean (SEM).
Anti-CHMP2B Level Between the Groups of the Patients Grade by AST Level
We also evaluated the expression of anti-CHMP2B antibody between ACR group and LD without ACR group in high AST level (AST >100 U/mL) or low AST level (AST < 100 U/ml). Even in low AST level, the expression of anti-CHMP2B antibody in ACR group is significantly higher than that in LD without ACR group (Figure S2, SDC, http://links.lww.com/TP/B362).
DISCUSSION
In this study, molecular markers that can diagnose ACR after liver transplantation were explored using seromic microarrays. Fifty-seven candidate autoantibodies were increased in the sera of recipients with LD and ACR.
Recent advancements in the fields of genomics and proteomics have opened the doors to new technologies for detecting rejection episodes in transplanted patients and are beginning to prospectively diagnose the risk of rejection based on donor and recipient biomarkers.33 However, the exact molecular mechanism underlying ACR is not understood, and noninvasive tests for evaluating immune status in transplanted patients have not been developed.
We previously found new molecular markers of ACR in peripheral leukocytes12 and in bile.13 We also revealed novel transcriptome patterns for ACR in recipients with HCV infection using liver biopsy samples.11,34 Although liver biopsy is the standard for the diagnosis of transplant rejection, it is not easily repeated because of the invasiveness and risk of bleeding. Recently, proteomic analysis using sera has been applied to detect an active process and monitor rejection episodes more easily. Due to the high number of proteins involved in the ACR process, proteomic analysis could play a crucial role in identifying a potential biomarker of ACR.35 However, detecting specific proteins in proteome analysis is difficult because of the high degree of variability between patients, and even in the same patient over time.33 To overcome this difficulty, we used a protein array that evaluates the expression of antibodies to specific antigens induced in the ACR process based on the theory of the rapid clearance of antibodies. Unlike transcriptome or proteome analysis, the advantage of detecting antibodies in serum is that candidate antibodies indicating abnormal values are emphasized by the antigen-antibody reaction. Furthermore, seromics correlates with ELISA.
In this study, we used microarrays for the concurrent detection of serum antibody reactivity to multiple proteins in patients with ACR after liver transplantation. This trial was used to prove the reactivity of sera from patients with various cancers and identified many promising highly immunogenic tumor antigens. The existence of specific autoantibodies to these antigens was validated by ELISA.31 Taking this approach, our initial screening phase revealed 57 candidate antibodies. Nineteen targets of antibodies were located mainly in the cytosol, 12 targets in the cell membrane, 22 targets in the nucleus, and 4 targets were located outside the cell.
Interestingly, glutamic-oxaloacetic transaminase 2 (GOT2) was included among the 57 antigens. GOT2 is a pyridoxal phosphate-dependent enzyme present in the mitochondria. Serum GOT levels are commonly and clinically used as a biomarker of liver damage. In the seromic microarray analysis, only the patients in the ACR group had LD and elevated serum GOT levels. This result suggests that a damaged liver releases GOT and autoantibodies to GOT2 are upregulated immediately to respond to liver damage. Using WAD ranking and Mann-Whitney U test, the antibodies to CHMP2B, KCTD14, KCNAB3, and TPI1 were selected and validated by ELISA. The expression of these 4 antigens was validated in the normal liver and peripheral blood leukocytes by qRT-PCR.
CHMP2B is one of the core subunits of the endosomal sorting complex required for transport-III, which plays a crucial role in cellular membrane remodeling and ubiquitin-mediated lysosomal degradation. CHMP2B is located in the cytosol and is involved in the formation of endocytic multivesicular bodies. CHMP2B has been reported to participate in frontotemporal dementia or amyotrophic lateral sclerosis,36,37 and it plays an important role in the detection and removal through the extracellular shedding of small wounds present at the plasma membrane.38 We suppose that the several reactions composing ACR make the liver cell membrane damaged to be detected by CHMP2B. It is interesting that the autoantibody of CHMP2B was not expressed in control group, then these reaction including CHMP2B detection may be specific in ACR. Furthermore, ubiquitin and ubiquitin-conjugating enzyme E2 were highly expressed in the sera of ACR patients.14 Taking previous reports and our findings together, CHMP2B and the ubiquitin-mediated pathway may closely correlate with immune activation of ACR after transplantation.
Both KCTD14 and potassium channel, KCNAB3 are components of potassium channels. Potassium channels are widely distributed in the organs, and the liver is one of the most mitochondria-enriched organs. Mitochondrial adenosine triphosphate–sensitive potassium channels regulate DNA synthesis and play crucial roles in liver regeneration.39 Mitochondrial potassium uptake induces matrix alkalization and produces reactive oxygen species. This process is important to maintain the mitochondrial integrity during a hazardous condition. Therefore, disruption of potassium channels in hepatocytes may be one of the molecular mechanisms underlying ACR. This may be a reason for the autoantibodies to components of potassium channels being upregulated in the sera of patients with ACR.
TPI1 is an enzyme that catalyzes the interconversion of dihydroxyacetone phosphate and glyceraldehyde-3 phosphate in the glycolysis pathway. Hypoxia-inducible factor 1-alpha transcriptionally upregulated the expression of TPI1. Increased TPI1 generates anaerobic energy to protect from hypoxic injury. One of the main histological changes in ACR, as seen in liver biopsy samples, is subendothelial inflammation of the portal and hepatic veins.40 Damage to endothelial cells in ACR may induce the hypoxic response in the graft.
KCTD14, KCNAB3, and TPI1 are located intracellularly and involved in many important biological processes. According to the Banff criteria, mononuclear portal inflammation, subendothelial inflammation, and bile duct damage are characteristic of ACR.40 One possible hypothesis is that these target proteins may be discharged from hepatocytes, endothelial cells, or bile duct and recognized by the immune system. However, this hypothesis should be verified by functional analysis.
The autoantibodies to CHMP2B, KCTD14, KCNAB3, and TPI1 demonstrated high sensitivity and specificity, promising to distinguish ACR from LD after liver transplantation. In the validation study, the autoantibodies to CHMP2B and TPI1 were significantly elevated in patients with ACR compared with the other groups. Therefore, we evaluated serial changes in the antibodies to CHMP2B and TPI1 in sera obtained from a patient with ACR. The levels of autoantibodies to CHMP2B and TPI1 were not upregulated preoperatively or 7 days before the confirmation of ACR by liver biopsy. The levels of these antibodies were highest around ACR and immediately decreased after resolving ACR with the administration of steroid recycle treatment. This result suggests that the expressions of autoantibodies to CHMP2B and TPI1 are not predictors of ACR, but are good candidates as diagnostic molecular markers.
The limitation of this study is the small number of the patients with or without ACR. These promising biomarkers need to be confirmed in large multicenter prospective trials. In addition, the exact molecular mechanism underlying the upregulation of these autoantibodies at the point of ACR after liver transplantation is unclear. The localization and function of targeted antigens need to be evaluated and verified using in vitro and in vivo models.
In conclusion, we used an entirely new approach to identify a panel of promising noninvasive biomarkers of ACR using protein microarray. We identified 57 candidate autoantibodies and verified that CHMP2B and TPI1 are clinically useful biomarkers for diagnosing ACR in liver transplantation.
Supplementary Material
Footnotes
Published online 18 November, 2016.
This study was supported by Grants-in-Aid for Scientific Research for Young Scientists (B) (K.O., 26861045) from the Japanese Ministry of Education, Culture, Sports, Science, and Technology; Core Research for Evolutional Science and Technology (CREST) from the Japan Science and Technology Agency (JST).
The authors declare no conflict of interest.
K.O., H.W., A.T., H.E., M.H., H.N., and S.S. designed the study. H.W., A.T., M.H., A.T., Y.T., T.A., N.H., K.K., S.K., S.M., and H.N. acquired the data. K.O., H.W., A.T., M.H. interpreted the data. K.O., H.W., A.T., S.M., H.E., Y.D., M.M., and S.S. drafted the article.
Supplemental digital content (SDC) is available for this article. Direct URL citations appear in the printed text, and links to the digital files are provided in the HTML text of this article on the journal's Web site (www.transplantjournal.com).
REFERENCES
- 1.Keeffe EB. Liver transplantation: current status and novel approaches to liver replacement. Gastroenterology. 2001;120:749–762. [DOI] [PubMed] [Google Scholar]
- 2.Wiesner RH, Ludwig J, Krom RA, et al. Hepatic allograft rejection: new developments in terminology, diagnosis, prevention, and treatment. Mayo Clin Proc. 1993;68:69–79. [DOI] [PubMed] [Google Scholar]
- 3.VanBuskirk AM, Pidwell DJ, Adams PW, et al. Transplantation immunology. JAMA. 1997;278:1993–1999. [PubMed] [Google Scholar]
- 4.Martinez OM, Rosen HR. Basic concepts in transplant immunology. Liver Transpl. 2005;11:370–381. [DOI] [PubMed] [Google Scholar]
- 5.Liu LU, Bodian CA, Gondolesi GE, et al. Marked Differences in acute cellular rejection rates between living-donor and deceased-donor liver transplant recipients. Transplantation. 2005;80:1072–1080. [DOI] [PubMed] [Google Scholar]
- 6.Ikegami T, Shirabe K, Yoshiya S, et al. A high MELD score, combined with the presence of hepatitis C, is associated with a poor prognosis in living donor liver transplantation. Surg Today. 2014;44:233–240. [DOI] [PubMed] [Google Scholar]
- 7.Rockey DC, Caldwell SH, Goodman ZD, et al. Liver biopsy. Hepatology. 2009;49:1017–1044. [DOI] [PubMed] [Google Scholar]
- 8.Sarwal M, Chua MS, Kambham N, et al. Molecular heterogeneity in acute renal allograft rejection identified by DNA microarray profiling. N Engl J Med. 2003;349:125–138. [DOI] [PubMed] [Google Scholar]
- 9.Scherer A, Krause A, Walker JR, et al. Early prognosis of the development of renal chronic allograft rejection by gene expression profiling of human protocol biopsies. Transplantation. 2003;75:1323–1330. [DOI] [PubMed] [Google Scholar]
- 10.Hama N, Yanagisawa Y, Dono K, et al. Gene expression profiling of acute cellular rejection in rat liver transplantation using DNA microarrays. Liver Transpl. 2009;15:509–521. [DOI] [PubMed] [Google Scholar]
- 11.Asaoka T, Kato T, Marubashi S, et al. Differential transcriptome patterns for acute cellular rejection in recipients with recurrent hepatitis C after liver transplantation. Liver Transpl. 2009;15:1738–1749. [DOI] [PubMed] [Google Scholar]
- 12.Kobayashi S, Nagano H, Marubashi S, et al. Guanylate-binding protein 2 mRNA in peripheral blood leukocytes of liver transplant recipients as a marker for acute cellular rejection. Transpl Int. 2010;23:390–396. [DOI] [PubMed] [Google Scholar]
- 13.Kim C, Aono S, Marubashi S, et al. Significance of alanine aminopeptidase N (APN) in bile in the diagnosis of acute cellular rejection after liver transplantation. J Surg Res. 2012;175:138–148. [DOI] [PubMed] [Google Scholar]
- 14.Massoud O, Heimbach J, Viker K, et al. Noninvasive diagnosis of acute cellular rejection in liver transplant recipients: a proteomic signature validated by enzyme-linked immunosorbent assay. Liver Transpl. 2011;17:723–732. [DOI] [PMC free article] [PubMed] [Google Scholar]
- 15.Quintana FJ, Farez MF, Viglietta V, et al. Antigen microarrays identify unique serum autoantibody signatures in clinical and pathologic subtypes of multiple sclerosis. Proc Natl Acad Sci U S A. 2008;105:18889–18894. [DOI] [PMC free article] [PubMed] [Google Scholar]
- 16.Babel I, Barderas R, Díaz-Uriarte R, et al. Identification of tumor-associated autoantigens for the diagnosis of colorectal cancer in serum using high density protein microarrays. Mol Cell Proteomics. 2009;8:2382–2395. [DOI] [PMC free article] [PubMed] [Google Scholar]
- 17.Belousov PV, Kuprash DV, Sazykin AY, et al. Cancer-associated antigens and antigen arrays in serological diagnostics of malignant tumors. Biochemistry (Mosc). 2008;73:562–572. [DOI] [PubMed] [Google Scholar]
- 18.Kijanka G, Murphy D. Protein arrays as tools for serum autoantibody marker discovery in cancer. J Proteomics. 2009;72:936–944. [DOI] [PubMed] [Google Scholar]
- 19.Chatterjee M, Wojciechowski J, Tainsky MA. Discovery of antibody biomarkers using protein microarrays of tumor antigens cloned in high throughput. Methods Mol Biol. 2009;520:21–38. [DOI] [PubMed] [Google Scholar]
- 20.Tan EM, Zhang J. Autoantibodies to tumor-associated antigens: reporters from the immune system. Immunol Rev. 2008;222:328–340. [DOI] [PMC free article] [PubMed] [Google Scholar]
- 21.Canzler U, Bartsch H, Ulitzsch S, et al. Detection of autoantibodies to tumour-associated antigens in sera of patients with systemic autoimmunity using a novel protein microblot array. Scand J Immunol. 2009;69:563–569. [DOI] [PubMed] [Google Scholar]
- 22.Hueber W, Kidd BA, Tomooka BH, et al. Antigen microarray profiling of autoantibodies in rheumatoid arthritis. Arthritis Rheum. 2005;52:2645–2655. [DOI] [PubMed] [Google Scholar]
- 23.Hudson ME, Pozdnyakova I, Haines K, et al. Identification of differentially expressed proteins in ovarian cancer using high-density protein microarrays. Proc Natl Acad Sci U S A. 2007;104:17494–17499. [DOI] [PMC free article] [PubMed] [Google Scholar]
- 24.Madi A, Hecht I, Bransburg-Zabary S, et al. Organization of the autoantibody repertoire in healthy newborns and adults revealed by system level informatics of antigen microarray data. Proc Natl Acad Sci U S A. 2009;106:14484–14489. [DOI] [PMC free article] [PubMed] [Google Scholar]
- 25.Taylor DD, Gercel-Taylor C, Parker LP. Patient-derived tumor-reactive antibodies as diagnostic markers for ovarian cancer. Gynecol Oncol. 2009;115:112–120. [DOI] [PMC free article] [PubMed] [Google Scholar] [Research Misconduct Found]
- 26.Anderson KS, Ramachandran N, Wong J, et al. Application of protein microarrays for multiplexed detection of antibodies to tumor antigens in breast cancer. J Proteome Res. 2008;7:1490–1499. [DOI] [PMC free article] [PubMed] [Google Scholar]
- 27.Hong SH, Misek DE, Wang H, et al. An autoantibody-mediated immune response to calreticulin isoforms in pancreatic cancer. Cancer Res. 2004;64:5504–5510. [DOI] [PubMed] [Google Scholar]
- 28.Chen G, Wang X, Yu J, et al. Autoantibody profiles reveal ubiquilin 1 as a humoral immune response target in lung adenocarcinoma. Cancer Res. 2007;67:3461–3467. [DOI] [PubMed] [Google Scholar]
- 29.Albertus DL, Seder CW, Chen G, et al. AZGP1 autoantibody predicts survival and histone deacetylase inhibitors increase expression in lung adenocarcinoma. J Thorac Oncol. 2008;3:1236–1244. [DOI] [PubMed] [Google Scholar]
- 30.Gnjatic S, Wheeler C, Ebner M, et al. Seromic analysis of antibody responses in non-small cell lung cancer patients and healthy donors using conformational protein arrays. J Immunol Methods. 2009;341:50–58. [DOI] [PubMed] [Google Scholar]
- 31.Gnjatic S, Ritter E, Buchler MW, et al. Seromic profiling of ovarian and pancreatic cancer. Proc Natl Acad Sci U S A. 2010;107:5088–5093. [DOI] [PMC free article] [PubMed] [Google Scholar]
- 32.Kadota K, Nakai Y, Shimizu K. A weighted average difference method for detecting differentially expressed genes from microarray data. Algorithms Mol Biol. 2008;3:8. [DOI] [PMC free article] [PubMed] [Google Scholar]
- 33.Fiorini RN, Nicoud IB, Fiorini JH. The use of genomics and proteomics for the recognition of transplantation rejection of solid organs. Recent Pat DNA Gene Seq. 2009;3:1–6. [DOI] [PubMed] [Google Scholar]
- 34.Asaoka T, Marubashi S, Kobayashi S, et al. Intragraft transcriptome level of CXCL9 as biomarker of acute cellular rejection after liver transplantation. J Surg Res. 2012;178:1003–1014. [DOI] [PubMed] [Google Scholar]
- 35.Germani G, Rodriguez-Castro K, Russo FP, et al. Markers of acute rejection and graft acceptance in liver transplantation. World J Gastroenterol. 2015;21:1061–1068. [DOI] [PMC free article] [PubMed] [Google Scholar]
- 36.Cox LE, Ferraiuolo L, Goodall EF, et al. Mutations in CHMP2B in lower motor neuron predominant amyotrophic lateral sclerosis (ALS). PLoS One. 2010;5:e9872. [DOI] [PMC free article] [PubMed] [Google Scholar]
- 37.Parkinson N, Ince PG, Smith MO, et al. ALS phenotypes with mutations in CHMP2B (charged multivesicular body protein 2B). Neurology. 2006;67:1074–1077. [DOI] [PubMed] [Google Scholar]
- 38.Jimenez AJ, Maiuri P, Lafaurie-Janvore J, et al. ESCRT machinery is required for plasma membrane repair. Science. 2014;343:1247136. [DOI] [PubMed] [Google Scholar]
- 39.Nakagawa Y, Yoshioka M, Abe Y, et al. Enhancement of liver regeneration by adenosine triphosphate-sensitive K(+) channel opener (diazoxide) after partial hepatectomy. Transplantation. 2012;93:1094–1100. [DOI] [PubMed] [Google Scholar]
- 40.Banff schema for grading liver allograft rejection: an international consensus document. Hepatology. 1997;25:658–663. [DOI] [PubMed] [Google Scholar]
Associated Data
This section collects any data citations, data availability statements, or supplementary materials included in this article.


