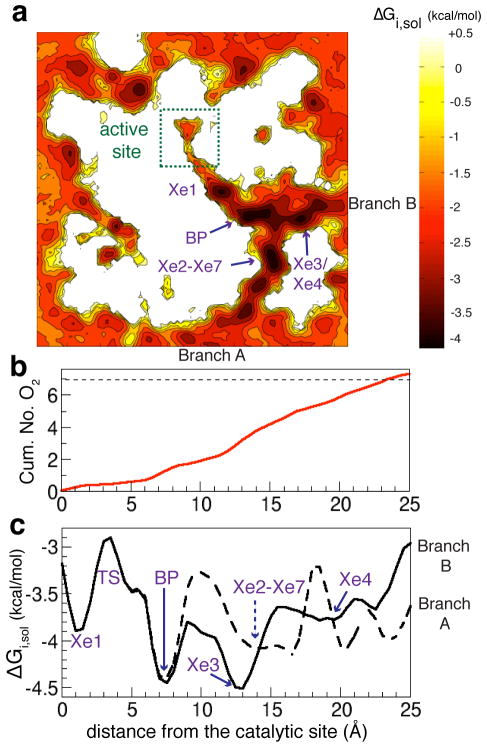
Figure 5. Energetic profiles of O2 along the delivery pathway.
a) A 2D projection of the free-energy map, calculated using MATLAB, describing the partitioning of O2 in the enzyme and its surroundings. The map was calculated by collapsing the normalized 3D density profiles of O2 calculated from ELS over a 50×50×30Å3 grid, which spans the enzyme region covering the entire O2 delivery pathway, heme cofactors, CuB, and surrounding lipids. Dark colors indicate high probability O2 regions. Light colors indicate O2 scarce regions. b) Estimated number of O2 binding sites along the pathway calculated by integrating O2 probability densities (pd) from the active site to the entrances of the pathway. c) 1D free-energy profiles of O2 partitioning along its delivery pathway. The coordinates of O2 that have been within 3Å of pathway’s residues are clustered into normalized O2 density profiles with respect to the aqueous phase using the distance from the active site (d) as the reaction coordinate. d=(((x − x0)2 +(y − y0)2 +(z − z0)2)1/2) - 6. (x0, y0, z0) is the position of CuB cofactor. O2 is considered to be in the active site when it has been within 6Å of CuB. BP specifies intersection point of Branches A and B, referring to as “branch-point”. ΔΔGTS–BP = +1.5 kcal/mol. The average speed of O2 diffusion along the pathway (v0) is 0.39 (0.29)Å/ps.

