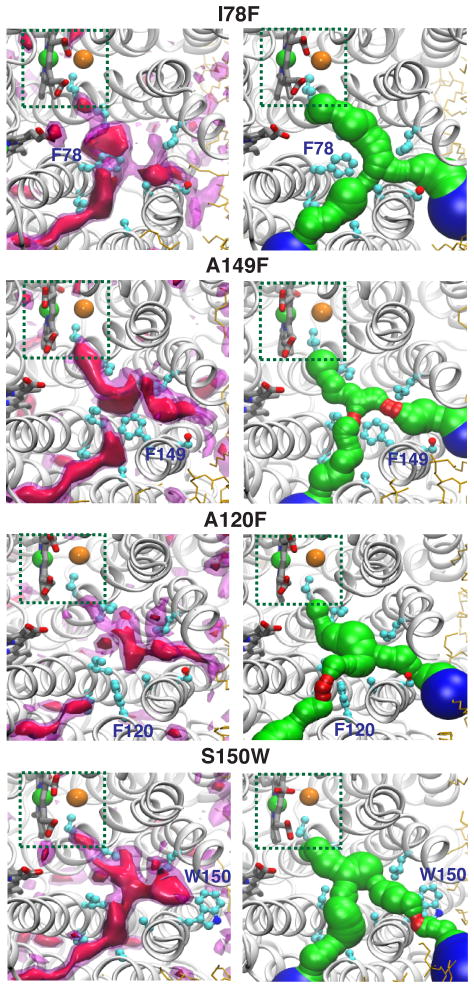
Figure 6. Alterations of the O2 delivery pathway by in silico mutagenesis of pathway-lining residues to bulky substitutions.
Left panels highlight predicted O2 binding regions calculated by ILS performed on the 10-ns of apo trajectories. The pink transparent surface indicates regions with ΔGi,sol of −2.5 kcal/mol for O2 binding. Right panels show the O2 delivery pathway calculated from the equilibrated structure (at t = 10 ns) of each mutant using MolAxis.60 Red corridors represent pore radii of <1.2Å. Green corridors represent pore radii of 1.2–3.0Å. Blue corridors represent pore radii of >3. 0Å.

