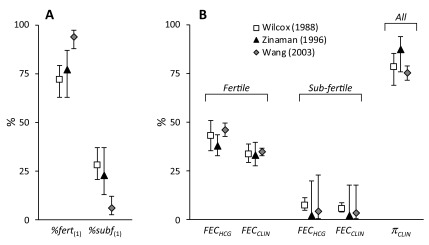
Figure 2. Parameter estimates for fertile and sub-fertile sub-cohorts and associated fecundability values.
Values are shown for Wilcox (□), Zinaman (▲) and Wang (  ) studies. Panel A shows
the proportions in the starting cohorts modelled as fertile or sub-fertile (
%fert
(1) & %subf
(1)). Panel B shows the hCG ( FEC HCG) and clinical ( FEC CLIN) fecundabilities and the probability of hCG pregnancies
progressing to clinical pregnancies ( π CLIN). Values are derived from modelled parameter estimates ( Table 1) and error bars indicate 95%
confidence intervals.

