

Abstract
Purpose
Methylation of the MGMT promoter is the major cause of O6-methylguanine methyltransferase deficiency in cancer and has been associated with the T variant of the promoter-enhancer SNP rs16906252C>T. We sought evidence for an association between the rs16906252C>T genotype and increased risk of developing a subtype of colorectal cancer (CRC) featuring MGMT methylation, mediated by genotype-dependent epigenetic silencing within normal tissues.
Experimental design
By applying a molecular pathological epidemiology case-control study design, associations between rs16906252C>T and risk for CRC overall, and CRC stratified by MGMT methylation status, were estimated using multinomial logistic regression in two independent retrospective series of CRC cases and controls. The test sample comprised 1054 CRC cases and 451 controls from Sydney, Australia. The validation sample comprised 612 CRC cases and 245 controls from the Australasian Colon Cancer Family Registry (ACCFR). To determine if rs16906252C>T was linked to a constitutively altered epigenetic state, quantitative allelic expression and methylation analyses were performed in normal tissues.
Results
An association between rs16906252C>T and increased risk of developing MGMT-methylated CRC in the Sydney sample was observed (OR 3.3; 95%CI=2.0–5.3; P<0.0001), which was replicated in the ACCFR sample (OR 4.0; 95%CI=2.4–6.8; P<0.0001). The T allele demonstrated ~2.5-fold reduced transcription in normal colorectal mucosa from cases and controls, and was selectively methylated in a minority of normal cells, indicating rs16906252C>T represents an expression and methylation quantitative trait locus.
Conclusions
We provide evidence that rs16906252C>T is associated with elevated risk for MGMT-methylated CRC, likely mediated by constitutive epigenetic repression of the T allele.
Keywords: MGMT, SNP, methylation, colorectal cancer, risk
Introduction
The DNA repair protein O6-methylguanine DNA methyltransferase (MGMT) plays a crucial role in protecting cells from the carcinogenic effects of alkylating agents by removing mutagenic alkyl adducts from DNA. MGMT molecules are degraded during the repair process, so need constant replenishment via transcription. The most frequent mechanism of transcriptional inactivation of MGMT in cancer is aberrant methylation of its CpG island promoter.1, 2 MGMT methylation or reduced MGMT mRNA levels in tumors are predictors of chemosensitivity to alkylating chemotherapy in cancer patients.3–6 Therefore, it would be of translational interest to determine the factors, including genetic risk variants, which affect the expression and/or the methylation status of MGMT, as these could also influence the outcomes of treatment with alkylating chemotherapy.7, 8
Colorectal cancer (CRC) is heterogeneous and may be subdivided into four major molecular subtypes, based on gene expression and methylation profiles, and enrichment for particular genetic alterations, consistent with four distinct neoplastic pathways.9, 10 One subtype exhibits the CpG island methylator phenotype (CIMP)-high involving methylation of numerous CpG islands genome-wide, BRAF V600E mutation, and high rates of microsatellite instability.11, 12 Another subtype features CIMP-low, in which a subset of CIMP-high loci is methylated, and enrichment for KRAS mutations.12, 13 The remaining subtypes are CIMP-negative with chromosomal instability.9, 10 MGMT methylation occurs in around 25–40% of CRC,1, 2 and has been associated with KRAS mutations,2, 14–20 particularly G>A transitions.14, 15, 17, 18 However, no consistent correlation between MGMT methylation and CIMP status has been found.2, 9, 12, 20 MGMT methylation thus cross-sects the major molecular subtypes of CRC,9, 12 and the mechanisms underlying it remain undefined.
We and others have found a close association between carriage of the T variant of the germline SNP rs16906252C>T within the MGMT promoter-enhancer region and the presence of MGMT methylation in CRC,2, 21 lung adenocarcinoma,22 pleural mesothelioma,23 glioblastoma,8, 24 and large cell B lymphoma.25 We and others have also reported low levels of MGMT methylation within normal tissues of cancer cases and healthy controls in association with the T variant.2, 26 The initial finding of low-level MGMT methylation within the macroscopically normal colorectal mucosa (NCM) of CRC cases led to speculation this may serve as a field defect preceding and predisposing to CRC,16 although the association with rs16906252C>T was unrealised at that time. Consistent with the concept of field cancerization,27 we showed that low-level MGMT methylation within the NCM of CRC cases was more commonly detected in those whose tumor was correspondingly methylated.2 Furthermore, we demonstrated that low-level MGMT methylation within the NCM of both CRC cases and controls was associated with the rs16906252C>T genotype.2 Low-level MGMT methylation has also been detected in the peripheral blood lymphocytes (PBLs) of healthy controls, wherein the methylation was associated with rs16906252C>T and linked specifically to alleles bearing the T variant.26
The functional mechanism underlying the association between the rs16906252C>T genotype and MGMT methylation remains unknown. Of potential functional relevance, rs16906252C>T is a synonymous SNP located in exon 1 within a cis-acting enhancer element that is essential for MGMT upregulation.28, 29 Reduced transcription has been identified as one mechanism underlying permanent epigenetic inactivation via the accumulation of repressive histone modifications, and ultimately, promoter methylation.30 Promoter reporter assays performed in lung adenocarcinoma and glioblastoma cell lines have shown reduced activity from the T, compared to the wild-type C, allele at rs16906252C>T.8, 22 The effect of rs16906252C>T on transcriptional activity has not been systematically investigated ex vivo, although reduced levels of transcripts derived from the T allele was reported in bronchial epithelial cells from two heterozygous cancer-free individuals.22
We hypothesized that the rs16906252C>T variant is associated with an elevated risk of developing an MGMT-methylated subtype of CRC, functionally mediated via constitutively reduced transcription from the T allele and its susceptibility to somatic methylation. Using a molecular pathological epidemiology retrospective case-control study design, we tested our hypotheses in a test sample of 1054 CRC cases, which we stratified by MGMT methylation status of the tumors, and 451 controls from Sydney, Australia, and replicated key observations in an independent sample of 612 cases and 245 controls from the Australasian Colon Cancer Family Registry (ACCFR). We also sought to elucidate the mechanism underlying the association between rs16906252C>T and MGMT methylation in CRC by investigating constitutive allelic methylation and expression profiles within normal tissues from subsets of cases and controls.
Materials and Methods
Subjects and specimens
An overview of the study design and inclusion of subjects and specimens is provided in Figure 1. Specimens of primary CRC and subject-matched NCM and/or PBL were drawn from two independent series of CRC cases from Australia. The “Sydney CRC series” comprised a sample of 1054 CRC cases drawn from 1178 patients who had undergone surgical resection of a primary CRC at St Vincent’s Hospital Sydney, between 1993–2008 (Supplementary Table 1), including 1039 patients in whom we previously reported a close association between the presence of MGMT methylation in CRC and rs16906252C>T.2 Cases identified with germline mutations within the mismatch repair genes, APC and MUTYH were omitted. The “ACCFR CRC series” comprised 612 cases diagnosed with incident CRC between 1997–2008, for whom both blood and tumor were available, recruited via the Victorian Cancer Registry, a population registry for the state of Victoria (Supplementary Table 2).31 For patients who developed two or more primary CRC, one cancer was selected at random for inclusion in this study. PBL was obtained from two groups of control subjects without a personal history of cancer recruited from the same catchment area as the respective CRC series. Controls for the “Sydney CRC series” comprised 451 blood donors recruited at St Vincent’s Hospital Sydney via the Australian Red Cross Blood Service (ARCBS), whose rs16906252C>T genotypes we have previously reported.8 Controls for the “ACCFR CRC series” comprised 245 individuals randomly recruited from the general population via Victorian Electoral Rolls and were additionally age- and sex-frequency matched to the cases.31 All subjects were derived from predominantly Caucasian populations.
Figure 1. Overall study design showing selection of cases and controls and usage of specimens.
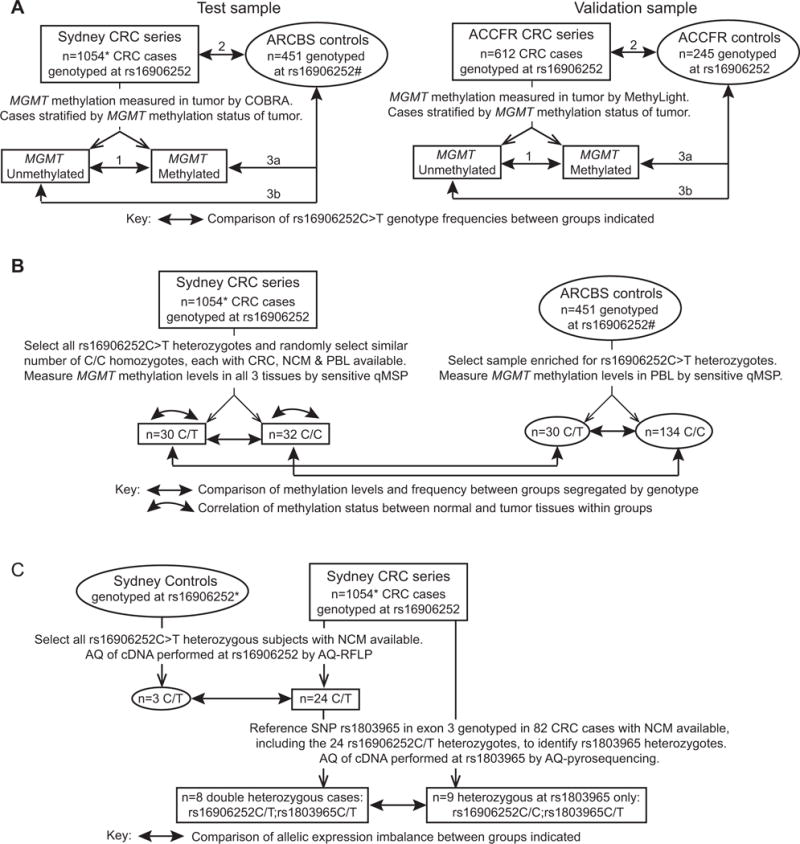
A: Molecular pathological epidemiology study designed to estimate associations between rs16906252C>T SNP genotype and risk for MGMT methylation in colorectal cancer (CRC), as well as risk for CRC by MGMT methylation subtype. The test sample comprised 1054 CRC cases who underwent surgery with curative intent at St Vincent’s Hospital Sydney, designated the “Sydney CRC series”, and a control group of geographically-matched blood donors with no personal history of cancer who were recruited at St Vincent’s Hospital Sydney by the Australian Red Cross Blood Service (ARCBS), designated “ARCBS controls”. *1039 of the 1054 cases from the Sydney CRC series were previously included in our report of a close association between the rs16906252C>T genotype and the presence of MGMT methylation in the tumor.2 However, 50 cases included in both the prior and the present study presented with more than one synchronous or metachronous CRC, and one tumor was selected at random for inclusion in each study. Hence there is incomplete overlap in the tumors from these 50 cases between the two studies. #We previously published the rs16906252C>T genotypes for the ARCBS controls in a study that assessed the association between rs16906252C>T genotype and risk of development of MGMT-methylated glioblastoma.8 The validation sample comprised 612 CRC cases from the Australasian Colon Cancer Family Registry (ACCFR), designated the “ACCFR CRC series”, and 245 controls without a personal history of cancer recruited from the Victorian electorate who were geographically and age- and sex-frequency matched to the cases, designated “ACCFR controls”.31 Where genotyping had not already been performed, all cases and controls were genotyped at the rs16906252 SNP in germline DNA extracted from peripheral blood lymphocytes (PBL) or paired normal colorectal mucosa (NCM). For CRC cases, MGMT methylation status in the tumor was assayed by COBRA or MethyLight, and the cases were stratified as “methylated” or “unmethylated”. Double-arrow lines indicate groups between which the frequencies of carriage of the T variant at rs16906252 (C/T and T/T combined) were compared in both the test and validation samples to estimate associations between: 1) The presence of MGMT methylation within tumors and rs16906252C>T among CRC cases only; 2) rs16926252C>T and risk of CRC overall; 3) rs16926252C>T and risk of developing a CRC that was (a) MGMT-methylated or (b) MGMT-unmethylated. B and C, ex vivo functional analyses of the rs16906252C>T SNP. B: Detection of MGMT methylation within normal tissues and its association with rs16906252C>T. A sample of CRC cases with tumor, NCM and PBL available was selected from the Sydney CRC series to determine if MGMT methylation was detectable in either/both normal tissues, and whether this and/or genotype was associated with the presence of MGMT methylation in the corresponding tumor (curved double-arrows). To enrich for rs169026523C>T cases, all CRC cases heterozygous for the rs16906252C>T SNP were considered eligible for inclusion, and 30 cases had all three tissue types available. A similar number of cases homozygous for the wild-type C allele at rs16906252 with all three tissue types available were selected at random to serve as a comparison group. MGMT methylation levels were measured using the semi-quantitative and highly sensitive real-time methylation-specific PCR (qMSP) technique. To determine if low-level MGMT methylation detected in PBL was driven by cancer status or by genotype, a subset of ARCBS controls enriched for the rs16906252C>T genotype was tested by qMSP. The levels and frequency of methylation were compared between the cases and controls (straight double-arrows). C: Quantitative allelic expression analyses in NCM to determine if the variant T allele at rs16906252C>T was associated with constitutively reduced levels of transcription compared to the C allele. Firstly, three cancer-free controls from St Vincent’s Hospital, Sydney and 24 CRC cases from the Sydney CRC series who were all rs16906252C>T heterozygotes with fresh-frozen NCM tissue available were analyzed by allele quantification restriction fragment length polymorphism (AQ-RFLP) at the rs16906252 SNP site (Supplementary Methods) in cDNAs from NCM to determine the relative levels of expression of the C and T alleles. The normalized C:T allelic expression ratios (AERs) were determined, which indicated an allelic expression imbalance (AEI) with reduced expression from the T allele. The AERs were compared between the cases and controls (double-arrow). To confirm the AEI observed by AQ-RFLP, an indirect method of measuring allelic expression levels was then performed by allele quantification pyrosequencing (AQ-pyrosequencing) at a common, benign reference SNP, rs1803965C>T, located downstream in exon 3. To identify rs1803965C>T heterozygotes, 82 cases from the Sydney CRC series, including the 24 rs16906252C>T heterozygous cases analyzed by AQ-RFLP, were genotyped at rs1803965C>T. A subset of 8/24 of the rs16906252C>T heterozygous cases were double heterozygotes for the two SNPs. These eight cases were additionally assessed for AEI by AQ-pyrosequencing at the exon 3 rs1803965C>T SNP. Nine cases heterozygous for the rs1803965 SNP assayed, but homozygous C at rs16906252 of functional interest, were included for comparison of the degree of AEI (double-arrow).
For ex vivo functional analyses of the rs16906252C>T SNP, subsets of cases from the “Sydney CRC series” and “ARCBS controls” were selected on the basis of genotype. NCM from three cancer-free subjects who underwent colonic resection at St Vincent’s Hospital Sydney for indications other than CRC, and who we previously identified as rs16906252C>T heterozygotes,2 were included as controls.
This study was approved by Human Research Ethics Committees of The University of New South Wales St Vincent’s Campus (H02/022, H07/002), The University of Melbourne (#020702), and ARCBS (2003#08). All subjects provided signed informed consent prior to participation.
Genotyping
Genotyping of rs16906252C>T was performed on DNA extracted from PBL or NCM, either (1) by PCR amplification followed by HhaI restriction fragment length polymorphism (RFLP) analysis, as previously described,2, 24 or (2) using Sequenom’s iPLEX Gold. The genotyping assay was designed using MassARRAY Assay Design 3.0 software (Sequenom, Inc.) and performed according to the manufacturer’s instructions. Extension product sizes were determined using Sequenom’s Compact MALDI-TOF mass spectrometer. The resulting mass spectra were converted to genotype data using SpectroTYPER-RT software.
Methylation analyses
DNA was converted with sodium bisulphite using the EZ DNA Methylation Gold kit (Zymo Research, Irvine, USA). For tumors, MGMT methylation status was determined by COBRA in the Sydney CRC series, and by MethyLight in the ACCFR CRC series, as previously described.2, 11, 19 Tumors with methylation levels of ≥5% (COBRA) or a percentage of methylated reference (PMR) value >4.0 (MethyLight) were considered “methylated”, since this threshold correlates most closely with protein loss.32
As previously described,2 a sensitive real-time methylation-specific PCR (q-MSP) assay was used to measure MGMT methylation in matched PBL, NCM and CRC from a subset of CRC cases, and PBL from a subset of controls (Figure 2A). Tumors were categorized as “methylated” when the PMR>4.0. PBL and NCM were categorized as “methylation-low” when PMR≥0.01 (the analytical sensitivity threshold for this assay).
Figure 2. Methylation levels detected in subject matched normal and tumor tissue samples from CRC cases by quantitative real-time methylation-specific PCR segregated by rs16906252 genotype.
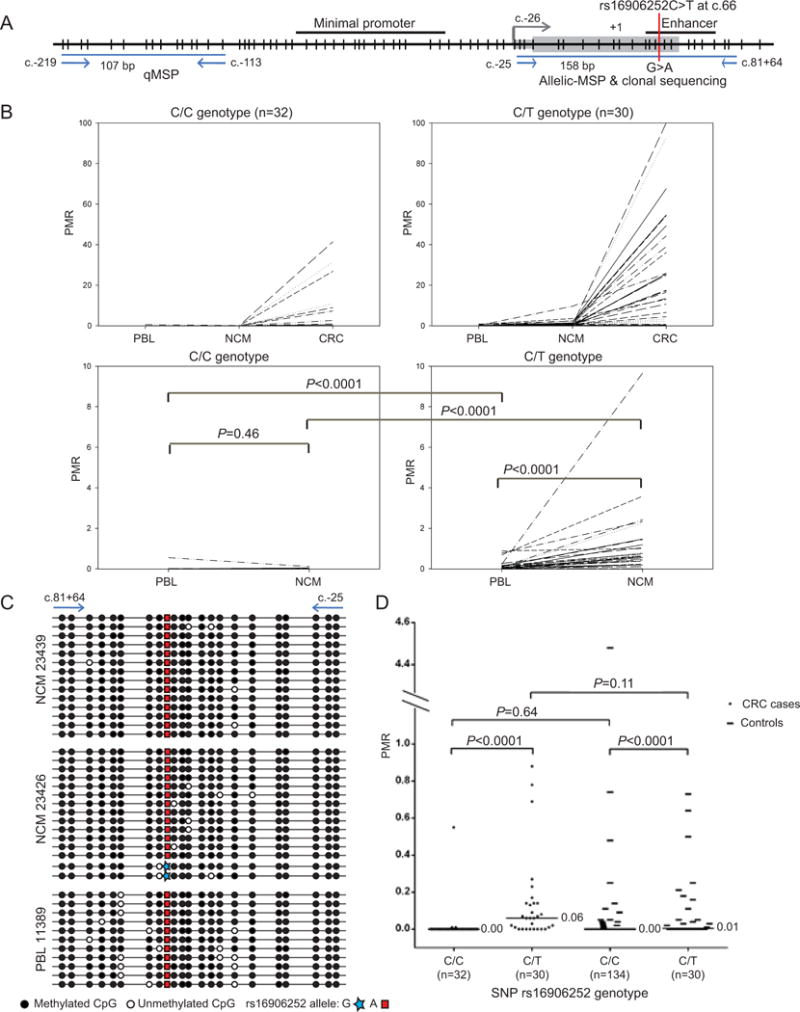
A: Map of the MGMT CpG island promoter and location of the rs16906252 SNP showing the positions of high-sensitivity methylation-specific PCR (MSP) assays used to detect methylation of the MGMT promoter. The map is drawn with respect to the first ATG translation start site located at +1, according to MGMT consensus sequence (GenBank accession NM_002412.3). The 5’ untranslated region of exon 1 is represented as a thin grey box, the coding region as a wide grey box, and the grey arrow indicates the transcription start site. CpG dinucleotides are shown as vertical black lines. Horizontal black lines indicate regulatory elements. Vertical red line indicates the location of the rs16906252C>T SNP, which is detected as a G>A change on the complementary strand. Blue lines show assay maps. Left, the real-time quantitative MSP (qMSP) assay used to detect and measure methylation levels in subject-matched normal and tumor tissues. Right, the allelic-MSP assay used to determine which allele of the rs16906252C>T SNP is methylated within normal tissues. B: Spaghetti plots showing the percentage of methylation reference (PMR) scores for MGMT methylation detected by qMSP in subject-matched peripheral blood lymphocytes (PBL), normal colorectal mucosa (NCM), and colorectal carcinoma (CRC) tissues from 62 CRC cases segregated by rs16906252 SNP genotype (n=32 CC, n=30 CT). Top panel: PMR scores for all three tissues, with values within subjects linked by a line. Bottom panel: Expanded PMR scale showing the same values for PBL and NCM. C: Actual PMR values obtained by qMSP in the PBL of healthy controls and the same 62 CRC cases as B, segregated by rs16906252C>T genotype. For B and C, P values are shown for statistical comparisons of PMR scores between groups, as indicated by a horizontal grey line. Comparisons of PMR scores for PBL or NCM between subjects across the groups of patients segregated by C/C and C/T genotypes were performed using the Independent Mann-Whitney U test. Comparisons of PMR scores between subject-matched PBL and NCM were performed using a related samples Wilcoxon signed rank test. D: Clonal sequencing of allelic-MSP products are shown for representative examples of normal tissues from rs16906252C>T heterozygous CRC cases in which low-level MGMT methylation was detected. Horizontal lines represent individual methylated alleles, and the methylation status of each CpG dinucleotide within each allele are shown by black and white circles. Top, NCM sample in which monoallelic methylation of the variant T allele (detected as A on the complementary strand) was detected, which was the most common pattern observed among the NCM of CRC cases. Bottom, the only NCM sample in which methylation of both alleles was detected, although more methylated T alleles than C alleles were detected.
To determine if methylation-low detected by q-MSP within normal tissues of rs16906252C>T heterozygotes was linked to a specific rs16906252 allele, an allelic methylation-specific PCR (allelic-MSP) assay encompassing rs16906252 was performed using primers 5′-GGTTGTTATCGTTTCGAGGGAGAGTT-3′ and 5′-CCGCGCCCCGAATATACTAAA-3′ (Figure 2A). Amplicons were cloned using the pGEMTeasy PCR cloning system (Promega), and the inserts from 12–24 colonies sequenced.
Promoter reporter assays
Luciferase promoter reporter constructs containing the MGMT promoter sequence, with either the wild-type C (HAP1) or the variant T (HAP4) allele at rs16906252 inserted into the pGL2-Basic vector,22 were transiently transfected into human embryonal kidney (HEK293) and CRC (HCT116) cell lines. The levels of luciferase reporter activity were measured by luminometry (Supplementary Methods).
Allelic expression analyses
To measure the relative levels of transcripts derived from the C and T alleles at rs16906252C>T, allele quantification (AQ) assays were performed in cDNAs from NCM of selected CRC cases and controls either (1) directly, by HhaI AQ-RFLP analysis of rs16906252 at c.66 or (2) indirectly, at the linked rs1803965C>T SNP at c.252 within exon 3 by AQ-pyrosequencing, and subsequently ascertaining the rs16906252;rs1803965 haplotypes by clonal sequencing of cDNA fragments encompassing both SNPs (Supplementary Methods; Supplementary Figure 1). SNPs are located with reference to GenBank accession NM_002412.3. To ascertain haplotypes between rs16906252C>T of functional interest and the downstream rs1803965C>T SNP assayed, RT-PCR was performed across exons 1 and 3 encompassing both SNPs in cDNAs from double-heterozygotes using primers 5′-CCGGATATGCTGGGACAG-3′ and 5′-CTGGTGAACGACTCTTGCTG-3′. Products were cloned in pGEMTEasy to isolate individual transcripts, and the inserts sequenced using vector primers.
For both AQ assays, the fold difference in the levels of rs16906252C:T transcripts were normalized against the levels of the respective alleles in genomic DNA, and calculated as an allelic expression ratio (AER) by: [CcDNA/TcDNA]/[CDNA/TDNA].33 Following haplotyping of double-heterozygotes, the AERs obtained by AQ-pyrosequencing at rs1803965C>T in exon 3 were inverted, where necessary, to reflect the C:T AER at rs16906252C>T upstream.
Statistical analyses
MGMT methylation status was analyzed as a categorical variable except where stated. P-values for unadjusted odds ratios (OR) were estimated using the chi-square test. Multivariate unconditional logistic regression was used to determine independent factors among significant, unadjusted covariates. Where more than one factor was associated with presence of MGMT methylation, logistic regression was used to obtain adjusted ORs. A multinomial logistic regression model was used to compare the subsets of CRC cases stratified by MGMT methylation status, with healthy controls as the referent group. Non-normally distributed, continuous PMR and AER values were compared between groups using a Mann-Whitney U test, or between subject-matched samples using a related-samples Wilcoxon signed rank test. Luciferase expression values were compared using a Students’ T test. A correlation between AER and PMR values was estimated using Spearman’s rho. All statistical tests were two-sided.
Online tools
The minor allele frequency (MSF) of rs16906252C>T was obtained from data accessed from dbSNP via the NCBI website http://www.ncbi.nlm.nih.gov/projects/SNP/ and the 1000 Genomes Project at http://browser.1000genomes.org/index.html.
Results
Confirmation of the association between MGMT methylation in CRC and rs16906252C>T
In our test series of 1054 Sydney CRC cases, 292 tumors (27.7%) were positive for MGMT methylation. We found a clear association between the presence of MGMT methylation in CRC and carriage of the T variant at rs16906252C>T in univariate analysis (OR=6.23; 95%CI=4.3–8.9; P<0.0001; Table 1), with strong evidence for an independent association in multivariate analyses (OR 8.0; 95%CI=5.3–12.1; P<0.0001; Supplementary Table 1), recapitulating our previous findings among 1039 of these cases.2 In our validation series of 612 CRC cases from the ACCFR (Supplementary Table 2), 129 tumors (21.1%) were MGMT-methylated, and a clear association between MGMT methylation and the rs16906252C>T genotype was found (OR=7.12; 95%CI=4.3–11.7; P<0.001; Table 1). In both series, these associations remained significant when adjusted for age and gender (Table 1). Our consistent findings in two independent CRC series provide confirmatory evidence for a close association between rs16906252C>T and MGMT methylation in CRC. The rs16906252C>T genotype had low sensitivity but high specificity for an MGMT-methylated tumor (Supplementary Table 3).
Table 1.
Association between rs16906252C>T genotype and presence of MGMT methylation in colorectal cancer (CRC) from two independent series of CRC cases.
| Cases No. (%) | CC No. (%) | CT/TT No. (%) | OR (95% CI) | P-value | aOR (95% CI) | P-value | |
|---|---|---|---|---|---|---|---|
| Sydney CRC series | |||||||
| MGMT methylation | 1054 | 897 (85.1) | 157 (14.9) | ||||
| Unmethylated | 762 (72.3) | 704 (92.4) | 58 (7.6) | 1.0 (referent) | |||
| Methylated | 292 (27.7) | 193 (66.1) | 99 (33.9) | 6.2 (4.3–8.9) | <0.0001 | 6.3 (4.4–9.1) | <0.0001 |
| ACCFR CRC series | |||||||
| MGMT methylation | 612 | 529 (86.4) | 83 (13.6) | ||||
| Unmethylated | 483 (78.9) | 447 (92.5) | 36 (7.5) | 1.0 (referent) | |||
| Methylated | 129 (21.1) | 82 (63.6) | 47 (36.4) | 7.1 (4.3–11.7) | <0.0001 | 7.1 (4.3–11.8) | <0.0001 |
Odds Ratio (OR); aOR, odds ratio adjusted for age and gender.
The rs16906252C>T genotype is associated with increased risk of developing MGMT-methylated CRC
To determine if the rs16906252C>T genotype was associated with an increased risk of CRC development, we firstly compared the distribution of genotypes between the cases and controls in the test sample (Figure 1A). The MAF of rs16906252C>T in the Sydney CRC series was 7.5%, and 14.9% of patients carried the T variant (CT/TT genotypes combined). In the respective ARCBS controls, the MAF was 6.1%, and 12% carried the T variant.8 The SNP genotype frequencies were in Hardy-Weinberg equilibrium in both the CRC (P=0.21) and the control (P=0.86) groups. Carriage of the T variant was not associated with risk for CRC overall (Table 3). Next, in a molecular pathological epidemiology study design, we determined if the rs16906252C>T genotype was associated with risk of developing CRC specifically exhibiting MGMT methylation in a subtype-specific manner. We stratified the CRC cases by the MGMT methylation status of their tumor into MGMT-methylated or MGMT-unmethylated categories, and compared the distribution of genotypes in these two categories with the control group. Carriage of the T variant was associated with an increased risk for MGMT-methylated CRC (OR 3.3; 95%CI=2.0–5.3; P<0.0001), coupled with a reduced risk for an MGMT-unmethylated CRC (OR 0.5; 95%CI=0.3–0.9; P=0.01) (Table 2).
Table 3.
Comparative associations between the rs16906252C>T genotype and the presence of low-level MGMT methylation in normal tissues with presence of MGMT methylation in primary CRC.
| Unmethylated Tumor (n=34) No. (%) |
Methylated Tumor (n=28) No. (%) |
OR (95% CI) | P-value | aOR (95% CI) | P-value | |
|---|---|---|---|---|---|---|
| PBL | ||||||
| PMR<0.01 | 28 (82.3%) | 9 (32.1%) | 9.9 (3.0–32.3) | <0.001 | 3.7(0.9–15.4)* | 0.075 |
| PMR≥0.01 | 6 (17.7%) | 19 (67.9%) | ||||
| NCM | ||||||
| PMR<0.01 | 23 (67.7%) | 6 (21.4%) | 7.7 (2.4–24.3) | <0.001 | 1.6(0.3–9.7)* | 0.600 |
| PMR≥0.01 | 11 (32.4%) | 22 (78.6%) | ||||
| Methylation-low | ||||||
| PBL and NCM | 5 (14.7%) | 19 (67.9%) | 13.9 (3.7–53.0) | <0.001 | 3.3(0.4–23.5)* | 0.243 |
| PBL only | 1 (2.9%) | 0 (0.0%) | NT | — | NT | — |
| NCM only | 6 (17.7%) | 3 (10.7%) | 1.8 (0.4–9.6) | 0.473 | 0.5(0.06–5.0)* | 0.596 |
| Neither (referent) | 22 (64.7%) | 6 (24.4%) | 1.00 | 1.00 | ||
| Genotype | ||||||
| CC | 26 (76.5%) | 6 (21.4%) | ||||
| CT | 8 (23.5%) | 22 (78.6%) | 11.9 (3.6–39.6) | <0.001 | 6.4(1.0–41.3)† | 0.052 |
Percentage of fully-methylated reference (PMR), peripheral blood lymphocytes (PBL), normal colorectal mucosa (NCM), referent (ref.), odds ratio (OR), adjusted OR (aOR). Methylation-low corresponds to a PMR≥0.01 in NCM and PBL. Tumors are defined as methylated when PMR≥4.0 and as unmethylated when PMR<4.0.
aOR adjusted for rs16906252 genotype.
aOR adjusted for methylation-low in PBL and NCM. NT, not tested due to insufficient numbers.
Table 2.
Statistical comparisons of the MGMT rs16906252C>T genotype between two independent series of colorectal cancer (CRC) cases and their matched control groups.
| No. (%) | CC No. (%) | CT/TT No. (%) | aOR (95% CI) | P-value | |
|---|---|---|---|---|---|
| Sydney (test sample) | |||||
| ARCBS controls | 451 | 397 (88.0) | 54 (12.0) | 1.0 (referent) | |
| All CRC cases | 1054 | 897 (85.1) | 157 (14.9) | 1.1 (0.7–1.6) | 0.73 |
| MGMT-methylated CRC cases | 292 (27.7) | 193 (66.1) | 99 (33.9) | 3.3 (2.0–5.3) | <0.0001 |
| MGMT-unmethylated CRC cases | 762 (72.3) | 704 (92.4) | 58 (7.6) | 0.5 (0.3–0.9) | 0.01 |
| ACCFR (validation sample) | |||||
| Controls | 245 | 214 (87.4) | 31 (12.7) | 1.0 (referent) | |
| All CRC cases | 612 | 529 (86.4) | 83 (13.6) | 1.1 (0.7–1.7) | 0.75 |
| MGMT-methylated CRC cases | 129 (21.1) | 82 (63.6) | 47 (36.4) | 4.0 (2.4–6.8) | <0.0001 |
| MGMT-unmethylated CRC cases | 483 (78.9) | 447 (92.5) | 36 (7.5) | 0.5 (0.3–0.9) | 0.02 |
When the CRC cases were stratified by the MGMT methylation status in their primary carcinoma, carriage of the T allele was significantly associated with the presence of methylation in tumors (highlighted in bold). aOR, odds ratios have been adjusted by age group and gender using a multinomial logistic regression model.
To confirm these observations, we repeated the analyses in the validation sample (Figure 1A). The MAF in the ACCFR CRC series was 7.0%, and 13.6% carried the T variant. The MAF in the matched control group was 6.3%, and 12.7% carried the T variant (Table 2). The SNP genotype frequencies were in Hardy-Weinberg equilibrium in both cases (P=0.99) and controls (P=0.29). The rs16906252C>T genotype was not associated with risk for CRC overall, however, rs16906252C>T was associated with an elevated risk for MGMT-methylated CRC (OR 4.0; 95%CI=2.4–6.8; P<0.0001), and a reduced risk for MGMT-unmethylated CRC (OR 0.5; 95%CI=0.3–0.9; P=0.02) (Table 2). Hence, the associations we observed between the rs16906252C>T genotype and elevated risk of developing MGMT-methylated CRC, and reduced risk of MGMT-unmethylated CRC, in the test sample were replicated with similar magnitude in the validation sample.
The rs16906252 T genotype underlies low-level methylation in normal tissues from CRC cases
We next sought to elucidate the mechanistic basis for the risk association identified between rs16906252C>T and development of an MGMT-methylated cancer. We determined if (A) low-level MGMT methylation was detectable systemically or specifically within the NCM of CRC cases; (B) whether this was associated with rs16906252C>T genotype; and (C) if methylation or genotype were predictive of the MGMT methylation status of the corresponding tumor. We used sensitive qMSP (Figure 2A) to measure the MGMT methylation levels in matched PBL, NCM and tumor tissues from a subset of cases from the Sydney CRC series. To maximise the number of cases with the rs16906252C>T genotype, all heterozygotes from this series were considered eligible for inclusion, and those with availability of all three tissue types were included (n=30) (Figure 1B). A similar number (n=32) of C/C homozygotes were then selected from the series at random.
(A) Low levels of MGMT methylation were detected in either or both PBL and NCM of a proportion of cases. Figure 2B shows the actual PMR scores for the matched tissues from each case segregated by rs16906252 genotype. (B) In categorical analyses, methylation-low (PMR≥0.01) was detected in the PBL of 9.4% of C/C and 73.3% of C/T cases. In NCM, methylation-low was detected in 15.6% of C/C and 93.3% of C/T cases (Table 3). A strong association between rs16906252C>T genotype and presence of methylation was identified for all three tissue types (P<0.0001; Supplementary Table 4). (C) To determine whether the presence of methylation-low in PBL and/or NCM, or rs16906252C>T genotype, was predictive of MGMT methylation status in the corresponding tumor, we compared the strengths of their associations. Methylation-low in PBL or NCM, and rs16906252C>T genotype showed moderate sensitivity and specificity for methylated tumors (Supplementary Table 5). Both the T genotype, and the presence of methylation in PBL or NCM were strongly associated with tumor methylation (ORs=11.9, 9.9 and 7.7, respectively) (Table 3). However, the association for methylation-low in PBL and NCM, individually, declined significantly when adjusted for genotype (adjusted OR=3.7, P=0.08 and adjusted OR=1.6, P=0.6, respectively), while the risk for genotype adjusted by methylation-low status showed little change (PBL: adjusted OR=5.8; NCM: adjusted OR=8.3) (Table 3). When compared with patients with unmethylated normal tissues, those with methylation-low in both NCM and PBL showed a strong association with methylated tumors (OR=13.9). This association also diminished significantly when adjusted for genotype (adjusted OR=3.3), whereas the genotype association remained borderline statistically significant when adjusted by methylation status (adjusted OR=6.4) (Table 3).
On the basis of this subset of CRC cases, rs16906252C>T genotype appears to be the primary driver of MGMT methylation in CRC. Nevertheless, when actual PMR scores in normal tissues were analyzed as a continuous variable segregated by rs16906252C>T genotype, C/T cases had significantly higher levels of MGMT methylation compared to C/C cases in both PBL (P<0.0001) and NCM (P<0.0001) (Figure 2B). Furthermore, within subjects, the levels of MGMT methylation were significantly higher in NCM compared to PBL among C/T cases (P<0.0001), but not in C/C cases (Figure 2B). The latter findings support the hypothesis that, in the setting of CRC, the T variant confers susceptibility to MGMT methylation within normal tissues, and this occurs at higher levels in NCM than in PBL.
The rs16906252 T allele is selectively methylated in normal tissues of CRC cases
To determine definitively if MGMT methylation-low within normal tissues of CRC cases was attributable to selective methylation of the T allele, allelic-MSP encompassing rs16906252C>T (Figure 2A), followed by clonal sequencing of the products, was performed in C/T heterozygotes who had exhibited methylation-low by qMSP. Among the 28 C/T cases in whom methylation-low had been detected in NCM and/or PBL, 20 NCM and five PBL samples from 24 cases were positive by allelic-MSP. The allelic-MSP products from 18 NCM and four PBL samples were successfully cloned and sequenced. As illustrated for representative samples (Figure 2C), methylation was dense and monoallelic on the T allele in 17/18 NCM, and biallelic, but predominant on the T allele, in one NCM. Dense methylation specific to the T allele was observed in all four PBL (Figure 2C).
Low-level MGMT methylation in PBL of healthy controls is associated with rs16906252C>T and occurs at similar frequency and levels as genotype-matched CRC cases
To determine if MGMT methylation-low was detectable and associated with rs16906252C>T in the PBL of cancer-free subjects, we screened 164 ARCBS controls of known genotype (134 C/C, 30 C/T) by qMSP. Methylation-low was detected in 11.9% of C/C and 50% of C/T subjects and was clearly associated with the T variant (P<0.0001, Supplementary Table 4). When actual PMR values were analyzed as a continuous variable, methylation levels were higher in C/T (median 0.01%±0.19) compared to C/C subjects (median 0.00±0.39), (P<0.0001, Figure 2D). The frequency and levels of methylation in PBL were similar in cases and controls when stratified by rs16906252C>T genotype (Supplementary Table 4; Figure 2D). These findings indicate that low-level MGMT methylation in PBL is dependent on rs16906252C>T genotype, and is unrelated to cancer status.
The rs16906252 T variant is associated with constitutively reduced transcription
To assess the effect of the T variant on MGMT promoter activity, we performed in vitro luciferase promoter reporter assays using constructs containing the MGMT promoter with either the wild-type C or the variant T allele at the rs16906252 site. In parallel transient transfections of the promoter reporter constructs, the T allele was expressed at levels of 65% and 63% relative to the C allele, in HEK293 and HCT116 cells, respectively (Figure 3A).
Figure 3. Reduced transcriptional activity from of the T allele relative to the C allele of MGMT promoter-enhancer SNP rs16906252.
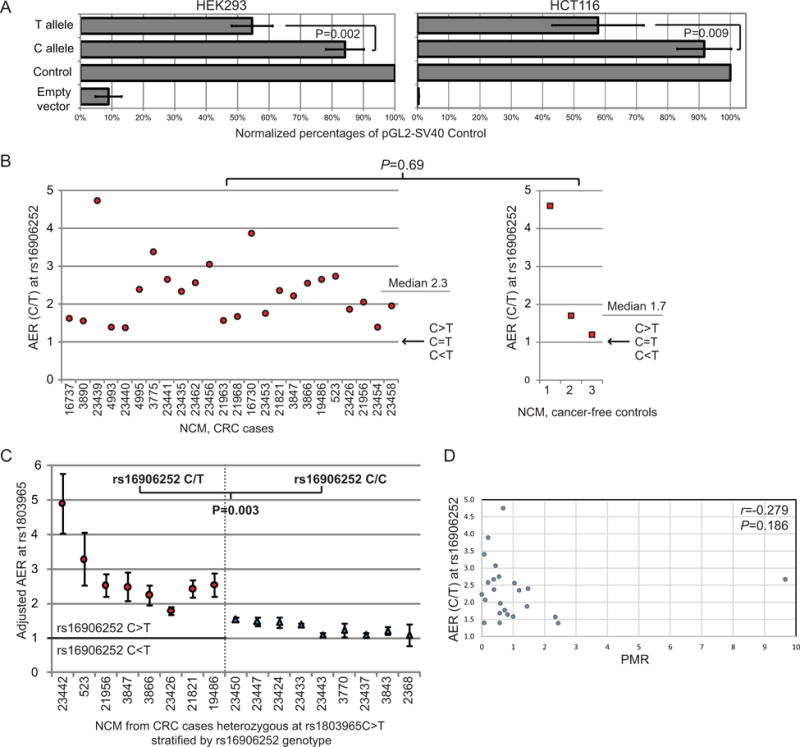
A: Luciferase promoter reporter assays show reduced promoter activity from the variant T allele. Bar charts of the MGMT promoter reporter activity produced by the HAP1 and HAP4 constructs containing the C allele or the T allele, respectively, at the rs16906252 SNP site are shown. Values are the mean ± standard deviation of Firefly luciferase activity normalised to Renilla luciferase activity, and expressed as a percentage of the pGL2-SV40 Control vector from four independent experiments performed in triplicate. Cells transfected with the empty pGL2-Basic vector show background levels of luciferase activity. P values determined by Student’s t tests show the difference in expression levels between constructs containing the C and T alleles at the rs16906252 SNP site were significant in both cell lines. The T allele was expressed at 65% the level of the C allele in HEK293 cells, and 63% of the level of the C allele in HCT116 cells. B: Constitutively reduced expression from the rs16906252T allele compared to the C allele in the normal colorectal mucosa (NCM) of heterozygous CRC cases from the Sydney CRC series and controls without neoplasia, as detected by allele quantification restriction fragment length (AQ-RFLP) analysis at the rs16906252 SNP site (Supplementary Figure 1A). Allelic expression ratios (AER) are plotted as rs16906252C:T. A C:T AER of 1.0 indicates equal levels of expression from the two alleles at the rs16906252 site. The AERs were consistently >1.0, indicating the C allele is expressed at a higher level than the T allele. There was no significant difference in AERs between the CRC cases and cancer-free controls (Mann Whitney U test). C: Reduced expression from the rs16906252T allele compared to the C allele in the NCM of CRC cases from the Sydney CRC series. All cases were heterozygous for the rs1803965 exon 3 SNP at which allelic expression levels were determined by AQ-pyrosequencing (Supplementary Figure 1B). Cases were then segregated by rs16906252 genotype into the heterozygous C/T group (n=8, left) or the homozygous C/C group (n=9, right). AERs plotted are the mean ± standard deviation from three replicates. Adjusted AERs for the double-heterozygotes (left) are plotted as rs16906252C:T, irrespective of which allele of the assayed rs1803965 SNP was highest expressed. AERs for the rs16906252C/C homozygotes (right) were plotted as AER≥1.0, irrespective of which allele at rs1803965 was expressed at the highest level. The significant difference in the adjusted AERs from rs16906252C>T heterozygotes versus C/C homozygotes indicates the wild-type C allele at the rs16906252 is expressed at a significantly higher level than the minor T allele (P=0.003; Mann Whitney U test). Close concordance in results was observed for samples that were studied by both the AQ-RFLP and AQ-pyrosequencing methods (Supplementary Figure 1C). Unadjusted AER values are provided in Supplementary Figure 2. D: Lack of correlation between the AER and levels of MGMT promoter methylation detected in the NCM of rs16906252C>T heterozygous CRC cases shows reduced expression from the T allele is not a consequence of low-level methylation. AER (rs16906252C:T) obtained by AQ‐RFLP and percentage of methylated reference (PMR) values obtained by qMSP are plotted for 24 CRC cases. The Spearman’s rho and P value are shown.
To determine if the T variant was associated with reduced expression ex vivo, the relative levels of transcripts derived from the C and T alleles of rs16906252C>T were measured in the NCM of rs16906252C>T heterozygous subjects, including 24 cases from the Sydney CRC series and three controls from St Vincent’s Hospital, by allele quantification (AQ) RFLP at rs16906252 (Figure 1C). Here, allelic expression levels were measured by densitometry of allele-specific bands post-electrophoresis (Supplementary Figure 1A). Allelic expression ratios (AER) for the C allele relative to the T allele ranged from 1.4 to 4.8 (median 2.3±0.83) in the cases, and from 1.2 to 4.6 (median 1.7±1.84) in the controls, with no significant difference between cases and controls (Figure 3B). Thus a significant allelic expression imbalance (AEI) was observed between the two rs16906252 alleles in NCM, irrespective of cancer status, with expression from the T allele at 21%-83% of that from the C allele.
To confirm these findings, we used an indirect AQ approach (Supplementary Figure 1B). Using AQ-pyrosequencing, the relative levels of allelic transcripts at a downstream reference SNP, rs1803965C>T located within exon 3, were measured in the NCM of a subset of eight of the rs16906252C>T heterozygous cases who were also heterozygous for rs1803965C>T, and a comparison group of nine rs1803965C>T heterozygous cases who were homozygous C/C at rs16906252 (Figure 1C). Considerable variation in rs1803965C:T AERs were observed among the double-heterozygote group, with either genetic allele of the assayed rs1803965C>T SNP expressed at the higher level, whereas balanced allelic expression was observed among the cases homozygous C/C at rs16906252 (Supplementary Figure 2). To adjust the AERs to reflect the transcriptional activity associated with rs16906252C>T in the double-heterozygotes, we next determined the rs16906252;rs1803965 haplotypes by RT-PCR across exons 1 and 3 encompassing both SNPs, followed by clonal sequencing of the cDNA fragments (Supplementary Figure 1B). The AERs for the double-heterozygotes were then adjusted to rs16906252C:T AERs, irrespective of which allele showed higher expression at rs1803965 downstream. To minimize any statistical bias incurred by this adjustment, the rs1803965 AERs in the rs16906252 C/C homozygote group were adjusted to ≥1.0, irrespective of which allele of this assayed SNP showed the highest expression level. The range of adjusted rs16906252C:T AERs in the double-heterozygote group was 1.8–4.5 (median ±SD: 2.5±0.78), indicating reduced expression associated with the rs16906252 T variant in all eight cases (Figure 3C). The adjusted AER values obtained for these eight cases by AQ-RFLP and AQ-pyrosequencing showed strong concordance (Supplementary Figure 2C). The range of adjusted AERs among the rs16906252 C/C homozygotes was 1.08–1.54 (median±SD: 1.23±0.18) (Figure 3C). The degree of AEI in rs16906252C>T cases was significantly higher than in the C/C homozygotes (P=0.003; Figure 3C). The significant transcriptional reduction associated with the rs16906252 T variant was not inversely correlated with methylation levels in the NCM samples, therefore not a consequence of it (Figure 3D). Collectively, these findings provide strong evidence that the rs16906252 T allele is constitutively expressed at a reduced level in NCM, irrespective of cancer status.
Discussion
We firstly confirm the close association between rs16906252C>T genotype and MGMT methylation in primary CRC. Including our study, this association has now been independently observed in three CRC series.2, 21 Similar findings at additional cancer sites suggest rs16906252C>T is a key determinant of MGMT methylation pan-cancer.8, 22–25
A key novel finding of this study was evidence for an association between rs16906252C>T and an elevated risk of developing CRC exhibiting MGMT methylation, and conversely, a reduced risk of developing MGMT-unmethylated CRC. These risk associations were only identified by virtue of the molecular pathological epidemiology approach taken, whereby risk associations between rs16906252C>T genotype and CRC was performed in a molecular subtype-specific manner after stratifying the cases by the MGMT methylation status of their tumor. This illustrates the power of molecular pathological epidemiology, an emerging field that integrates pathology and epidemiology to take molecular heterogeneity of cancer into account in deciphering risk associations that may otherwise be imperceptible using standard molecular epidemiology approaches.34–37 The lack of an association between rs16906252C>T and overall risk for CRC is unsurprising, given that no cancer risk-association has been reported for tag-SNPs around MGMT in genome-wide association studies (GWAS). Rs16906252 is not represented on SNP arrays commonly employed for mass genotyping due to its low MAF in the general population, thus has not specifically been interrogated in GWAS of cancer.
One limitation of our case-control study was the lack of self-reported race/ethnicity data, hence for geographic origin matching purposes, our control groups were selected from the same catchment areas as the case series. The MAF reported for rs16906252C>T in dbSNP and the 1000 Genomes Project databases ranges from 4–9% for Europeans, 4% for South Asians, and 0% for Africans and East Asians. The MAFs of 6.1–6.3% in our controls and 7.0–7.5% in our cases is consistent with the high rate of Caucasians in the populations from which our subjects were recruited. A large prospective population-based study would be required to demonstrate if the rs16906252C>T genotype predisposes to the development of cancers exhibiting MGMT deficiency.
In seeking to elucidate the mechanistic basis for the interaction between rs16906252C>T and risk for MGMT-methylated CRC, we detected low-level MGMT methylation in the PBL and NCM of CRC cases and in the PBL of healthy controls in association with rs16906252C>T. These findings are consistent with prior findings by our group in NCM from both CRC cases and controls,2 and by others in PBL from controls.26 Among CRC cases, genotype was a stronger predictor of an MGMT-methylated tumor than the presence of low-level methylation within either normal tissue. Nevertheless, among rs1696252C>T heterozygous cases, methylation levels were higher in NCM than in PBL, consistent with a role for this genotype-dependent MGMT methylation in field cancerization. Although global levels of methylation in these normal tissues were low, clonal sequencing revealed dense methylation of individual T alleles, consistent with methylation occurring in a small proportion of cells, predisposed by rs16906252C>T. The frequency and levels of MGMT methylation in PBLs did not differ between CRC cases and controls following stratification by rs16906252 genotype, further indicating that methylation was dependent on genotype, not cancer status or treatment. These findings provide firm evidence that rs16906252C>T represents a functional genetic variant that acts in cis to alter the somatic methylation state of the MGMT promoter, termed a methylation quantitative trait locus (meQTL). A recent study demonstrated a proportion of GWAS SNPs associated with cancer risk represent meQTLs, providing supportive evidence that SNP-associated secondary somatic epigenetic alteration may mediate cancer risk.38 We also demonstrated rs16906252 was associated with differential levels of allelic MGMT transcription, thus also represents an expression QTL (eQTL). Our luciferase promoter reporter assays showed the T allele diminished promoter activity in HEK293 and HCT116 cells, consistent with prior findings in other cancer cell lines,8, 22 suggesting rs16906252C>T directly effects transcriptional regulation of MGMT. More relevant, we showed that the T allele is expressed around half the level of the C allele in the NCM of both CRC cases and controls. This magnitude of transcriptional reduction was not attributable to MGMT methylation, which was present at low levels if at all, thus may be regarded as constitutive. Interestingly, rs16906252C>T predicted prolonged survival in glioblastoma patients treated with temozolomide, irrespective of whether their tumor was methylated or unmethylated at MGMT.8 Reduced transcription from the T allele provides one possible explanation for the extended survival experienced by T allele carriers whose glioblastoma was MGMT-unmethylated.
Based on our collective results, we propose a step-wise model to explain the risk association between rs169062562C>T and development of MGMT-methylated CRC. In this model, the T variant underlies constitutively reduced transcription (possibly by abrogating binding of transcriptional activators to the MGMT enhancer). This predisposes the T allele to chromatin remodelling, ultimately resulting in somatic promoter methylation within normal tissues. In turn, this stable epigenetic silencing predisposes to the development of MGMT-methylated cancer through field cancerization and clonal amplification of cells harboring MGMT methylation. The epigenetic alteration associated with rs16906252C>T within normal tissues likely serves as an intermediary linking this genotype with increased risk of developing an MGMT-methylated tumor.
Supplementary Material
Translational Relevance.
We present evidence for an association between the rs16906252C>T SNP genotype and increased risk of developing colorectal carcinoma (CRC) exhibiting MGMT methylation, coupled with reduced risk of developing CRC unmethylated at MGMT. This has translational implications for cancer risk stratification. Carriers of the rs6906252 T variant are more susceptible to developing a MGMT-methylated CRC, with odds ratios of magnitude 3.3–4.0, presumably upon exposure to alkylating agents. We provide evidence this increased risk-association for MGMT-methylated CRC is functionally mediated by epigenetic alteration of alleles bearing the T variant, including constitutively reduced transcriptional activity and somatic methylation, within normal tissues such as blood and colorectal mucosa. The T variant has only been identified among Europeans and South Asians, hence these findings are most relevant to Caucasians.
Acknowledgments
We gratefully acknowledge the Jeremy Jass Memorial Pathology Bank for the ACCFR pathology samples and data used in this study. MGMT promoter vectors were gifted by Drs. Belinski and Leng, Lovelace Respiratory Research Institute, Albuquerque, U.S. We thank Robert W. Haile for critical reading of the manuscript.
Financial Support: This work was supported by Australian National Health and Medical Research Council (NHMRC) grants APP568811 (M.P.H, R.L.W., N.J.H.), APP1025799 (D.D.B, A.K.W, M.A.J), APP1006498 (Career Development Fellowship II to M.P.H.), APP1073395 (Early Career Fellowship to A.K.W), APP1020493 (Senior Research Fellowship to M.A.J.), APP1023434 (Senior Principle Research Fellowship to J.L.H), Cancer Institute NSW grant RG104075 (Career Development Fellowship Top-Up Award to M.P.H.), Reserve Talents of Universities Overseas Research Program of Heilongjiang grant [2013]350 (Travel Fellowship to F.W.), and grant UM1 CA167551 from the National Cancer Institute (NCI) and through a cooperative agreement with the Australasian Colorectal Cancer Family Registry (U01 CA074778 and U01/U24 CA097735). The content of this manuscript does not necessarily reflect the views or policies of the NCI or any of the collaborating centers in the Colon Cancer Family Registry (CCFR), nor does mention of trade names, commercial products, or organizations imply endorsement by the US Government or the CCFR.
Footnotes
Author contributions: J.K-T, R.W.R., N.J.H, M.P.H, contributed to the conception and design, development of methodology, data acquisition, data analysis and interpretation, and writing the manuscript. F.W, J.O and A.K.W contributed to data analysis and interpretation, and writing the manuscript. M.C. contributed to data acquisition, analysis and interpretation. M.P.H, N.J.H, M.A.J. and R.L.W contributed to study supervision, acquisition of funding and provided material support. D.D.B., C.R., M.C.S., I. M. W., J.L.H., M.A.J. contributed to conception and study design, study supervision, administrative, technical and material support and acquisition of funding for the ACCFR data. All authors contributed to review and revision of the manuscript and its final approval.
References
- 1.Esteller M, Hamilton SR, Burger PC, Baylin SB, Herman JG. Inactivation of the DNA repair gene O6-methylguanine-DNA methyltransferase by promoter hypermethylation is a common event in primary human neoplasia. Cancer Res. 1999;59:793–797. [PubMed] [Google Scholar]
- 2.Hawkins NJ, Lee JH, Wong JJ, Kwok CT, Ward RL, Hitchins MP. MGMT methylation is associated primarily with the germline C>T SNP (rs16906252) in colorectal cancer and normal colonic mucosa. Mod Pathol. 2009;22:1588–1599. doi: 10.1038/modpathol.2009.130. [DOI] [PubMed] [Google Scholar]
- 3.Esteller M, Garcia-Foncillas J, Andion E, Goodman SN, Hidalgo OF, Vanaclocha V, et al. Inactivation of the DNA-repair gene MGMT and the clinical response of gliomas to alkylating agents. N Engl J Med. 2000;343:1350–1354. doi: 10.1056/NEJM200011093431901. [DOI] [PubMed] [Google Scholar]
- 4.Esteller M, Gaidano G, Goodman SN, Zagonel V, Capello D, Botto B, et al. Hypermethylation of the DNA repair gene O(6)-methylguanine DNA methyltransferase and survival of patients with diffuse large B-cell lymphoma. J Natl Cancer Inst. 2002;94:26–32. doi: 10.1093/jnci/94.1.26. [DOI] [PubMed] [Google Scholar]
- 5.Hegi ME, Diserens AC, Gorlia T, Hamou MF, de Tribolet N, Weller M, et al. MGMT gene silencing and benefit from temozolomide in glioblastoma. N Engl J Med. 2005;352:997–1003. doi: 10.1056/NEJMoa043331. [DOI] [PubMed] [Google Scholar]
- 6.Kreth S, Thon N, Eigenbrod S, Lutz J, Ledderose C, Egensperger R, et al. O-methylguanine-DNA methyltransferase (MGMT) mRNA expression predicts outcome in malignant glioma independent of MGMT promoter methylation. PLoS One. 2011;6:e17156. doi: 10.1371/journal.pone.0017156. [DOI] [PMC free article] [PubMed] [Google Scholar]
- 7.Brown CC, Havener TM, Medina MW, Auman JT, Mangravite LM, Krauss RM, et al. A genome-wide association analysis of temozolomide response using lymphoblastoid cell lines shows a clinically relevant association with MGMT. Pharmacogenet Genomics. 2012;22:796–802. doi: 10.1097/FPC.0b013e3283589c50. [DOI] [PMC free article] [PubMed] [Google Scholar]
- 8.Rapkins RW, Wang F, Nguyen HN, Cloughesy TF, Lai A, Ha W, et al. The MGMT promoter SNP rs16906252 is a risk factor for MGMT methylation in glioblastoma and is predictive of response to temozolomide. Neuro Oncol. 2015 doi: 10.1093/neuonc/nov064. [DOI] [PMC free article] [PubMed] [Google Scholar]
- 9.Hinoue T, Weisenberger DJ, Lange CP, Shen H, Byun HM, Van Den Berg D, et al. Genome-scale analysis of aberrant DNA methylation in colorectal cancer. Genome Res. 2012;22:271–282. doi: 10.1101/gr.117523.110. [DOI] [PMC free article] [PubMed] [Google Scholar]
- 10.Guinney J, Dienstmann R, Wang X, de Reynies A, Schlicker A, Soneson C, et al. The consensus molecular subtypes of colorectal cancer. Nat Med. 2015;21:1350–1356. doi: 10.1038/nm.3967. [DOI] [PMC free article] [PubMed] [Google Scholar]
- 11.Weisenberger DJ, Siegmund KD, Campan M, Young J, Long TI, Faasse MA, et al. CpG island methylator phenotype underlies sporadic microsatellite instability and is tightly associated with BRAF mutation in colorectal cancer. Nat Genet. 2006;38:787–793. doi: 10.1038/ng1834. [DOI] [PubMed] [Google Scholar]
- 12.Shen L, Toyota M, Kondo Y, Lin E, Zhang L, Guo Y, et al. Integrated genetic and epigenetic analysis identifies three different subclasses of colon cancer. Proc Natl Acad Sci U S A. 2007;104:18654–18659. doi: 10.1073/pnas.0704652104. [DOI] [PMC free article] [PubMed] [Google Scholar]
- 13.Ogino S, Kawasaki T, Kirkner GJ, Loda M, Fuchs CS. CpG island methylator phenotype-low (CIMP-low) in colorectal cancer: possible associations with male sex and KRAS mutations. J Mol Diagn. 2006;8:582–588. doi: 10.2353/jmoldx.2006.060082. [DOI] [PMC free article] [PubMed] [Google Scholar]
- 14.Esteller M, Toyota M, Sanchez-Cespedes M, Capella G, Peinado MA, Watkins DN, et al. Inactivation of the DNA repair gene O6-methylguanine-DNA methyltransferase by promoter hypermethylation is associated with G to A mutations in K-ras in colorectal tumorigenesis. Cancer Res. 2000;60:2368–2371. [PubMed] [Google Scholar]
- 15.Nagasaka T, Goel A, Notohara K, Takahata T, Sasamoto H, Uchida T, et al. Methylation pattern of the O6-methylguanine-DNA methyltransferase gene in colon during progressive colorectal tumorigenesis. Int J Cancer. 2008;122:2429–2436. doi: 10.1002/ijc.23398. [DOI] [PMC free article] [PubMed] [Google Scholar]
- 16.Shen L, Kondo Y, Rosner GL, Xiao L, Hernandez NS, Vilaythong J, et al. MGMT promoter methylation and field defect in sporadic colorectal cancer. J Natl Cancer Inst. 2005;97:1330–1338. doi: 10.1093/jnci/dji275. [DOI] [PubMed] [Google Scholar]
- 17.Whitehall VL, Walsh MD, Young J, Leggett BA, Jass JR. Methylation of O-6-methylguanine DNA methyltransferase characterizes a subset of colorectal cancer with low-level DNA microsatellite instability. Cancer Res. 2001;61:827–830. [PubMed] [Google Scholar]
- 18.Deng G, Kakar S, Tanaka H, Matsuzaki K, Miura S, Sleisenger MH, et al. Proximal and distal colorectal cancers show distinct gene-specific methylation profiles and clinical and molecular characteristics. Eur J Cancer. 2008;44:1290–1301. doi: 10.1016/j.ejca.2008.03.014. [DOI] [PubMed] [Google Scholar]
- 19.Rosty C, Young JP, Walsh MD, Clendenning M, Walters RJ, Pearson S, et al. Colorectal carcinomas with KRAS mutation are associated with distinctive morphological and molecular features. Mod Pathol. 2013;26:825–834. doi: 10.1038/modpathol.2012.240. [DOI] [PubMed] [Google Scholar]
- 20.Ogino S, Kawasaki T, Kirkner GJ, Suemoto Y, Meyerhardt JA, Fuchs CS. Molecular correlates with MGMT promoter methylation and silencing support CpG island methylator phenotype-low (CIMP-low) in colorectal cancer. Gut. 2007;56:1564–1571. doi: 10.1136/gut.2007.119750. [DOI] [PMC free article] [PubMed] [Google Scholar]
- 21.Ogino S, Hazra A, Tranah GJ, Kirkner GJ, Kawasaki T, Nosho K, et al. MGMT germline polymorphism is associated with somatic MGMT promoter methylation and gene silencing in colorectal cancer. Carcinogenesis. 2007 doi: 10.1093/carcin/bgm160. [DOI] [PubMed] [Google Scholar]
- 22.Leng S, Bernauer AM, Hong C, Do KC, Yingling CM, Flores KG, et al. The A/G allele of rs16906252 predicts for MGMT methylation and is selectively silenced in premalignant lesions from smokers and in lung adenocarcinomas. Clin Cancer Res. 2011;17:2014–2023. doi: 10.1158/1078-0432.CCR-10-3026. [DOI] [PMC free article] [PubMed] [Google Scholar]
- 23.Kristensen LS, Nielsen HM, Hager H, Hansen LL. Methylation of MGMT in malignant pleural mesothelioma occurs in a subset of patients and is associated with the T allele of the rs16906252 MGMT promoter SNP. Lung Cancer. 2011;71:130–136. doi: 10.1016/j.lungcan.2010.05.008. [DOI] [PubMed] [Google Scholar]
- 24.McDonald KL, Rapkins RW, Olivier J, Zhao L, Nozue K, Lu D, et al. The T genotype of the MGMT C>T (rs16906252) enhancer single-nucleotide polymorphism (SNP) is associated with promoter methylation and longer survival in glioblastoma patients. Eur J Cancer. 2013;49:360–368. doi: 10.1016/j.ejca.2012.08.012. [DOI] [PubMed] [Google Scholar]
- 25.Kristensen LS, Treppendahl MB, Asmar F, Girkov MS, Nielsen HM, Kjeldsen TE, et al. Investigation of MGMT and DAPK1 methylation patterns in diffuse large B-cell lymphoma using allelic MSP-pyrosequencing. Sci Rep. 2013;3:2789. doi: 10.1038/srep02789. [DOI] [PMC free article] [PubMed] [Google Scholar]
- 26.Candiloro IL, Dobrovic A. Detection of MGMT promoter methylation in normal individuals is strongly associated with the T allele of the rs16906252 MGMT promoter single nucleotide polymorphism. Cancer Prev Res (Phila) 2009;2:862–867. doi: 10.1158/1940-6207.CAPR-09-0056. [DOI] [PubMed] [Google Scholar]
- 27.Slaughter DP, Southwick HW, Smejkal W. Field cancerization in oral stratified squamous epithelium; clinical implications of multicentric origin. Cancer. 1953;6:963–968. doi: 10.1002/1097-0142(195309)6:5<963::aid-cncr2820060515>3.0.co;2-q. [DOI] [PubMed] [Google Scholar]
- 28.Harris LC, Remack JS, Brent TP. Identification of a 59 bp enhancer located at the first exon/intron boundary of the human O6-methylguanine DNA methyltransferase gene. Nucleic Acids Res. 1994;22:4614–4619. doi: 10.1093/nar/22.22.4614. [DOI] [PMC free article] [PubMed] [Google Scholar]
- 29.Chen FY, Harris LC, Remack JS, Brent TP. Cytoplasmic sequestration of an O6-methylguanine-DNA methyltransferase enhancer binding protein in DNA repair-deficient human cells. Proc Natl Acad Sci U S A. 1997;94:4348–4353. doi: 10.1073/pnas.94.9.4348. [DOI] [PMC free article] [PubMed] [Google Scholar]
- 30.Stirzaker C, Song JZ, Davidson B, Clark SJ. Transcriptional gene silencing promotes DNA hypermethylation through a sequential change in chromatin modifications in cancer cells. Cancer Res. 2004;64:3871–3877. doi: 10.1158/0008-5472.CAN-03-3690. [DOI] [PubMed] [Google Scholar]
- 31.Winship I, Win AK. The Australasian Colorectal Cancer Family Registry. Med J Aust. 2012;197:480–481. doi: 10.5694/mja12.11395. [DOI] [PubMed] [Google Scholar]
- 32.Ogino S, Kawasaki T, Brahmandam M, Cantor M, Kirkner GJ, Spiegelman D, et al. Precision and performance characteristics of bisulfite conversion and real-time PCR (MethyLight) for quantitative DNA methylation analysis. J Mol Diagn. 2006;8:209–217. doi: 10.2353/jmoldx.2006.050135. [DOI] [PMC free article] [PubMed] [Google Scholar]
- 33.Kwok CT, Hitchins MP. Allele Quantification Pyrosequencing(R) at Designated SNP Sites to Detect Allelic Expression Imbalance and Loss-of-Heterozygosity. Methods Mol Biol. 2015;1315:153–171. doi: 10.1007/978-1-4939-2715-9_12. [DOI] [PubMed] [Google Scholar]
- 34.Ogino S, Stampfer M. Lifestyle factors and microsatellite instability in colorectal cancer: the evolving field of molecular pathological epidemiology. J Natl Cancer Inst. 2010;102:365–367. doi: 10.1093/jnci/djq031. [DOI] [PMC free article] [PubMed] [Google Scholar]
- 35.Ogino S, Chan AT, Fuchs CS, Giovannucci E. Molecular pathological epidemiology of colorectal neoplasia: an emerging transdisciplinary and interdisciplinary field. Gut. 2011;60:397–411. doi: 10.1136/gut.2010.217182. [DOI] [PMC free article] [PubMed] [Google Scholar]
- 36.Ogino S, Campbell PT, Nishihara R, Phipps AI, Beck AH, Sherman ME, et al. Proceedings of the second international molecular pathological epidemiology (MPE) meeting. Cancer Causes Control. 2015;26:959–972. doi: 10.1007/s10552-015-0596-2. [DOI] [PMC free article] [PubMed] [Google Scholar]
- 37.Ogino S, King EE, Beck AH, Sherman ME, Milner DA, Giovannucci E. Interdisciplinary education to integrate pathology and epidemiology: towards molecular and population-level health science. Am J Epidemiol. 2012;176:659–667. doi: 10.1093/aje/kws226. [DOI] [PMC free article] [PubMed] [Google Scholar]
- 38.Heyn H, Sayols S, Moutinho C, Vidal E, Sanchez-Mut JV, Stefansson OA, et al. Linkage of DNA methylation quantitative trait loci to human cancer risk. Cell Rep. 2014;7:331–338. doi: 10.1016/j.celrep.2014.03.016. [DOI] [PubMed] [Google Scholar]
Associated Data
This section collects any data citations, data availability statements, or supplementary materials included in this article.