Abstract
This article describes data related to a research article entitled “Fluorescent cyanine dyes for the quantification of low amounts of dsDNA” (B. Bruijns, R. Tiggelaar, J. Gardeniers, 2016) [1]. Six cyanine dsDNA dyes - EvaGreen, SYBR Green, PicoGreen, AccuClear, AccuBlue NextGen and YOYO-1 – are investigated and in this article the absorption spectra, as well as excitation and emission spectra, for all six researched cyanine dyes are given, all recorded under exactly identical experimental conditions. The intensity graphs, with the relative fluorescence in the presence of low amounts of dsDNA, are also provided.
Specifications Table
| Subject area | Chemistry, Biology |
| More specific subject area | Fluorescent cyanine dyes for the quantification of low amounts of dsDNA |
| Type of data | Table, figure |
| How data was acquired | Microplate reader and cuvette measurements |
| Data format | Processed |
| Experimental factors | Type of dye, amount of DNA |
| Experimental features | Spectra (absorption, excitation and emission) and fluorescence intensity |
| Data source location | Enschede, The Netherlands |
| Data accessibility | Data is given in this article |
Value of the data
-
•
The optimal wavelengths of absorption, emission and excitation of six cyanine dyes - EvaGreen, SYBR Green, PicoGreen, AccuClear, AccuBlue NextGen and YOYO-1 – are determined for identical experimental settings and spectral data is given in this article.
-
•
The fluorescence intensities of these cyanine dyes with low amounts of dsDNA (pg–ng range) are recorded and if present the linear ranges are reported in the datasets in this article.
-
•
For AccuClear and AccuBlue NextGen this is, as far as known by the authors, the first set of data in an academic journal.
1. Data
Cyanine dyes can be used to quantify the amount of dsDNA within a sample. The linearity of fluorescence, as function of DNA amount of six dyes, is obtained by measuring the fluorescence intensity at the optimal excitation and emission maxima.
In Appendix A of Supplementary material a detailed overview is given about the characteristics and spectral behaviour of the researched dyes, such as the absorption, excitation and emission wavelengths at which maxima occur. The wavelengths at which these maxima occur as available in literature are listed in Table 1.1 and the measured dataset of the absorption, emission, excitation and fluorescence intensity graphs are given in Fig. 2.1, Fig. 2.2, Fig. 2.3, Fig. 2.4, Fig. 2.5, Fig. 2.6, Fig. 2.7, Fig. 2.8, Fig. 2.9, Fig. 2.10, Fig. 2.11, Fig. 2.12, Fig. 2.13, Fig. 2.14, Fig. 2.15, Fig. 2.16, Fig. 2.17, Fig. 2.18, Fig. 2.19, Fig. 2.20, Fig. 2.21, Fig. 2.22, Fig. 2.23, Fig. 2.24, Fig. 2.25, Fig. 2.261 (and listed in Table 3 in [1]).
Table 1.1.
Absorption, excitation and emission wavelengths of various dyes free in solution and dye/dsDNA complexes.
| Dye | Absorption |
Excitation |
Emission |
Ref. | |||
|---|---|---|---|---|---|---|---|
| Free | Complex | Free | Complex | Free | Complex | ||
| EG | 503 nm | 527 nm | [2] | ||||
| 470 nm | 500 nm | 495 nm | 500 nm | 525 nm | 530 nm | [3] | |
| 500 nm | 529 nm | [4] | |||||
| SG | 494 nm | 496 nm | 530 nm | 522 nm | [5] | ||
| 494 nm | 524 nm | [6] | |||||
| 497 nm | 520 nm | [7]a | |||||
| PG | 498 nm | 501 nm | 528 nm | 522 nm | [5] | ||
| 500 nm | 523 nm | [8] | |||||
| 480 nm | 520 nm | [9]a[10] | |||||
| 502 nm | 523 nm | [9]a | |||||
| 500 nm | 480 nm | 520 nm | [11] | ||||
| AC | 468 nm | 468 nm | 507 nm | [12]a | |||
| AB | 468 nm | 468 nm | 507 nm | [13]a | |||
| YO | 475 nm | 490 nm | 549 nm | 507 nm | [5] | ||
| 491 nm | 491 nm | 509 nm | [14], [15]a | ||||
| 460 nm | 490 nm | 560 nm | 510 nm | [16] | |||
| 455 nm | 485 nm | 509 nm | [17] | ||||
=information from the manufacturer of the dye.
Fig. 2.1.
Absorption spectra of 1.0X EvaGreen (green lines), SYBR Green (purple lines), PicoGreen (red lines), AccuClear (aqua lines) and AccuBlue NextGen (orange lines) free dye (dash lines) and in the presence of 10 ng (AC, AB) or 100 ng (EG, SG and PG) salmon dsDNA (solid lines). Spectra were recorded with a M200 PRO microplate reader (Tecan).
Fig. 2.2.
Absorption spectra of 1.0X EvaGreen free dye (dash line) and in the presence of various amounts of dsDNA (solid lines). Spectra were recorded with a M200 PRO microplate reader (Tecan).
Fig. 2.3.
Absorption spectra of 1.0X SYBR Green free dye (dash line) and in the presence of various amounts of dsDNA (solid lines). Spectra were recorded with a M200 PRO microplate reader (Tecan).
Fig. 2.4.
Absorption spectra of 1.0X PicoGreen free dye (dash line) and in the presence of various amounts of dsDNA (solid lines). Spectra were recorded with a M200 PRO microplate reader (Tecan).
Fig. 2.5.
Absorption spectra of 1.0X AccuClear free dye (dash line) and in the presence of various amounts of dsDNA (solid lines). Spectra were recorded with a M200 PRO microplate reader (Tecan).
Fig. 2.6.
Absorption spectra of 1.0X AccuBlue NextGen free dye (dash line) and in the presence of various amounts of dsDNA (solid lines). Spectra were recorded with a M200 PRO microplate reader (Tecan).
Fig. 2.7.
Absorption spectra of 100 nM YOYO-1 free dye (dash line) and in the presence of various amounts of dsDNA (solid lines). Spectra were recorded with a M200 PRO microplate reader (Tecan).
Fig. 2.8.
Excitation (dash lines) and emission (solid lines) spectra of 1.0X EvaGreen (green lines), SYBR Green (purple lines), PicoGreen (red lines), AccuClear (aqua lines), AccuBlue NextGen (orange lines) and 100 nM YOYO-1 (blue lines) free dye. Spectra were recorded with a LS55 fluorescence spectrometer (Perkin Elmer) (excitation slit: 2.5 nm, emission slit: 3.5 nm).
Fig. 2.9.
Excitation (dash lines) and emission (solid lines) spectra of 1.0X EvaGreen (green lines), SYBR Green (purple lines), PicoGreen (red lines), AccuClear (aqua lines), AccuBlue NextGen (orange lines) and 100 nM YOYO-1 (blue lines) in the presence of 50 ng/µL (4.76 ng/µL for AccuClear and AccuBlue NextGen) salmon dsDNA. Spectra were recorded with a LS55 fluorescence spectrometer (Perkin Elmer) (excitation slit: 2.5 nm, emission slit: 3.5 nm).
Fig. 2.10.
Excitation and emission spectra of 1.0X EvaGreen free dye (light green) and in the presence of 50 ng/µL salmon dsDNA (dark green). Spectra were recorded with a LS55 fluorescence spectrometer (Perkin Elmer) (excitation slit: 2.5 nm, emission slit: 3.5 nm).
Fig. 2.11.
Excitation and emission spectra of 1.0X SYBR Green free dye (light purple) and in the presence of 50 ng/µL salmon dsDNA (dark purple). Spectra were recorded with a LS55 fluorescence spectrometer (Perkin Elmer) (excitation slit: 2.5 nm, emission slit: 3.5 nm).
Fig. 2.12.
Excitation and emission spectra of 1.0X PicoGreen free dye (light red) and in the presence of 50 ng/µL salmon dsDNA (dark red). Spectra were recorded with a LS55 fluorescence spectrometer (Perkin Elmer) (excitation slit: 2.5 nm, emission slit: 3.5 nm).
Fig. 2.13.
Excitation and emission spectra of 1.0X AccuClear free dye (light aqua) and in the presence of 4.76 ng/µL salmon dsDNA (dark aqua). Spectra were recorded with a LS55 fluorescence spectrometer (Perkin Elmer) (excitation slit: 2.5 nm, emission slit: 3.5 nm).
Fig. 2.14.
Left: Excitation and emission spectra of 1.0X AccuBlue NextGen free dye (light orange) and in the presence of 4.76 ng/µL salmon dsDNA (dark orange). Spectra were recorded with a LS55 fluorescence spectrometer (Perkin Elmer) (excitation slit: 2.5 nm, emission slit: 3.5 nm).
Fig. 2.15.
Left: Excitation and emission spectra of 100 nM YOYO-1 free dye (light blue) and in the presence of 50 ng/µL salmon dsDNA (dark blue). Spectra were recorded with a LS55 fluorescence spectrometer (Perkin Elmer) (excitation slit: 2.5 nm, emission slit: 3.5 nm).
Fig. 2.16.
Relative fluorescence of 1.0X EvaGreen in the presence of 0–5000 pg salmon dsDNA. The insert shows the lower region of the curve. Spectra were recorded with a M200 PRO microplate reader (Tecan), gain 100. The error bars are ±1 standard deviation.
Fig. 2.17.
Relative fluorescence of 1.0X EvaGreen in the presence of 0–5000 ng salmon dsDNA. The insert shows the lower region of the curve with the R2-value given for 0.2–100 ng dsDNA. Spectra were recorded with a M200 PRO microplate reader (Tecan), gain 100. The error bars are ±1 standard deviation.
Fig. 2.18.
Relative fluorescence of 1.0X SYBR Green in the presence of 0–5000 pg salmon dsDNA. The insert shows the lower region of the curve. Spectra were recorded with a M200 PRO microplate reader (Tecan), gain 50. The error bars are ±1 standard deviation.
Fig. 2.19.
Relative fluorescence of 1.0X SYBR Green in the presence of 0–10,000 ng salmon dsDNA. The insert shows the lower region of the curve. Spectra were recorded with a M200 PRO microplate reader (Tecan), gain 50. The error bars are ±1 standard deviation.
Fig. 2.20.
Relative fluorescence of 1.0X PicoGreen in the presence of 0–1000 pg control (light red diamonds) and 0–5000 pg salmon dsDNA (dark red squares). The insert shows the lower region of the curve, with the R2-value given for 10–1000 pg dsDNA. Spectra were recorded with a M200 PRO microplate reader (Tecan), gain 100. The error bars are ±1 standard deviation.
Fig. 2.21.
Relative fluorescence of 1.0X PicoGreen in the presence of 0–1000 ng control (light red squares) and salmon dsDNA (dark red diamonds). The insert shows the lower region of the curve, with the R2-value given for 1–100 ng dsDNA. Spectra were recorded with a M200 PRO microplate reader (Tecan), gain 100. The error bars are ±1 standard deviation.
Fig. 2.22.
Relative fluorescence of 1.0X AccuClear in the presence of 0–1000 pg control (light aqua diamonds) and 0–500 pg salmon dsDNA (dark aqua squares). The insert shows the lower region of the curve, with the R2-value given for 3–1000 pg control dsDNA and 5–500 pg salmon dsDNA. Spectra were recorded with a M200 PRO microplate reader (Tecan), gain 100. The error bars are ±1 standard deviation.
Fig. 2.23.
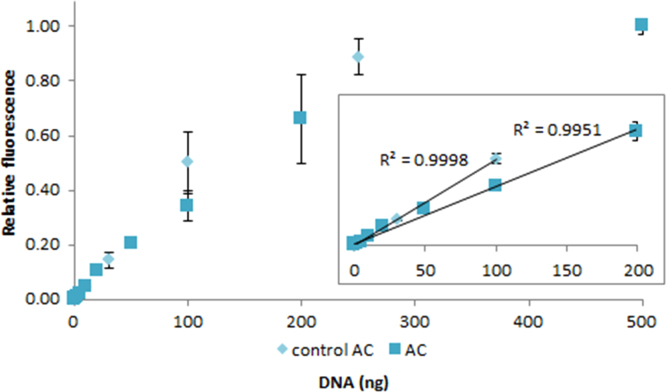
Relative fluorescence of 1.0X AccuClear in the presence of 0–250 ng control (light aqua diamonds) and 0–500 ng salmon dsDNA (dark aqua squares). The insert shows the lower region of the curve, with the R2-value given for 0.003–100 ng control dsDNA and 0.01–200 ng salmon dsDNA. Spectra were recorded with a M200 PRO microplate reader (Tecan), gain 100. The error bars are ±1 standard deviation.
Fig. 2.24.
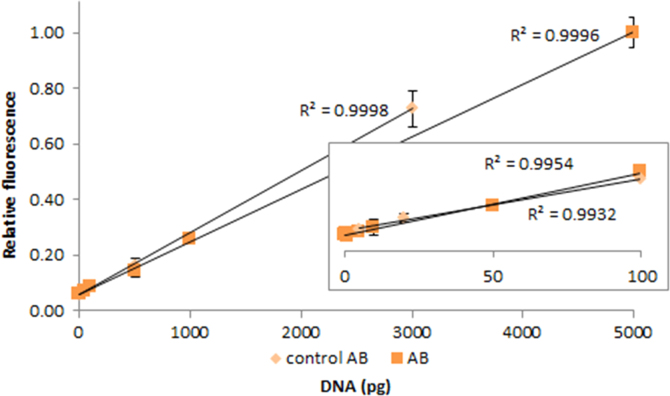
Relative fluorescence of 1.0X AccuClear in the presence of 0–3000 pg control (light orange diamonds) and 0–5000 pg salmon dsDNA (dark orange squares), with the R2-value. The insert shows the lower region of the curve, with the R2-value given for 5–100 pg control dsDNA and 0.1–100 pg salmon dsDNA. Spectra were recorded with a M200 PRO microplate reader (Tecan), gain 100. The error bars are ±1 standard deviation.
Fig. 2.25.
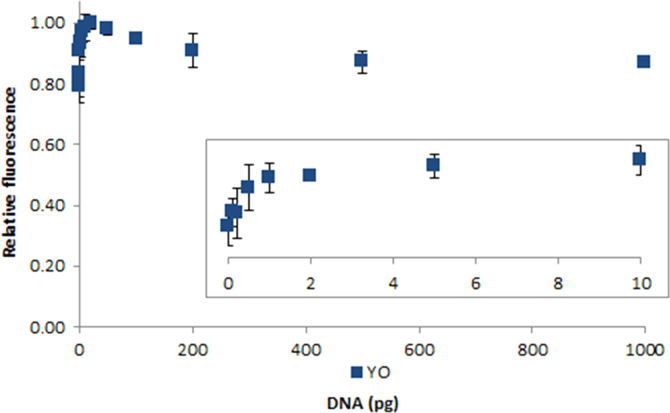
Relative fluorescence of 100 nM YOYO-1 in the presence of 0–1000 pg salmon dsDNA. The insert shows the lower region of the curve. Spectra were recorded with a M200 PRO microplate reader (Tecan), gain 50. The error bars are ±1 standard deviation.
Fig. 2.26.
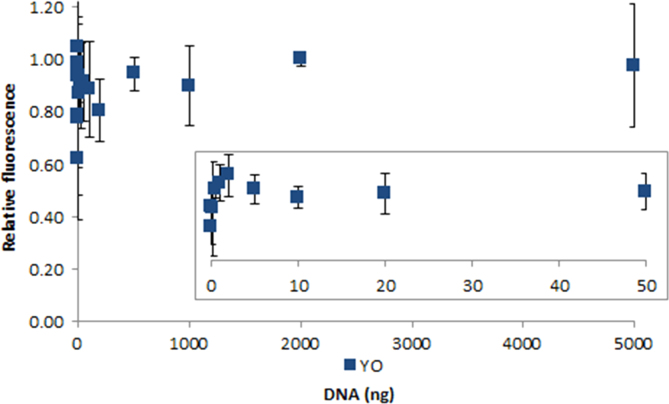
Relative fluorescence of 100 nM YOYO-1 in the presence of 0–5000 ng salmon dsDNA. The insert shows the lower region of the curve. Spectra were recorded with a M200 PRO microplate reader (Tecan), gain 50. The error bars are ±1 standard deviation.
2. Experimental design, materials and methods
The materials and methods used to obtain the dataset of the absorption, excitation, emission and fluorescence intensity graphs are given in [1].
Footnotes
Since fluorescence is measured in relative fluorescence units (RFU), data cannot be directly compared. Therefore, relative intensities are used in most procedures; the data in most of the graphs are normalized. For the absorbance graphs with all the dyes also the background is subtracted (i.e. the lowest value equals 0).
Transparency data associated with this article can be found in the online version at http://dx.doi.org/10.1016/j.dib.2016.11.090.
Supplementary data associated with this article can be found in the online version at http://dx.doi.org/10.1016/j.dib.2016.11.090.
Transparency document. Supplementary material
Supplementary material
.
Appendix A. Supplementary material
Supplementary material
.
References
- 1.Bruijns B., Tiggelaar R., Gardeniers H. Fluorescent cyanine dyes for the quantification of low amounts of dsDNA. Anal. Biochem. 2016;no. 511:74–79. doi: 10.1016/j.ab.2016.07.022. [DOI] [PubMed] [Google Scholar]
- 2.J. Ihrig R. Lill U. Mühlenhoff, Application of the DNA-specific dye EvaGreen for the routine quantification of DNA in microplates, 2006. 10.1016/j.ab.2006.07.043 [DOI] [PubMed]
- 3.F. Mao W. Leung X. Xin. Characterization of EvaGreen and the implication of its physicochemical properties for qPCR applications, 2007 http://dx.doi.org/10.1186/1472–6750-7–76 [DOI] [PMC free article] [PubMed]
- 4.F. Sang J. Ren. Capillary electrophoresis of double-stranded DNA fragments using a new fluorescence intercalating dye EvaGreen, 2006 10.1002/jssc.200600029 [DOI] [PubMed]
- 5.Cosa G., Focsaneanu K., McLean J., McNamee J., Scaiano J. Photophysical properties of fluorescent DNA-dyes bound to single-and double-stranded DNA in aqueous buffered solution. Photochem. Photobiol. 2001;73(6):585–599. doi: 10.1562/0031-8655(2001)073<0585:PPOFDD>2.0.CO;2. [DOI] [PubMed] [Google Scholar]
- 6.H. Zipper H. Brunner J. Bernhagen F. Vitzthum. Investigations on DNA intercalation and surface binding by SYBR Green I, its structure determination and methodological implications, 2004 10.1093/nar/gnh101 [DOI] [PMC free article] [PubMed]
- 7.Thermo Fisher Scientific. SYBR Green I Nucleic Acid Gel Stain, 10,000X concentrate in DMSO, 2015. (Online) Available〈www.lifetechnologies.com/order/catalog/product/S7567〉.
- 8.V.Singer, L.Jones, S.Yue and R.Haugland, Characterization of PicoGreen reagent and development of a fluorescence-based solution assay for double-stranded DNA quantitation. [Online]. Available: 10.1006/abio.1997.2177, 1997. [DOI] [PubMed]
- 9.Thermo Fisher Scientific, Quant-iT PicoGreen dsDNA Assay Kit, [Online]. Available: 〈https://www.lifetechnologies.com/order/catalog/product/P7589〉, 2015.
- 10.Schofield G. PicoGmeter, a custom-made fluorometer for the quantification of dsDNA by PicoGreen fluorescence. BioTechniques. 2004;37(5):778–782. doi: 10.2144/04375ST03. [DOI] [PubMed] [Google Scholar]
- 11.A. Dragan J. Casas-Finet E. Bishop R. Strouse M. Schenerman C. Geddes. Characterization of PicoGreen interaction with dsDNA and the origin of its fluorescence enhancement upon binding, 2010 10.1016/j.bpj.2010.09.012 [DOI] [PMC free article] [PubMed]
- 12.Biotium, dsDNA quantitation kits; AccuBlue and AccuClear dsDNA Quantitation Kits for fluorescence-based dsDNA quantitation in solution, [Online]. Available: 〈https://biotium.com/product-category/applications/genomics/nucleic-acid-quantitation-in-solution〉, 2015.
- 13.Biotium, AccuBlue NextGen dsDNA Quantitation Kit, [Online]. Available: 〈https://biotium.com/product/accublue-nextgen-dsdna-quantitation-kit〉, 2015.
- 14.Thermo Fisher Scientific The Molecular Probes Handbook; A guide to fluorescent probes and labeling technologies, Life Technologies Corporation, 2010.
- 15.Thermo Fisher Scientific, YOYO-1 Iodide (491/509) - 1 mM Solution in DMSO, [Online]. Available: 〈https://www.lifetechnologies.com/order/catalog/product/Y3601〉, 2015.
- 16.A. Fürstenberg M. Julliard T. Deligeorgiev N. Gadjev A. Vasilev E. Vauthey. Ultrafast excited-state dynamics of DNA fluorescent intercalators: new insight into the fluorescence enhancement mechanism, 2006 10.1021/ja0609001 [DOI] [PubMed]
- 17.Rye H., Yue S., Wemmer D., Quesada M., Haugland R., Mathies R., Glazer A. Stable fluorescent complexes of double-stranded DNA with bis-intercalating asymmetric cyanine dyes: properties and applications. Nucleic Acids Res. 1992;20(11):2803–2812. doi: 10.1093/nar/20.11.2803. [DOI] [PMC free article] [PubMed] [Google Scholar]
Associated Data
This section collects any data citations, data availability statements, or supplementary materials included in this article.
Supplementary Materials
Supplementary material
Supplementary material


