

Abstract
We present a highly accurate method for identifying genes with conserved RNA secondary structure by searching multiple sequence alignments of a large set of candidate orthologs for correlated arrangements of reverse-complementary regions. This approach is growing increasingly feasible as the genomes of ever more organisms are sequenced. A program called msari implements this method and is significantly more accurate than existing methods in the context of automatically generated alignments, making it particularly applicable to high-throughput scans. In our tests, it discerned clustalw-generated multiple sequence alignments of signal recognition particle or RNaseP orthologs from controls with 89.1% sensitivity at 97.5% specificity and with 74.4% sensitivity with no false positives in 494 controls. We used msari to conduct a comprehensive scan for secondary structure in mRNAs of coding genes, and we found many genes with known mRNA secondary structure and compelling evidence for secondary structure in other genes. msari uses a method for coping with sequence redundancy that is likely to have applications in a large set of other comparison-based search methods. The program is available for download from http://theory.csail.mit.edu/MSARi.
The structure of RNA is to a large extent determined by cis base pairing (AU, GC, and GU). This base-pairing is referred to as secondary structure. A noncoding RNA (ncRNA) (1) gene expresses RNA that is never translated into protein but is nonetheless biologically significant. Examples of such genes are tRNAs and XIST, which in mammalian males suppresses expression of genes on the X chromosome (2–4). RNA secondary structure in mRNAs can also be biologically significant, controlling timing and localization of protein expression (5). Identifying such secondary structure will be crucial to a complete understanding of cellular biology (6).
Most work on identifying RNA secondary structure has been in the context of searching for ncRNA genes. Some approaches to automated identification of ncRNA genes have focused on searching for a recognizable secondary structure associated with RNA transcripts serving a specific biological function. One example of this type of program is Eddy and coworkers' trnascan-se (7, 8), which searches for tRNAs. Others are Regalia et al.'s search for signal recognition particles (9) and Rhoades et al.'s search for microRNAs (10).
Automatically identifying novel biologically significant RNA secondary structure has proven to be difficult. By itself, RNA secondary structure in stand-alone genes is not particularly amenable to computer-based recognition methods, as many RNA sequences seem to have thermodynamically plausible secondary structures of no biological relevance (11). Moreover, ncRNA genes cannot be discerned by using standard computational gene detection algorithms, which are targeted at genes that express proteins and rely heavily on locating stop codons and other protein-specific guides (12–17).
Comparative methods provide a way to cut through the abundance of plausible, but irrelevant, structures: only secondary structure that is conserved across species is likely to be biologically significant. We are aware of two programs that search for secondary structure by comparing potentially orthologous sequences. The first is qrna (1, 18), which scans pairwise alignments of homologous DNA sequences from related genomes. It uses a statistical model that flags alignments exhibiting mutation patterns preserving base-pairing in a thermodynamically plausible RNA secondary structure. Since first submitting this article for publication, we have also learned of a program called ddbrna (19), which tests for complementary mutations in three-sequence multiple sequence alignments (MSAs).
A serious problem with both qrna and ddbrna is that they can only detect complementary mutations of orthologous base pairs that have been accurately aligned to each other (1, 19). This makes them imperfect for large-scale genome scans, as standard alignment algorithms do not reliably align such base pairs. For a sufficiently large hand-curated MSA of known ncRNA orthologs at the right evolutionary distance from each other, in which many orthologous base pairs are aligned, covariation between the corresponding columns of the MSA can be used to discern it from controls such as those described in Results with nearly perfect accuracy. However, hand curation of MSAs cannot be part of any high-throughput genomic scan.
A related problem to RNA secondary structure detection is fine-grained secondary-structure prediction. This is the problem of determining all of the base pairs in sequences known to have secondary structure. Hofacker et al.'s program alifold (20) and Fariza et al.'s dcfold (21) use MSAs of known ncRNA orthologs for secondary-structure prediction, but not detection. In the context of pairs of sequences, Mathews and Turner's dynalign (22) and Sankhoff's sequence/structure alignment algorithm (23) can be used for structure prediction.
Secondary-structure prediction requires sufficient sensitivity to predict almost all base pairs and can have relatively low specificity without degrading its usefulness. Detection of secondary structure in a full-genome scan requires much greater specificity, but can be useful with much-lower-per-base pair sensitivity. Large MSAs have long been used for manual prediction of ncRNA secondary structure and have also recently been used in automated structure prediction (20, 24–26), but we are not aware of any earlier attempt to use them in searches for novel RNA secondary structure.
Here, we propose an ab initio RNA secondary-structure detection scheme using large MSAs that does not rely on knowledge from or training on particular RNA secondary structures. The statistical evidence for conservation of RNA secondary structure across many sequences is often so strong that simple, robust statistical models can be used to detect it. In particular, as well as being a far more accurate detection scheme than its predecessors, to our knowledge ours is currently the only one that copes with the inaccuracies typical to automatically generated alignments. Our approach is based on computing the statistical significance of short, contiguous potential secondarystructure base-paired regions that are conserved between candidate orthologs and allows for small variations between alignments of orthologous base pairs. To cope with the wide range of evolutionary distances that can exist between sequences in a large MSA, it uses a distribution-mixture method that should have application to other comparative search problems.
The msari program, which implements the MSA method presented here, is more accurate than qrna or ddbrna. With a cutoff giving 97.5% specificity, it has 89.1% sensitivity, and with a cutoff giving 74.4% sensitivity, there were no false positives in our test data of 494 controls. We tested on 10- and 15-sequence MSAs of signal recognition particle or RNaseP orthologs and generated controls by shuffling the columns of these, in analogy to the tests described by Rivas and Eddy (1). On similar data (but necessarily with smaller MSAs containing far less information), ddbrna had 49.0% sensitivity with 97.7% specificity, and qrna had 28.6% sensitivity with 99.1% specificity.
We used msari to scan the The Institute for Genomic Research Eukaryotic Gene Orthologs (TIGR EGO) database (www.tigr.org/tdb/tgi/ego) (35) for orthologs with conserved RNA secondary structure (see Results). This search yielded many genes with known secondary structure, and made many predictions of conserved secondary structure (see Table 1).
Table 1. EGO ortholog classes in which msari found significant conservation of secondary structure.
| EGO accession no. | msari significance | Sequence names and roles | Known secondary structure |
|---|---|---|---|
| TOG126766 | –56.99 | rRNA intron-encoded homing endonuclease | Yes |
| TOG126402 | –55.03 | ||
| TOG127160 | –54.68 | ||
| TOG127627 | –46.86 | Malate dehydrogenase mitochondrial precursor | Yes |
| TOG126375 | –46.68 | Monooxygenase | Yes |
| TOG126497 | –46.25 | Serine/threonine phosphatase | |
| TOG127343 | –44.78 | Adenosylhomocysteinase | |
| TOG129802 | –43.47 | ||
| TOG126712 | –42.32 | RNA helicase | |
| TOG126428 | –41.70 | Heat shock | Yes |
| TOG128897 | –40.41 | Chloroplast precursor | |
| TOG128956 | –37.42 | Cyclophilin | |
| TOG127614 | –36.40 | Ras-related GTP binding | |
| TOG127244 | –36.35 | Nonmuscle myosin heavy chain | Yes |
| TOG126639 | –34.25 | Aldehyde dehydrogenase | Yes |
| TOG127024 | –33.94 | Proteasome subunit | |
| TOG126979 | –33.45 | Glucose-related Ig | Yes |
| TOG126982 | –32.82 | Seryl-tRNA synthetase | Yes |
| TOG128055 | –32.73 | CDH1-D | |
| TOG127088 | –32.67 | 14-3-3 | |
| TOG126299 | –32.26 | β tubulin | Yes |
| TOG126989 | –32.24 | Cardiac l-type calcium channel | |
| TOG126537 | –32.18 | Peroxiredoxin | |
| TOG128383 | –31.64 | Chaperonin | |
| TOG126893 | –31.50 | Glyceraldehyde-3-phosphate dehydrogenase | |
| TOG126944 | –31.45 | Methionine aminopeptidase | |
| TOG126736 | –31.45 | α tubulin | Yes |
| TOG127919 | –31.39 | Succinate dehydrogenase, flavoprotein subunit | |
| TOG128571 | –31.28 | Actin | Yes |
| TOG128538 | –30.90 | Phosphoenolpyruvate carboxylase | |
| TOG127997 | –30.66 | Pyruvate dehydrogenase E1 α subunit | |
| TOG127466 | –30.43 | Sodium channel α subunit | Yes |
| TOG126748 | –30.33 | Lipoamide dehydrogenase | |
| TOG127127 | –30.14 | Casein kinase 2 α subunit | |
| TOG126615 | –30.07 | Enolase (2-phosphoglycerate dehydratase) | Yes |
| TOG126472 | –29.94 | Methionine adenosyltransferase | |
| TOG127409 | –29.85 | GTP binding | |
| TOG127282 | –29.63 | ||
| TOG127052 | –29.48 | Myo-inositol-1-phosphate synthase |
When EGO gave apparently contradictory descriptions for the genes in a class, we chose the description pertaining to the most genes. Some descriptions are associated with more than one significant ortholog class. In those cases, we show only the class in which msari found the highest score. We searched the literature in an attempt to determine whether these or very similar genes are already known to contain mRNA secondary structure. We found positive indications in refs. 36-47
Algorithm
Overview. The algorithm used by msari is based on two key innovations. First, it allows for slight misalignments of orthologous base pairs by looking for imperfectly aligned, yet statistically significant, reverse complementarity. msari can tolerate misalignments of orthologous base pairs up to a distance of two characters. Whereas automated alignments rarely align every set of orthologous helices that accurately, msari only needs to find a few significant base-paired regions to confidently identify conserved secondary structure. There are usually a few helices in sufficiently well conserved regions of the orthologs, so this is all of the flexibility needed. Second, it estimates the significance of variations in highly redundant sequences, based on determining which portions of sequences within the MSAs should be treated as mutations of other sequences and which portions are so different that they should be treated as independently selected.
Estimating the Significance of Reverse Complementarity. When msari processes an MSA, it first uses rnafold (27) (a program that predicts the secondary structure of individual sequences) as a preprocessor to locate probable base pairs in each of the constituent sequences. For each pair of positions in the MSA where rnafold predicted that a sequence had a probability of >5% of base pairing, msari examines windows of length 7 around the pair for complementary mutations.‡ By examining only such window pairs, rather than all pairs, msari greatly increases its sensitivity, because it reduces the Bonferroni multiple-sampling factors in the null-hypothesis probability estimates described below.
Suppose a pair of positions v1 and v2 are chosen in this way. Assume v1 < v2. For each sequence in the MSA, the window of seven nucleotide characters centered on v1 is considered. To compensate for possible misalignments, multiple windows in the vicinity of v2 are considered, namely the five windows of seven nucleotide characters centered on v2 ± {0, 1, 2}. The number of reverse-complementary positions in each pair of windows is counted, and the window near v2 with the largest number of positions reverse-complementary to the v1 window is chosen. For instance, suppose the window centered on v1 contains GUGAGUU, while the nucleotides to be considered around v2 are CAGACUCACGG. Then the window that will be chosen near v2 is GACUCAC, because all seven positions are reverse-complementary (G-C, U-A, G-C, A-U, G-C, U-A, and U-G) while the other windows near v2 have two or three reverse-complementary positions.
The nucleotides in these windows are assumed to be independently drawn from null-hypothesis distributions that will be described shortly. Given these distributions, we compute the probability p of seeing at least as many complementary positions as observed in the chosen pair of windows. To compensate for the fact that five window pairs were considered, the nullhypothesis probability of this sequence at this pair of positions is estimated by 1 - (1 - p)5. To get an estimate for the entire MSA at this pair of positions, estimates for all its sequences are computed and multiplied together.
We used a Bonferroni-style test for rejection of the null hypothesis. In 15-sequence MSAs, if this procedure yields a probability of <1/(200 * no. of region-pairs considered) for a given pair, we consider the pair to be significant. Thus, we are only considering pairs exhibiting a degree of complementary mutation that would occur in <0.05% of MSAs drawn from the null-hypothesis distribution. For 10-sequence MSAs, only pairs with probabilities <1/(5 * no. of region-pairs considered) are considered. (These cutoffs were chosen empirically.) The significant pairs are sorted by significance, and msari selects a subset in which there are no pseudoknots: it chooses the most significant pair, then the next most significant that does not form a pseudoknot in conjunction with the first, and so on. Finally, it multiplies the probabilities for the selected pairs together, and this product is used as the estimate for the significance of the sequence.
Distribution Mixtures. To estimate the significance of observed base pairs, a null-hypothesis model for random mutations in an MSA of related sequences is needed. For ease of computation, we want to treat the events in separate sequences as independent. To this end, our null-hypothesis model varies from sequence to sequence within the MSA and incorporates the possibilities that a sequence is either brand-new or is closely related to earlier sequences in the MSA. The model weights these possibilities according to the degree of local similarity between sequences.
The resulting distributions are essentially mixtures, similar to the distribution mixtures that arise in Bayesian statistics (28). The component distributions are derived from the following possible events, for which examples are given in the next section:
The current sequence window is closely related to a prior sequence, and the current nucleotide is the same as the nucleotide at the same position in that sequence. In this case, a constant distribution that always returns that nucleotide is used.
The current sequence window is closely related to a prior sequence, and the current nucleotide is a mutation from the nucleotide at the same position in the sequence. In this case, the distribution is computed from the local preponderance of nucleotides, with the nucleotide in the prior sequence removed. The nucleotides in all sequences in the MSA within the window of length 7 centered on the current position are used to compute this distribution.
The current sequence window is too far from the sequences seen so far, and the current nucleotide is drawn from a separate distribution computed from the local preponderance of nucleotides. Only the nucleotides in the current sequence and current window are used to compute this distribution.
A weighted sum of these distributions is used as the nullhypothesis distribution for the current position in the current sequence. This mixture contains a distribution for each sequence in the MSA above the current sequence, either distribution type i or ii, depending on whether the nucleotide at the current position in those sequences is the same or different from the current nucleotide. The weighting assigned to these distributions is determined by the degree of similarity between the associated prior sequence and the current sequence. If within the current window the proportion of positions in which the sequences have identical nucleotides is q, then the unnormalized weight assigned to its distribution is q2. If the maximum over the prior sequences of these proportions is Q, then the unnormalized weight assigned to distribution type iii is (1 - Q)2.
Examples of Distribution Mixtures. Thus, suppose msari is estimating the significance of the following regions in an MSA. The base-pair windows are indicated with overlines as shown in Fig. 1. There are no sequences before the first one, so the nucleotide distributions are comprised entirely of distribution type iii. The best pair of windows in the first row is UUGGGUC with GACCUGG. Thus the distribution that the first U in the first window is drawn from is taken from the preponderance of nucleotides in the window of length 7 around it, ACAUUGG. Because this window contains seven nucleotides altogether, and two As, P(A) = 2/7, and similarly, P(C) = 1/7, P(G) = 2/7, and P(U) = 2/7.
Fig. 1.
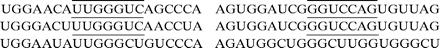
Portions of MSA used in demonstration of msari's algorithm. We describe how msari would calculate the statistical significance of the mutations preserving complementarity between the left and right overbar regions of the sequences.
For the second sequence, the best pair of windows is again UUGGGUC with GGUCCAG, so in this case, each of the nucleotide distributions has a term of type i, coming from the first sequence. Because the sequences are entirely identical in this window, the values q associated with these distributions are unity. It is the only term in the distribution mixture of types i or ii, as there is only one prior sequence. Thus Q is always 1, and all of the nucleotide distributions in this row are constant: the one for the first U in the first row is P(N) = δ(N, U) for any nucleotide N, where δ(x,y) = 0 if x ≠ y, 1 if x = y. Thus the probabilities for drawing complementary base pairs at the respective positions in this pair of windows are all unity, and this sequence contributes nothing to the significance estimate for this pair.
For the third sequence, the best window pair is UUGGGCU with GGCUUGG. The sequence in the second window has changed, so the values of q for both of the previous sequences will be less than unity, and (1 - Q)2 will be nonzero. Thus the distribution associated with the first G in the window will be a mixture of a type i distribution, with weight 2q2 (for the two identical, prior sequences), and a type iii distribution, with weight (1 - q)2. On the other hand, the distribution associated with the first C will be a mixture of a type ii distribution and a type iii distribution. Because it is a mutation from G, the type ii distribution has P(G) = 0 and is given by the preponderances of A, C, and U in the window of length 7 around that position. The complementarity-preserving differences in this sequence mean that it contributes substantially to the significance estimate.
Implementation and Efficiency. We mention the asymptotic efficiency of msari only pro forma, as any algorithm that runs in a reasonable time on sequences with 300 characters could be used to detect most RNA secondary structure, which tends to have a lot of important short-range interactions. Thus one can examine overlapping windows as we have done in Results. The algorithm that rnafold implements takes O(n3) steps, where n is the length of the sequence it is processing, and this is the dominant factor in the asymptotic run time. The number of steps required by msari after this preprocessing is linear in the number of possible base-pairings returned by rnafold, which is O(n2) or less. Thus with respect to sequence length the overall asymptotic runtime of the algorithm is comparable to the O(n3) performance of qrna. The run time of msari also grows quadratically in the number of sequences in the MSA it processes.
The run time of msari on a 15-sequence MSA of 300 bp ranges between 15 sec and 1 min, depending on the number of probable base pairs returned by rnafold. We used a single 2.4-GHz Pentium processor (Intel, Santa Clara, CA) for all tests described in this article.
Apart from the use of rnafold, at the moment msari is implemented entirely in the computer language Python. We believe we could accelerate it by an order of magnitude by rewriting parts of it in the C programming language if necessary, but its current speed has been adequate for our tests so far.
Results
Dataset Generation. Construction of MSAs. All alignments were constructed by using clustalw, which is commonly used in RNA structure detection and prediction. We considered using programs such as mavid (29), multipipmaker (30), or lagan (31) instead, or improving the alignment with a program such as realigner (32), but only a program specifically designed for RNA alignments is likely to align orthologous base pairs with substantially more accuracy. The difficulty is that there is frequently a great deal of variation among the bases in orthologous RNA helices, giving standard alignments relatively few clues about the most accurate alignment. Only an algorithm that specifically includes evidence of base-pair conservation is likely to help with this problem. lagan, multipipmaker, and mavid all are designed to deal with alignments of extremely long sequences, whereas realigner is intended for collation of shotgun reads and uses a heuristic optimized for sequences with very high similarity. Thus, none of these programs are more appropriate than clustalw in a search for RNA secondary structure.
Benchmark datasets. The sequences used in the benchmark dataset tests were eukaryotic signal recognition particle and eukaryotic RNaseP RNA orthologs taken from the signal recognition particle database (33) and the ribonuclease P Database (34), respectively. The artificially generated control MSAs were generated in the same fashion as those of Rivas and Eddy (1) by randomly shuffling the columns of the genuine ncRNA MSAs. To get fair controls by shuffling the columns, it was necessary to then strip the gaps from the shuffled sequences and realign them with clustalw. Otherwise, msari found it easy to detect the controls from randomly interspersed gaps that shuffling by itself produces.
MSAs were constructed by an iterative procedure, successively choosing a sequence, aligning it to the sequences already chosen with clustalw, and only accepting the new sequence if its maximal similarity to the other sequences was between 50% and 95%. This procedure was repeated until 10 or 15 sequences had been chosen, or it was determined that no appropriate sequences remained, in which case the MSA was thrown out and a new initial sequence was chosen. It was necessary to choose MSAs in which the sequences had reasonable similarity and variation. If the MSA broke into sufficiently dissimilar cliques, msari was essentially reduced to estimating the significance of two smaller MSAs, whereas if the sequences in the MSA were too similar, there were not enough mutations for convincing significance estimates. Comparative methods intrinsically require sequences that are similar enough to align with some confidence but different enough to exhibit interesting variation (17). However, the range of variation allowed in these tests is very broad. The performance statistics we cite for qrna and ddbrna are for alignments with sequence identities between 60–80% and 60–100%, respectively.
EGO dataset. For each ortholog class in the EGO database (www.tigr.org/tdb/tgi/ego and ref. 35), we aligned its sequences by using clustalw. To perform the search in a statistically similar context to that of the benchmark datasets, we restricted the search to alignments containing 300 characters or less. In alignments with sequences >300 characters, we separately considered the 300-bp subalignments starting at positions 0, 150, 300, 450, and so on. Then using a breadth-first search from each sequence in the alignments, we looked for subsets of 15 sequences in which each sequence had 65–90% similarity to at least one other sequence in the subset. We produced 4,972 such alignments from 2,853 ortholog classes.
Benchmark Dataset Results. msari's performance. The msari program separates the MSAs of genuine ncRNA orthologs from the control set extremely accurately (see above). With 15-sequence MSAs and a cutoff log-probability threshold of -15.7, msari distinguished genuine MSAs from controls with 89.1% sensitivity and 97.5% specificity, whereas with a threshold of -29.4, it had 74.4% sensitivity and found no false positives of 494 controls (≈99.8% specificity.) With 10-sequence MSAs and a threshold of -31.9, it had 74.9% sensitivity and 97.5% specificity, whereas with a threshold of -48.3, it had 56% sensitivity, and no false positives in 866 controls (≈99.9% specificity.) This is a marked improvement over the performances of qrna and ddbrna.
To confirm that msari's accommodation of misalignments substantially improves its accuracy, we also tested a version of it with this feature turned off. We ran it on 625 of the 10-sequence MSAs described above and found this version of the program had 48% sensitivity at 97.5% specificity and 16.3% sensitivity with no false positives. Although with further tuning we might have marginally improved this performance, this is a significant degradation from the accuracy of the full-featured version.
Tests of other programs. One of our reviewers suggested that the improvement in our performance might stem in part from large MSAs improving clustalw's accuracy: when aligning 15 sequences, clustalw can get more clues about the true alignment than it can when aligning two or three sequences. To test this, we took subalignments of two or three sequences from the 15-sequence MSAs we passed to msari and ran qrna and ddbrna on these. For both programs, we selected groups of subalignments having the same distributions of sequence similarities as described by Rivas and Eddy (1) and di Bernardo et al. (19). The sequence similarities for the alignments we used to test qrna ranged from 60% to 80%, whereas for the ddbrna test set they ranged from 60% to 100%.
This process did not lead to a significant improvement in either program's accuracy. At 99.1% specificity, qrna's sensitivity was 28.6%. This is higher than reported in ref. 1, but almost all of this gain is caused by subsequent improvements in later versions of qrna's algorithm. The performance of ddbrna was slightly worse than the 49.0%/97.5% sensitivity/specificity reported in ref. 19.
We believe that the statistical advantage underlying msari's greater accuracy comes from the much larger MSAs, which it is capable of considering, and its ability to cope with slight misalignments. It is much easier to build up strong evidence for conserved secondary structure when comparing so many sequences. It is not immediately clear how to incorporate these capabilities into the algorithms of qrna or ddbrna.
Searching for Orthologs with Conserved mRNA Secondary Structure. We have used msari to perform a large-scale comparative search for biologically significant RNA secondary structure. We scanned the TIGR EGO database (www.tigr.org/tdb/tgi/ego and ref. 35) for genes with conserved RNA secondary structure, running on 4,972 alignments constructed from 2,853 ortholog classes (see Benchmark datasets). We found that 39 of the ortholog classes produced alignments for which msari reported log probabilities less than the most stringent threshold we chose above for 15-sequence MSAs. See Table 1 for information on the ortholog classes msari flagged. Of such ortholog classes, four have no protein names or functions assigned by EGO's annotations (EGO accession nos. TOG126402, TOG127160, TOG129802, and TOG127282.) We attempted to search the literature for these proteins and found indications that 13 of those listed in Table 1 are already believed to have secondary structure (36–47).
It is very likely that the majority of these ortholog classes have conserved RNA secondary structure. Although the existence of a thermodynamically stable secondary structure for an mRNA does not by itself constitute strong evidence that the secondary structure is biologically significant (11), msari estimates the likelihood that chance alone could account for the compensatory mutations that it observes. This evidence can be extremely compelling. For instance, at msari's most stringent cut-off threshold (-29.4) we would have expected to find only 10 significant alignments by chance alone; instead, we found 60 alignments spread among the flagged ortholog classes, many with much higher significances. Thus the majority of the ortholog classes with scores below this threshold are extremely likely to have important mRNA secondary structure.
Discussion
With genome sequencing capacity skyrocketing, comparative methods based on the genomes of many organisms are now feasible, as our scan of the EGO dataabase shows. Moreover, even full-genome scans are already quite feasible: for instance, there are now >100 bacterial genomes available, and yeast could be scanned by using the seven yeast genomes (17) plus six recently sequenced fungus genomes (www.broad.mit.edu/annotation). Given the current efforts to sequence mammalian genomes, even a full-genome scan for secondary structure in the human genome will be possible very soon.
Solitary ncRNA genes do not seem to exhibit statistical traits as distinctive as codon usage frequencies in coding genes (11), but we have demonstrated that multiple candidate orthologs can provide an ensemble with more than enough information to reliably distinguish conservation of secondary structure.
We plan to extend this approach to predict potentially novel ncRNA genes in yeast and higher eukaryotes through MSAs of whole genomes as they become available. With a blast-like (48) approach to searching for reverse-complementary regions, it may also be possible to search for secondary-structure interactions between different genes in this fashion.
We intend to adapt the msari program to automation of comparative secondary-structure prediction. Because msari's score allows for some misalignments, a structure-prediction method based on it may be more accurate than alifold or dcfold when run on automatically generated MSAs. Indeed, it may be sensible to correct MSAs so they respect the misaligned orthologous base pairs found by msari which uses comparative structure for postprocessing. msari's estimate for the statistical significance of candidate compensatory mutations also copes more flexibly with varying rates of mutation between sequences than alifold or dcfold. It may also be possible to incorporate this estimate in an improved structure-prediction algorithm.
Finally, we believe that the distribution-mixture approach used to construct msari's null-hypotheses could be applied to a broad set of comparative search problems.
Abbreviations: ncRNA, noncoding RNA; MSA, multiple sequence alignment.
Footnotes
We experimented with windows of lengths 5, 6, 7, 9 and 10 and found msari to be most accurate for windows of length 7.
References
- 1.Rivas, E. & Eddy, S. (October 10, 2001) BMC Bioinformatics, 10.1186/1471-2105-2-8. [DOI] [PMC free article] [PubMed]
- 2.Brown, C., Hendrich, B., Rupert, J., Lafreniere, R., Xing, Y., Lawrence, J. & Willard, H. (1992) Cell 71, 527-542. [DOI] [PubMed] [Google Scholar]
- 3.Hong, Y.-K., Ontiveros, S. & Strauss, W. (2000) Mamm. Genome 11, 220-224. [DOI] [PubMed] [Google Scholar]
- 4.Eddy, S. (2001) Nat. Rev. Genet. 2, 919-929. [DOI] [PubMed] [Google Scholar]
- 5.Jansen, R.-P. (2001) Nat. Rev. Mol. Cell Biol. 2, 247-256. [DOI] [PubMed] [Google Scholar]
- 6.Storz, G. (2002) Science 296, 1260-1263. [DOI] [PubMed] [Google Scholar]
- 7.Lowe, T. & Eddy, S. (1997) Nucleic Acids Res. 25, 955-964. [DOI] [PMC free article] [PubMed] [Google Scholar]
- 8.Eddy, S. R. & Durbin, R. (1994) Nucleic Acids Res. 22, 2079-2088. [DOI] [PMC free article] [PubMed] [Google Scholar]
- 9.Regalia, M., Rosenblad, M. & Samuelsson, T. (2002) Nucleic Acids Res. 30, 3368-3377. [DOI] [PMC free article] [PubMed] [Google Scholar]
- 10.Rhoades, M., Reinhart, B., Lim, L., Burge, C., Bartel, B. & Bartel, D. (2002) Cell 110, 513-520. [DOI] [PubMed] [Google Scholar]
- 11.Rivas, E. & Eddy, S. (2000) Bioinformatics 7, 583-605. [DOI] [PubMed] [Google Scholar]
- 12.Burge, C. & Karlin, S. (1997) J. Mol. Biol. 268, 78-94. [DOI] [PubMed] [Google Scholar]
- 13.Batzoglou, S., Pachter, L., Mesirov, J. P., Berger, B. & Lander, E. S. (2000) Genome Res. 7, 950-958. [DOI] [PMC free article] [PubMed] [Google Scholar]
- 14.Bafna, V. & Huson, D. (2000) in Proceedings of the Eighth International Conference on Intelligent Systems for Molecular Biology, eds. Bourne, P., Gribskov, M., Altman, R., Jensen, N., Hope, D., Lengauer, T., Mitchell, J., Scheeff, E., Smith, C., Strande, S. & Weissig, H. (Am. Assoc. Artificial Intelligence, Menlo Park, CA), pp. 3-12.
- 15.Solovyev, V., Salamov, A. & Lawrence, C. (1995) in Proceedings of the Third International Conference on Intelligent Systems in Molecular Biology, ed. Rawlings, C. (Am. Assoc. Artificial Intelligence, Menlo Park, CA), pp. 367-375.
- 16.Gelfand, M., Mironov, A. & Pevzner, P. (1996) Proc. Natl. Acad. Sci. USA 93, 9061-9066. [DOI] [PMC free article] [PubMed] [Google Scholar]
- 17.Kellis, M., Patterson, N., Birren, B., Berger, B. & Lander, S. (2004) J. Comput. Biol. 11, 315-355. [DOI] [PubMed] [Google Scholar]
- 18.McCutcheon, J. P. & Eddy, S. R. (2003) Nucleic Acids Res. 31, 4119-4128. [DOI] [PMC free article] [PubMed] [Google Scholar]
- 19.di Bernardo, D., Down, T. & Hubbard, T. (2003) Bioinformatics 19, 1606-1611. [DOI] [PubMed] [Google Scholar]
- 20.Hofacker, I., Fekete, M. & Stadler, P. (2002) J. Mol. Biol. 319, 1059-1066. [DOI] [PubMed] [Google Scholar]
- 21.Fariza, T., Manolo, G. & Mireille, R. (2002) Comput. Chem. 26, 521-530.12144180 [Google Scholar]
- 22.Mathews, D. & Turner, D. (2002) J. Mol. Biol. 317, 191-203. [DOI] [PubMed] [Google Scholar]
- 23.Sankhoff, D. (1985) SIAM J. Appl. Math. 45, 810-825. [Google Scholar]
- 24.Fox, G. & Woese, C. (1975) Nature 256, 505-507. [DOI] [PubMed] [Google Scholar]
- 25.James, B., Olsen, G., Liu, J. & Pace, N. (1988) Cell 52, 19-26. [DOI] [PubMed] [Google Scholar]
- 26.Pace, N., Smith, D., Olsen, G. & James, B. (1989) Gene 82, 65-75. [DOI] [PubMed] [Google Scholar]
- 27.Hofacker, I., Fontana, W., Stadler, P., Bonhoeffer, L., Tacker, M. & Schuster, P. (1994) Monatshefte Chem. 125, 167-188. [Google Scholar]
- 28.Gelman, A., Carlin, J., Stern, H. & Rubin, D. (2004) Bayesian Data Analysis (Chapman & Hall, London).
- 29.Bray, N. & Pachter, L. (2003) Nucleic Acids Res. 31, 3525-3526. [DOI] [PMC free article] [PubMed] [Google Scholar]
- 30.Schwartz, S., Elnitski, L., Li, M., Weirauch, M., Riemer, C., Smit, A., Green, E., Hardison, R. & Miller, W. (2003) Nucleic Acids Res. 31, 3518-3524. [DOI] [PMC free article] [PubMed] [Google Scholar]
- 31.Brudno, M., Do, C., Cooper, G., Kim, M., Davydov, E., Green, E., Sidow, A. & Batzoglou, S. (2003) Genome Res. 13, 721-731. [DOI] [PMC free article] [PubMed] [Google Scholar]
- 32.Anson, E. & Myers, E. (1997) Comput. Biol. 4, 369-383. [DOI] [PubMed] [Google Scholar]
- 33.Gorodkin, J., Knudsen, B., Zwieb, C. & Samuelsson, T. (2001) Nucleic Acids Res. 29, 169-170. [DOI] [PMC free article] [PubMed] [Google Scholar]
- 34.Brown, J. (1999) Nucleic Acids Res. 27, 314. [DOI] [PMC free article] [PubMed] [Google Scholar]
- 35.Lee, Y., Sultana, R., Pertea, G., Cho, J., Karamycheva, S., Tsai, J., Parvizi, B., Cheung, F., Antonescu, V., White, J., et al. (2002) Genome Res. 12, 493-502. [DOI] [PMC free article] [PubMed] [Google Scholar]
- 36.Landthaler, M. & Shub, D. (2003) Nucleic Acids Res. 31, 3071-3077. [DOI] [PMC free article] [PubMed] [Google Scholar]
- 37.Bourdeau, V., Ferbeyre, G., Pageau, M., Paquin, B. & Cedergren, R. (2000) Nucleic Acids Res. 27, 4457-4467. [DOI] [PMC free article] [PubMed] [Google Scholar]
- 38.Fraboulet, S., Boudouresque, F., Delfino, C. & Ouafik, L'H. (1998) Endocrinology 139, 894-904. [DOI] [PubMed] [Google Scholar]
- 39.Nocker, A., Hausherr, T., Balsiger, S., Krstulovic, N.-P., Hennecke, H. & Narberhaus, F. (2001) Nucleic Acids Res. 29, 4800-4807. [DOI] [PMC free article] [PubMed] [Google Scholar]
- 40.McCarthy, T., Siegel, E., Mroczkowski, B. & Heywood, S. (1983) Biochemistry 22, 935-941. [DOI] [PubMed] [Google Scholar]
- 41.Guan, K. & Weiner, H. (1989) J. Biol. Chem. 264, 17764-17769. [PubMed] [Google Scholar]
- 42.Pelchat, M. & Lapointe, J. (1999) RNA 5, 281-289. [DOI] [PMC free article] [PubMed] [Google Scholar]
- 43.Yen, T., Machlin, P. & Cleveland, D. (1988) Nature 334, 580-585. [DOI] [PubMed] [Google Scholar]
- 44.Cowan, N., Dobner, P., Fuchs, E. & Cleveland, D. (1983) Mol. Cell Biol. 3, 1738-1745. [DOI] [PMC free article] [PubMed] [Google Scholar]
- 45.de la Cruz, B., Prieto, S. & Scheffler, I. (2002) Yeast 19, 887-902. [DOI] [PubMed] [Google Scholar]
- 46.Kislauskis, E., Zhu, X. & Singer, R. (1994) J. Cell Biol. 127, 441-451. [DOI] [PMC free article] [PubMed] [Google Scholar]
- 47.Reenan, R., Hanrahan, C. & Ganetzky, B. (2000) Neuron 25, 139-149. [DOI] [PubMed] [Google Scholar]
- 48.Altschul, S., Gish, W., Miller, W., Myers, E. & Lipman, D. (1990) J. Mol. Biol. 215, 403-410. [DOI] [PubMed] [Google Scholar]