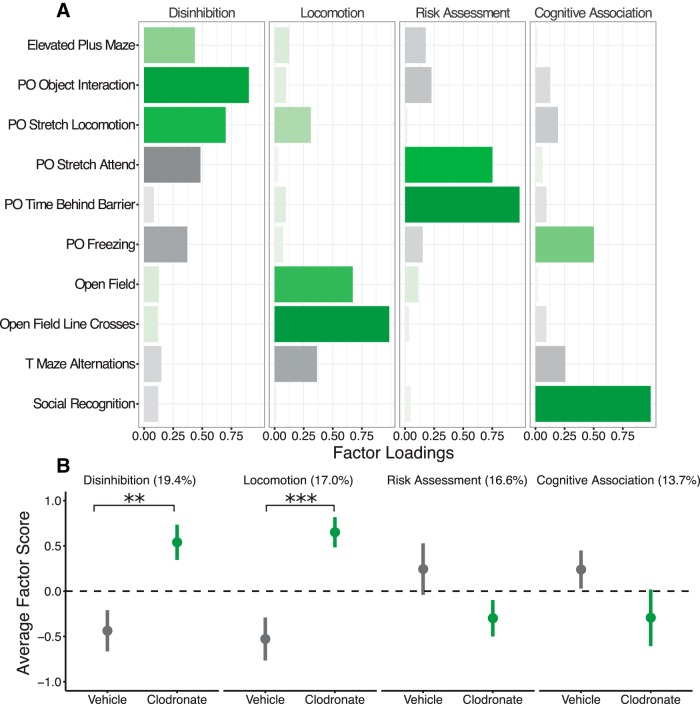
Figure 10.
Factor analysis results. (a) Behavior factor loadings for each named factor. Longer, saturated bars indicate stronger loadings, with green indicating positive loading and black indicating negative loading. (b) Loading scores for VEH and LC rats plotted for each factor. The values in parentheses represent the percentage of total variance accounted for by each factor. Bars indicate group means ± SEM for VEH-treated (black) and LC-treated (green) rats of both sexes. **p < 0.01, ***p < 0.001. n = 13–16 per treatment.

