Abstract
Electronic health records (EHRs) have become a vital source of patient outcome data but the widespread prevalence of missing data presents a major challenge. Different causes of missing data in the EHR data may introduce unintentional bias. Here, we compare the effectiveness of popular multiple imputation strategies with a deeply learned autoencoder using the Pooled Resource Open-Access ALS Clinical Trials Database (PRO-ACT). To evaluate performance, we examined imputation accuracy for known values simulated to be either missing completely at random or missing not at random. We also compared ALS disease progression prediction across different imputation models. Autoencoders showed strong performance for imputation accuracy and contributed to the strongest disease progression predictor. Finally, we show that despite clinical heterogeneity, ALS disease progression appears homogenous with time from onset being the most important predictor.
1. Introduction
1.1. Background
Electronic health records (EHRs) are a core resource in genetic, epidemiological and clinical research providing phenotypic, patient progression and outcome data to researchers. Missing data presents major challenges to research by reducing viable sample size and introducing potential biases through patient selection or imputation1,2.
Missing data is widely prevalent in the EHR for several reasons. EHRs are designed and optimized for clinical and billing purposes meaning data useful to research may not be recorded2. Outside of the design of EHRs, the reality of the clinic results in missing data. For example, clinicians must consider financial burden in ordering lab tests for patients and issue the minimum amount of testing and diagnostics to effectively treat their patients3.
The various reasons data may be missing create different types of missing data: missing completely at random, missing at random and missing not at random1,4,5. This work focuses on data missing completely at random and data missing not at random. Data missing completely at random indicates that there is no systematic determination of whether a value is missing or present. The likelihood of response is independent of the data and any latent factors. Data missing not at random occurs when data is missing due to either observed values in the data or unobserved latent values. An example within the EHR would occur if a lab test is only issued based on a clinicians observation of the patient. Whether or not the test is issued provides insight into the patient’s status.
Non-imputation approaches often exclude data from the analysis to allow for downstream analysis. One approach, complete-case analysis, throws out records with missing data. Within the EHR this would severely limit sample size, in addition if incomplete records have a systematic difference from complete records unintentional bias can be introduced6. As computational resources have increased, computationally complex imputation techniques have become feasible and are growing in popularity1. Computationally intensive techniques such as Singular Value Decomposition (SVD) based methods and weighted K-nearest neighbors (KNN) methods have joined less complex methods like mean and median imputation. Both SVD and KNN-based methods have been shown to perform effectively in microarray imputation7. Popular multiple imputation methods show particular challenges with data that are not missing at random1.
Autoencoders are a variation of artificial neural networks that learn a distributed representation of their input8. They learn parameters to transform the data to a hidden layer and then reconstruct the original input. By using a hidden layer smaller than the number of input features, or “bottleneck” layer the autoencoder is forced to learn the most important patterns in the data9. To prevent overreliance on specific features two techniques are commonly used. In a denoising autoencoder, noise is added to corrupt a portion of the inputs9,10. Alternatively, a technique called dropout in which random units and connections are removed from the network forcing it to learn generalizations11. Autoencoders were shown to generate useful higher representations in both simulated and real EHR data. Because autoencoders learn by reconstructing the original input from a corrupted version, imputation is a natural extension12,13.
1.2. ALS and the Pooled Resource Open-access Clinical Trials
We evaluate each of the imputation methods on the ALS Pooled Resource Open-access Clinical Trials (PRO-ACT). Pooled clinical trial datasets present an ideal option for evaluating EHR imputation strategies because they include patients from differing environments with potential systematic biases. In addition, clinical trials represent the gold standard for data collection making it possible to spike-in missing data while maintaining enough signal to evaluate imputation techniques.
Prize4Life and the Neurological Clinical Research Institute (NCRI) at Massachusetts General Hospital created the Pooled Resource Open-Access ALS Clincial Trials (PRO-ACT) platform with funding from the ALS Therapy Alliance in and in partnership with the Northeast ALS Consortium. The PRO-ACT project was designed to empower translational ALS research and includes data from 23 clinical trials and 10,723 patients. In this work, we use the subset of 1,824 patients included in the Prize4Life challenges14.
ALS is a progressive neurodegenerative disorder affecting both the upper and lower motor neurons causing muscle weakness, paralysis and leading to death14. ALS patients typically survive only 3 to 5 years from disease onset and show large degrees of clinical heterogeneity15–18.
A common measure used to monitor an ALS patient’s condition is the ALS functional rating scale (ALSFRS)19,20. The ALSFRS consists of 10 tests scored from 0–4 assessing patients’ self-sufficiency in categories including: feeding, grooming, ambulation and communication. The change over time, or slope, is commonly used as a statistic to represent ALS progression.
2. Methods
We compare and evaluate a variety of methods to impute missing data in the EHR. We spiked-in missing data to the PRO-ACT dataset, and evaluated each approach’s performance imputing known data. We also evaluated prediction accuracy using each of the imputation methods on the ALSFRS. Each of these is described in detail below and all analysis was run using freely available open source library packages, DAPS12, FancyImpute21, Keras22 and Scikit-learn23.
2.1. Data preparation and standardization
The PRO-ACT dataset includes patient demographic data, family history, concomitant medications, vital sign measurements, laboratory results, and patient history (disease onset etc.). PRO-ACT performed an initial data cleaning and quality assurance process. This process included extracting quantitative variables, merging laboratory tests with different names across trials, removable of indecipherable records and converting units. After processing the PRO-ACT dataset includes only quantitative values (continuous, binary, ordinal and categorical).
Our analysis encoded categorical variables using Sci-kit learn’s OneHotEncoder23. Temporal or repeated measurements were encoded as the mean, minimum, maximum, count, standard deviation and slope across all measurements, creating 572 features for each samples. Additional measurements were standardized across scales (i.e. inches to cm). Non-numeric values in numeric measurements were coerced to numeric values. Where coercion failed they were replaced by NaN. Input features were normalized and scaled to be between 0 and 1, with missing features remaining as NaN.
2.2. Imputation Strategies
2.2.1. Imputing missing data with Autoencoders
We constructed an autoencoder with a modified binary cross entropy cost between the reconstructed layer z and the input data x to better handle missing data as in Beaulieu-Jones and Greene (2016) (Formula 1)12. The modified function takes into account missing data, with m representing a “missingness” vector; m has a value of 1 where the data is present and 0 when the data is missing. By multiplying by m and dividing by the count of present features (sum of m) the result represents the average cost per present feature. The weights and biases of the autoencoder are trained only on present features and imputation does not need to be performed prior to training the autoencoder.
| (Formula 1) |
With the exception of the modified cost function autoencoders were trained as described by Vincent et al. with a 100 training epoch patience10. If a new minimum cost was not reached in 100 epochs, training was stopped. The autoencoder with dropout was implemented using the FancyImpute21 and Keras22 libraries with a Theano24,25 backend.
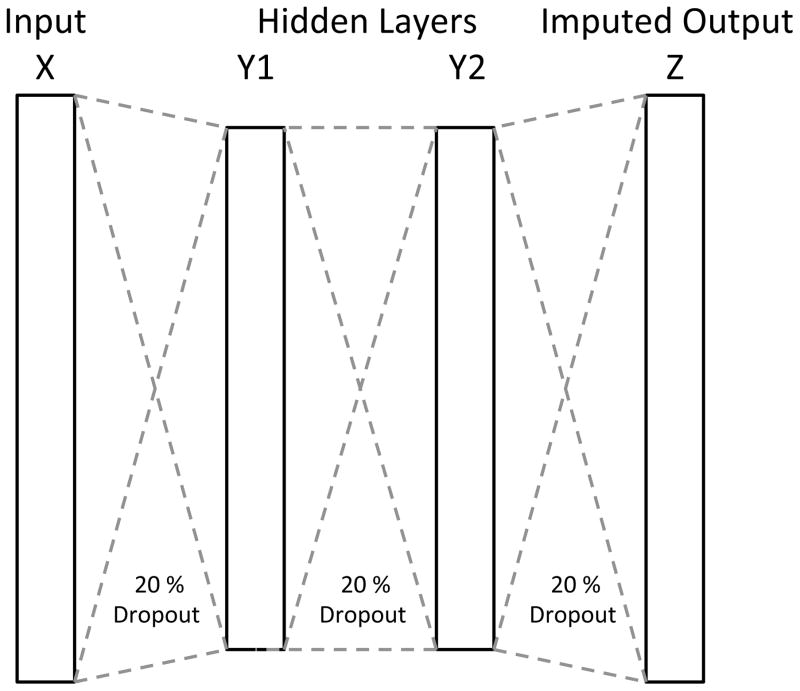
We performed a parameter sweep to determine the hyperparameters for the autoencoder. In the sweep we included autoencoders of one to three hidden layers and each combination of 2, 4, 10, 100, 200, 500 and 1000 (over-complete representation) hidden nodes per layer. Autoencoders with two hidden layers made up of 500 nodes each are shown for all comparisons (Figure 1). Dropout levels of 5, 10, 20, 30, 40 and 50% were evaluated with 20% being shown for all comparisons.
Figure 1.
Schematic structure of the autoencoder used for evaluations, with two hidden layers and 20% dropout between each layer.
Binary cross entropy was used for training because it tends to be a better evaluator of quality when training neural networks9,10,26,27. We use a root mean squared error for comparison to other methods to prevent a bias in favor of autoencoders, as most other methods are not trained with cross entropy.
2.2.2. Comparative imputation strategies
We used the FancyImpute21 libraries implementations for each of the other imputation strategies: 1) IterativeSVD, matrix completion by low rank singular value decomposition based on SVDImpute7, 2) K-nearest neighbors imputation (KNNimpute), matrix completion by choosing the mean values of the K closest samples for features where both samples are present 3) SoftImpute28, matrix completion by iterative replacement of missing values with values from a soft-thresholded singular value decomposition, 4) column mean filling and 5) column median filling. The standard implementations of the remaining algorithms in the FancyImpute library, MICE, Matrix Factorization and Nuclear Norm Minimization are known to be slow on large matrices and were impractically slow on this dataset29–33.
We performed a parameter sweep for SVDimpute analyzing ranks of 5, 10, 20, 40 and 80. Ranks of 40 showed the strongest performance with this dataset and are shown for all comparisons. The parameter sweep for KNNimpute included 1, 3, 5, 7, 15 and 30 neighbors, k of 7 showed the strongest performance of the parameter sweep and is used for all comparisons.
2.3. Missing Completely at Random Imputation Evaluation
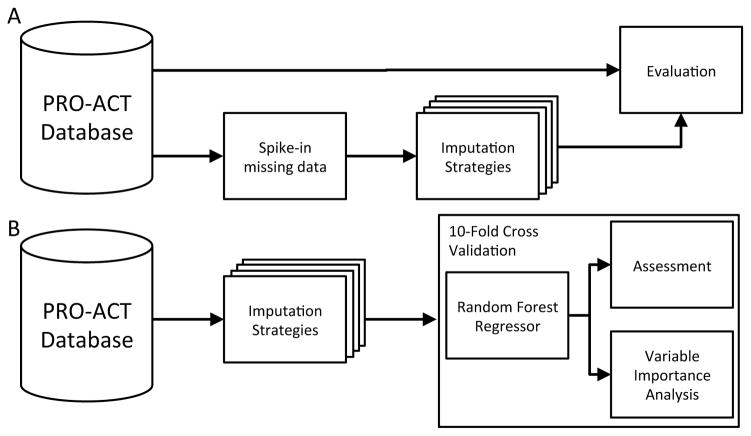
To evaluate imputation accuracy in a missing completely at random environment we performed trials replacing 10, 20, 30, 40 and 50% of known features at random with NaN. We performed each imputation strategy on the data with spiked-in missingness and evaluated the root mean squared error between the imputed estimates and the original data. We performed five trials for each amount of spiked-in data (Figure 2A). Performance was evaluated using the root mean squared error between the known value before spiking in missingness and the imputed value.
Figure 2.
Evaluation outline (a) Imputation Evaluation. PRO-ACT patient data of 10,723 subjects has known data masked with spiked in missing data. Imputation strategies are performed in parallel and the RMSE is calculated between the masked input data and each strategies imputations. (b) Progression Prediction. PRO-ACT patients are imputed using each strategy. Ten-fold cross validation of a random forest regressor is performed on imputed patients.
2.4. Missing Not at Random Imputation Evaluation
To perform a basic imputation simulation where data was missing not at random, varying percentages (10, 20, 30, 40, and 50%) of features were chosen at random. Half of the highest or lowest (randomly selected) quartile of values was replaced by NaN at random. Each imputation strategy was evaluated on five independent spike-in trails. Performance was evaluated using the root mean squared error between the imputed values and original values. This type of imputation could occur when the highest or lowest values represent the normal range and the clinician is able to determine a patient is normal through other factors. Alternatively the extreme values could represent a clear result where an additional is not needed to determine the result. Performance was evaluated using the root mean squared error between the known value before spiking in missingness and the predicted value.
2.5. Progression Prediction Evaluation
To predict disease progression as represented by the ALSFRS score slope, we first imputed the missing data using column mean averaging, column median averaging, SVDImpute, SoftImpute, KNNimpute, and an autoencoder with dropout. For prediction purposes we excluded all ALSFRS score and Forced Vital Capacity-related features.
We then used the scikit-learn implementation of a random forest regressor23 to predict the ALSFRS score slope. The random forest regressor was chosen because four of the top six teams in the DREAM-Phil Bowen ALS Prediction Prize4Life challenge used variants of random forest regressors14. We also compare a random forest regressor modified to predict progression from the raw data without imputation34. Ten-fold cross validation was performed and the root mean squared error between the predicted slope and actual slope was calculated. We then extracted the top 10 most important features used in the trained model for analysis (Figure 2B).
3. Results
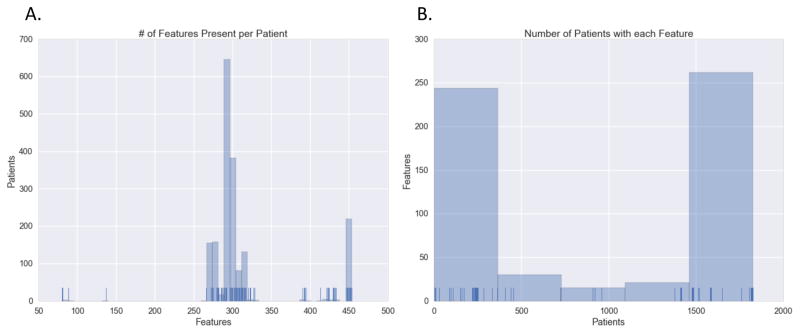
Most patients were missing approximately half of the features we extracted from the EHR (3A). The pooled aspect of the PRO-ACT data is particularly evident in the distribution of missing features as different clinical trials collected different amounts of data. Features tended to be observed in either less than 25% or in greater than 75% of patients (Figure 3B). Lab tests in particular demonstrated high variability of missingness among patients, with many present in small numbers of patients. It is impossible to determine the level of each type of missing data that exists, but it is clear that at least some of data missing is due to clinical factors (trial group etc.). The most complete features are demographics and family history information, information likely collected before entry into any of the clinical trials.
Figure 3.
Histogram distribution and rug plot showing the number of patients each feature is present in. (a) The number of features each patient has. Ticks at the bottom indicate one patient with the count of features, bins indicate the number of patients in a range. (b) The number of patients having a recorded value for each feature. Ticks at the bottom indicate the number of patients a feature is present in, bins indicate the number of features in a range.
3.1. Missing completely at random spike-in results
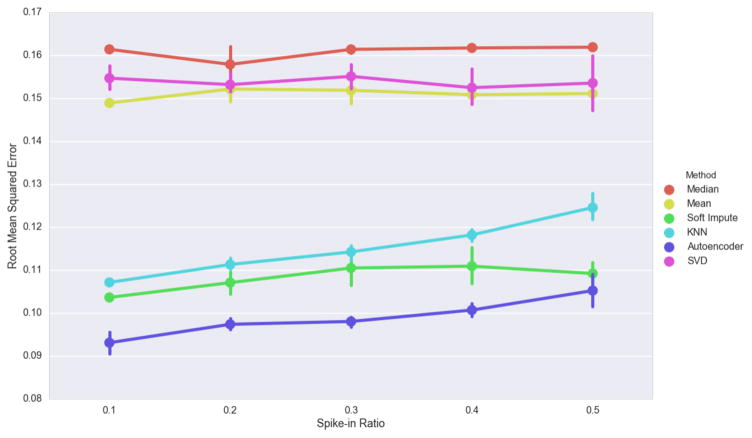
Mean, Median and Singular Value Decomposition imputation perform poorly when data is missing completely at random. However, they do not appear to degrade as the spike-in ratio increase (Figure 4). This is not surprising for mean and median imputation because missing data is chosen completely at random and is unlikely to have a large effect on statistical averages. The autoencoder had the highest imputation performance despite increasing as the spike-in ratio increased.
Figure 4.
Effect of the amount of spiked-in missing data on imputation. Error bars indicate 5-fold cross validation score ranges.
3.2. Not missing at random spike-in results
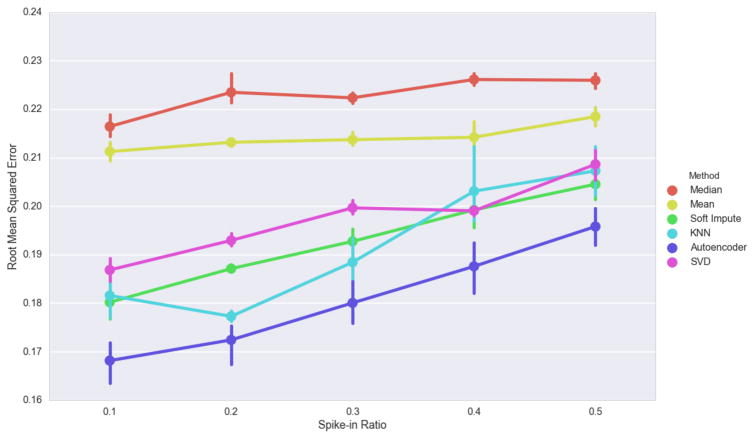
The trends seen in the missing completely at random experiment largely repeat when the data is missing not at random. The autoencoder approach shows strong performance but is closely followed by the KNN, Softimpute and SVD approaches (Figure 5). KNN works by finding the k-nearest neighbors for shared values and taking the mean for the missing feature. Autoencoders work by learning the optimal network for reconstruction. Similar input values will have similar hidden node values. This similarity could explain the relatively even performance between the two methods. In addition to recognizing similar samples, autoencoders have been shown to perform well when there is dependency or correlation between variables35; this is the scenario when data is missing not at random. When spike-in ratios increase to high levels the methods begin to converge to the performance of mean and median imputation. This is likely because too much of the signal is lost as missing data to learn the correlation structure.
Figure 5.
Effect of non-random spiked-in missing data on imputation (measured in root mean squared error). Autoencoder w/Dropout (2 layer 500 nodes each), SVD – SVDImpute with rank of 40, KNN - KNNimpute with 7 neighbors, Mean – Column Mean Averaging, Median – column median averaging, SI – SoftImpute.
3.3. ALS disease progression
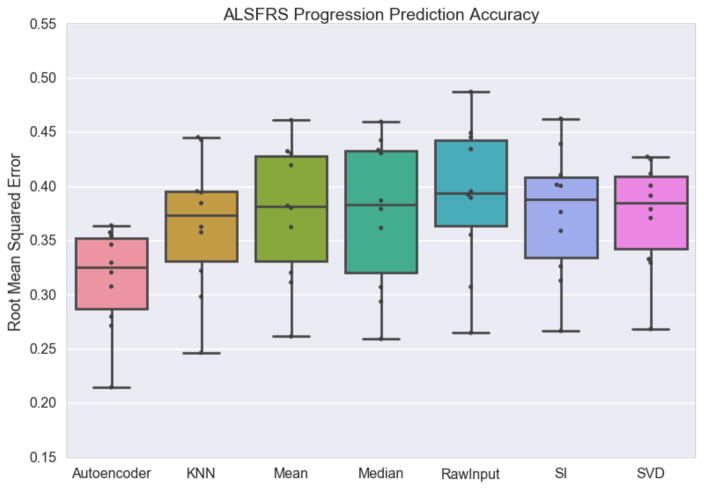
Imputation strategy has a modest but statistically significant impact on the root mean squared error of ALS disease progression prediction, but the autoencoder approach is the strongest performing (Figure 6). Despite showing poor performance in the imputation accuracy exercises Singular Value Decomposition does approximately as well as k-nearest neighbors and SoftImpute in this experiment. A random forest regressor applied to the raw data is the worst performing, but is not significantly worse than any of the methods other than the Autoencoder. In terms of ALS disease progression, imputation does not appear to have a large effect on prediction, but can be vital to allow the use of other algorithms (prediction, clustering etc.) without modification.
Figure 6.
ALS Functional Rating Scale prediction accuracy shown for an autoencoder, k-nearest neighbors, mean averaging, median averaging, the raw input including missing values, soft impute and singular value decomposition. The box indicates inner quartiles with the line representing the median; the whiskers indicate outer quartiles excluding outliers.
3.4. ALS progression predictive indicat
Nine out of the top ten most important features in the autoencoder-imputed random forest regressor were among the top fifteen identified in the DREAM Prediction challenge (Figure 7A). The amount of time using Riluzole was not among the top fifteen previously identified. Riluzole is the only FDA approved medication for ALS treatment but it is believed to have a limited effect on survival36–38. The finding that Riluzole is protective of ALS slope indicates some level of efficacy.
Figure 7.
Prediction feature importance. (a) Importance levels of the top 10 features to the random forest regressor with autoencoder imputed data. (b) Histogram distribution of patient ALSFRS slope levels.
Of the top ten most important features, five are missing in more than 50% of patients in the data set. This is a possible explanation for the improvement shown by Autoencoders, SVDimpute and KNNimpute over mean imputation.
By far the most important feature for prediction is the time from onset and several of the most important features are highly correlated with time from onset. ALSFRS slopes resemble a normal distribution (Figure 7B). When including the entire PRO-ACT dataset, the Kolmogorov-Smirnov test score is 0.05 for patients with negative slopes. This indicates the progression of the disease is similar to a truncated normal distribution. We exclude positive slopes because ALS patients do not typically get better, and signs of doing so are likely the result of measurement error. Despite presenting in clinically heterogeneous manners, ALS progression as defined by the ALSFRS appears to be largely homogenous. Patients fall within a relatively normal distribution and have increasingly negative slopes the longer they ALS.
4. Discussion and Conclusions
In this study, we compared the performance of an autoencoder approach with popular imputation techniques in ALS EHR data. A multi-layer autoencoder with dropout showed robust imputation performance across a variety of spiked-in missing data experiments designed to be both completely at random and not at random. Furthermore, we found that imputation accuracy may not strictly correlate with predictive performance but the most accurate imputer provided the most accurate predictor. The importance of imputation is demonstrated by five of the top ten most important features for prediction being missing in more than 50% of patients.
Increased deterioration of imputation performance for KNNimpute and SVDimpute with increased missing data is at odds with previous research of imputation in microarrays7. Possible explanations include either reaching a threshold of missing data where the burden is too high for these methods to accurately impute or that a confounding systematic bias is introduced from the different clinical trials.
This work is a promising first step in utilizing deep learning techniques for missing data imputation in the EHR but challenges remain. Autoencoders are computationally intensive, but less so than imputation techniques like MICE, Matrix Factorization and Nuclear Norm Minimization. With GPU resources, autoencoders train in similar amounts of time to both KNN and SVD methods for these clinical trials. As data increases, autoencoder training time increases linearly in line with the number of samples. Methods like KNN require computing a distance matrix, which increases in exponential time. In addition, further examination is necessary to determine whether the strong performance shown by autoencoders is a result of the structure of this pooled clinical trial dataset. The subset of 1,800 patients is relatively small and methods may differ in performance increases with more patients.
This work offers promising results but has several limitations especially because it specifically analyzes pre-processed pooled clinical trial data. Clinical trials have more complete and cleaner data than raw EHR. Follow up work should be performed with other diseases and in the general patient population. These methods have also only been evaluated for quantitative values; in raw EHR data there will be an additional extraction step for raw text and qualitative observations that was not necessary due to PRO-ACT’s preprocessing.
Additional future work will be concentrated on developing tools to better understand and interpret the structure of the trained autoencoder networks. We anticipate being able to recognize patterns in the trained weights to see correlation between input features. Understanding correlation will empower new clustering and visualization opportunities. Spike-in evaluations can provide a supervised context to otherwise unsupervised learning problems; further analysis should be performed on the higher-level learned features in the hidden layers of the autoencoders. We suspect these features may be useful in patient outcome classification and regression problems.
Acknowledgments
This work is supported by the Commonwealth Universal Research Enhancement (CURE) Program grant from the Pennsylvania Department of Health to JHM. The authors would like to thank Dr. Casey S Greene for helpful discussions. The authors acknowledge the support of the NVIDIA Corporation for the donation of a TitanX GPU used for this research.
Footnotes
This work is supported by a Commonwealth Universal Research Enhancement (CURE) Program grant from the Pennsylvania Department of Health.
Contributor Information
BRETT K. BEAULIEU-JONES, Email: brettbe@med.upenn.edu, Genomics and Computational Biology Graduate Group, Computational Genetics Lab, Institute for Biomedical Informatics, Perelman School of Medicine, University of Pennsylvania, 3700 Hamilton Walk, Philadelphia PA, 19104
JASON H. MOORE, Email: jhmoore@exchange.upenn.edu, Computational Genetics Lab, Institute for Biomedical Informatics, University of Pennsylvania, 3700 Hamilton Walk, Philadelphia PA, 19104
References
- 1.Sterne JJaC, White IRI, Carlin JJB, et al. Multiple imputation for missing data in epidemiological and clinical research: potential and pitfalls. BMJ. 2009;338(July):b2393. doi: 10.1136/bmj.b2393. [DOI] [PMC free article] [PubMed] [Google Scholar]
- 2.Wells BJ, Chagin KM, Nowacki AS, Kattan MW. Strategies for handling missing data in electronic health record derived data. EGEMS (Washington, DC) 2013;1(3):1035. doi: 10.13063/2327-9214.1035. [DOI] [PMC free article] [PubMed] [Google Scholar]
- 3.McClatchey KD. Clinical Laboratory Medicine. Lippincott Williams & Wilkins; 2002. [Google Scholar]
- 4.Little R, Rubin D. Statistical Analysis with Missing Data. John Wiley & Sons; 2014. [Google Scholar]
- 5.Marlin B. [Accessed August 7, 2016];Missing data problems in machine learning. 2008 http://www-devel.cs.ubc.ca/~bmarlin/research/phd_thesis/marlin-phd-thesis.pdf.
- 6.Gelman A, Hill J. [Accessed August 10, 2016];Data Analysis Using Regression and Multilevel/hierarchical Models. 2006 https://books.google.com/books?hl=en&lr=&id=c9xLKzZWoZ4C&oi=fnd&pg=PR17&dq=data+analysis+using+regression+and+multilevel/hierarchical+models&ots=baT3R3Mnng&sig=KpLzVOFtUseaK8_IhUfPLM2Y7fU.
- 7.Troyanskaya O, Cantor M, Sherlock G, et al. Missing value estimation methods for DNA microarrays. Bioinformatics. 2001;17(6):520–525. doi: 10.1093/bioinformatics/17.6.520. [DOI] [PubMed] [Google Scholar]
- 8.Bengio Y. Learning Deep Architectures for AI. Found Trends® Mach Learn. 2009;2(1):1–127. doi: 10.1561/2200000006. [DOI] [Google Scholar]
- 9.Vincent P, Larochelle H, Lajoie I, Bengio Y, Manzagol P-A. Stacked Denoising Autoencoders: Learning Useful Representations in a Deep Network with a Local Denoising Criterion. J Mach Learn Res. 2010;11(3):3371–3408. doi: 10.1111/1467-8535.00290. [DOI] [Google Scholar]
- 10.Vincent P, Larochelle H, Bengio Y, Manzagol P-A. Extracting and composing robust features with denoising autoencoders. Proc 25th Int Conf Mach Learn - ICML ‘08; 2008; pp. 1096–1103. [DOI] [Google Scholar]
- 11.Srivastava N, Hinton GE, Krizhevsky A, Sutskever I, Salakhutdinov R. Dropout3: A Simple Way to Prevent Neural Networks from Overfitting. J Mach Learn Res. 2014;15:1929–1958. doi: 10.1214/12-AOS1000. [DOI] [Google Scholar]
- 12.Beaulieu-Jones BK, Greene CS. Semi-Supervised Learning of the Electronic Health Record with Denoising Autoencoders for Phenotype Stratification. bioRxiv. 2016 Feb;:39800. doi: 10.1101/039800. [DOI] [PubMed] [Google Scholar]
- 13.Miotto R, Li L, Kidd BA, et al. Deep Patient: An Unsupervised Representation to Predict the Future of Patients from the Electronic Health Records. Sci Rep. 2016;6:26094. doi: 10.1038/srep26094. [DOI] [PMC free article] [PubMed] [Google Scholar]
- 14.Küffner R, Zach N, Norel R, et al. Crowdsourced analysis of clinical trial data to predict amyotrophic lateral sclerosis progression. Nat Biotechnol. 2015;33(1):51–57. doi: 10.1038/nbt.3051. [DOI] [PubMed] [Google Scholar]
- 15.Kollewe K, Mauss U, Krampfl K, Petri S, Dengler R, Mohammadi B. ALSFRS-R score and its ratio: A useful predictor for ALS-progression. J Neurol Sci. 2008;275(1–2):69–73. doi: 10.1016/j.jns.2008.07.016. [DOI] [PubMed] [Google Scholar]
- 16.Beghi E, Mennini T, Bendotti C, et al. The heterogeneity of amyotrophic lateral sclerosis: a possible explanation of treatment failure. [Accessed August 7, 2016];Curr Med Chem. 2007 14(30):3185–3200. doi: 10.2174/092986707782793862. http://www.ncbi.nlm.nih.gov/pubmed/18220753. [DOI] [PubMed] [Google Scholar]
- 17.Sabatelli M, Conte A, Zollino M. Clinical and genetic heterogeneity of amyotrophic lateral sclerosis. Clin Genet. 2013;83(5):408–416. doi: 10.1111/cge.12117. [DOI] [PubMed] [Google Scholar]
- 18.Ravits JM, La Spada AR. ALS motor phenotype heterogeneity, focality, and spread: deconstructing motor neuron degeneration. Neurology. 2009;73(10):805–811. doi: 10.1212/WNL.0b013e3181b6bbbd. [DOI] [PMC free article] [PubMed] [Google Scholar]
- 19.Cedarbaum JM, Stambler N. Performance of the amyotrophic lateral sclerosis functional rating scale (ALSFRS) in multicenter clinical trials. Journal of the Neurological Sciences. 1997;152 doi: 10.1016/S0022-510X(97)00237-2. [DOI] [PubMed] [Google Scholar]
- 20.Cedarbaum JM, Stambler N, Malta E, et al. The ALSFRS-R: A revised ALS functional rating scale that incorporates assessments of respiratory function. J Neurol Sci. 1999;169(1–2):13–21. doi: 10.1016/S0022-510X(99)00210-5. [DOI] [PubMed] [Google Scholar]
- 21.Rubinsteyn A, Feldman S. fancyimpute: Version 0.0.9. 2016 Mar; doi: 10.5281/zenodo.47151. [DOI] [Google Scholar]
- 22.Chollet F. GitHub Repos. 2015. Keras. [Google Scholar]
- 23.Pedregosa F, Varoquaux G, Gramfort A, et al. Scikit-learn: Machine Learning in Python. … Mach Learn …. 2012;12:2825–2830. http://dl.acm.org/citation.cfm?id=2078195\nhttp://arxiv.org/abs/1201.0490. [Google Scholar]
- 24.Bastien F, Lamblin P, Pascanu R, et al. Theano: new features and speed improvements. arXiv Prepr arXiv …. 2012:1–10. http://arxiv.org/abs/1211.5590.
- 25.Bergstra J, Breuleux O, Bastien F, et al. Theano: a CPU and GPU math compiler in Python. 9th Python in Science Conference; 2010; pp. 1–7. http://www-etud.iro.umontreal.ca/~wardefar/publications/theano_scipy2010.pdf. [Google Scholar]
- 26.Socher R, Pennington J, Huang E, Ng A. Semi-supervised recursive autoencoders for predicting sentiment distributions. [Accessed August 8, 2016];Proc. 2011 http://dl.acm.org/citation.cfm?id=2145450.
- 27.Hinton G, Salakhutdinov R. Reducing the dimensionality of data with neural networks. [Accessed August 8, 2016];Science (80-) 2006 doi: 10.1126/science.1127647. http://science.sciencemag.org/content/313/5786/504.short. [DOI] [PubMed]
- 28.Mazumder R, Hastie T, Edu H, Tibshirani R, Edu T. Spectral Regularization Algorithms for Learning Large Incomplete Matrices. J Mach Learn Res. 2010;11:2287–2322. [PMC free article] [PubMed] [Google Scholar]
- 29.van Buuren S. Flexible Imputation of Missing Data. 2012 doi: 10.1201/b11826. [DOI] [Google Scholar]
- 30.Royston P. Multiple imputation of missing values: update of ice. [Accessed August 10, 2016];Stata J. 2005 https://www.researchgate.net/profile/James_Cui2/publication/23780230_Buckley-James_method_for_analyzing_censored_data_with_an_application_to_a_cardiovascular_disease_and_an_HIVAIDS_study/links/53d5866d0cf228d363ea0b7a.pdf#page=59.
- 31.Kim J, Park H. Toward Faster Nonnegative Matrix Factorization: A New Algorithm and Comparisons
- 32.Lin C-J. Projected Gradient Methods for Non-negative Matrix Factorization. [DOI] [PubMed] [Google Scholar]
- 33.Hsieh C-J, Olsen PA. Nuclear Norm Minimization via Active Subspace Selection. [Google Scholar]
- 34.Breiman L, Cutler A. Random Forests. 2014 http//stat-www berkeley edu/users/breiman/RandomForests/cc home htm.
- 35.Nelwamondo FV, Mohamed S, Marwala T. [Accessed September 30, 2016];Missing Data: A Comparison of Neural Network and Expectation Maximisation Techniques. 2007 Apr; http://arxiv.org/abs/0704.3474.
- 36.Zoccolella S, Beghi E, Palagano G, et al. Riluzole and amyotrophic lateral sclerosis survival: a population-based study in southern Italy. Eur J Neurol. 2007;14(3):262–268. doi: 10.1111/j.1468-1331.2006.01575.x. [DOI] [PubMed] [Google Scholar]
- 37.Traynor BJ, Alexander M, Corr B, Frost E, Hardiman O. An outcome study of riluzole in amyotrophic lateral sclerosis. J Neurol. 2003;250(4):473–479. doi: 10.1007/s00415-003-1026-z. [DOI] [PubMed] [Google Scholar]
- 38.Czaplinski A, Yen AA, Appel SH. Forced vital capacity (FVC) as an indicator of survival and disease progression in an ALS clinic population. J Neurol Neurosurg Psychiatry. 2006;77(3):390–392. doi: 10.1136/jnnp.2005.072660. [DOI] [PMC free article] [PubMed] [Google Scholar]


