

Neuroprosthetic implants represent an approved treatment for retinitis pigmentosa, an eye disease that leads to blindness through photoreceptor degeneration. Here, we show, using an implantable subretinal microchip, that the surviving retinal circuitry in photoreceptor-degenerated mouse retinas is preserved in a way, allowing for the stimulation of a temporally diverse and spatially confined retinal output. This knowledge about functional integrity of photoreceptor-degenerated retinas is crucial for the success of any vision-restoration approach.
Keywords: photoreceptor degeneration, retinal network, neuroprosthetic stimulation
Abstract
Retinal degeneration (rd) leads to progressive photoreceptor cell death, resulting in vision loss. Stimulation of the inner-retinal neurons by neuroprosthetic implants is one of the clinically approved vision-restoration strategies, providing basic visual percepts to blind patients. However, little is understood as to what degree the degenerating retinal circuitry and the resulting aberrant hyperactivity may prevent the stimulation of physiological electrical activity. Therefore, we electrically stimulated ex vivo retinas from wild-type (wt; C57BL/6J) and blind (rd10 and rd1) mice using an implantable subretinal microchip and simultaneously recorded and analyzed the retinal ganglion cell (RGC) output with a flexible microelectrode array. We found that subretinal anodal stimulation of the rd10 retina and wt retina evoked similar spatiotemporal RGC-spiking patterns. In both retinas, electrically stimulated ON and a small percentage of OFF RGC responses were detected. The spatial selectivity of the retinal network to electrical stimuli reveals an intact underlying network with a median receptive-field center of 350 μm in both retinas. An antagonistic surround is activated by stimulation with large electrode fields. However, in rd10 and to a higher percentage, in rd1 retinas, rhythmic and spatially unconfined RGC patterns were evoked by anodal or by cathodal electrical stimuli. Our findings demonstrate that the surviving retinal circuitry in photoreceptor-degenerated retinas is preserved in a way allowing for the stimulation of temporally diverse and spatially confined RGC activity. Future vision restoration strategies can build on these results but need to avoid evoking the easily inducible rhythmic activity in some retinal circuits.
NEW & NOTEWORTHY
Neuroprosthetic implants represent an approved treatment for retinitis pigmentosa, an eye disease that leads to blindness through photoreceptor degeneration. Here, we show, using an implantable subretinal microchip, that the surviving retinal circuitry in photoreceptor-degenerated mouse retinas is preserved in a way, allowing for the stimulation of a temporally diverse and spatially confined retinal output. This knowledge about functional integrity of photoreceptor-degenerated retinas is crucial for the success of any vision-restoration approach.
the blindness-causing disease retinitis pigmentosa is hallmarked by a progressive loss of photoreceptors in the outer nuclear layer of the retina. Despite the massive degeneration of the outer retina, the inner retina appears intact, to a large degree (Mazzoni et al. 2008; Santos et al. 1997), and is therefore amenable to basic visual restoration. This assumption encouraged attempts to restore basic visual function using electrical stimulation of the remaining retinal neurons in clinical trials (Ayton et al. 2014; da Cruz et al. 2013; Fujikado et al. 2011; Zrenner et al. 2011). On the other hand, recent results from rodent models of retinitis pigmentosa indicate pathophysiological alterations leading to oscillatory activity in bipolar, amacrine, and ganglion cells, which could exacerbate visual impairment (Trenholm and Awatramani 2015). The clinical results from blind patients using a retinal implant indicated that electrical stimulation of the remaining circuitry evokes visual percepts, however, with a quite variable success rate (Luo and da Cruz 2016; Stingl et al. 2015). These variable results question to what degree the assumption of preserved retinal circuitry holds true (Jones and Marc 2005) and to what degree temporally diverse and spatially confined response patterns can be evoked in blind retinas.
The response pattern of a retinal ganglion cell (RGC) in healthy retinas to light stimulation within a spatially confined visual field and with a cell type-specific temporal dynamic is characterized by the receptive-field concept (Rodieck 1998). The receptive field marks the area over which a RGC integrates the light-mediated photoreceptor input. From a functional perspective, RGC receptive fields have been mapped with different light stimuli, including small spots (Levick 1967), bar-like stimuli (Roska and Werblin 2001), or spatiotemporal white noise (Meister et al. 1994). In blind retinas, where the physiological photoreceptor input disappears by the time of clinical intervention, the electrical receptive field (eRF) of an RGC, evoked by a retinal implant, defines those electrode positions that excite or inhibit the spiking of the cell. As shown recently, the eRF in healthy retinas can be mapped with bar-like electrical stimuli presented consecutively at equidistant positions across the retina (Eickenscheidt et al. 2012) or by electrical white-noise stimuli (Maturana et al. 2016). Electrical white-noise stimuli also revealed the size of eRFs in rod-degenerated rat retinas (Lorach et al. 2015). However, it remained unclear to what degree ON and OFF response patterns can be evoked and how these patterns vary with respect to stimulus size and stimulus polarity.
With the use of an implantable microchip (Stingl et al. 2015), we investigated electrically stimulated RGC response patterns in different rod-degenerated [retinal degeneration (rd)] mouse models with respect to spatial selectivity and temporal dynamics. The knowledge about functional integrity of photoreceptor-degenerated retinas is crucial for the success of any vision-restoration approach, including gene therapy and optogenetics (Sahel and Roska 2013), cell transplantation (Jayakody et al. 2015), and electrical stimulation (Chuang et al. 2014).
Here, by recording from multiple nearby cells using a flexible microelectrode array (flex MEA), we found that the majority of RGCs in blind rd10 mouse retinas and a substantial part of RGCs in rd1 retinas (Chang et al. 2002) display a temporally diverse and spatially confined response to electrical stimulation. However, within the same retina, oscillatory and spatially unconfined activity is induced by the same electrical stimulus in some rd RGCs but never in wild-type (wt) RGCs.
METHODS
All experimental procedures were carried out in compliance with the institutional guidelines. Housing and euthanasia of animals were compliant with applicable German and European law for the protection of animals used for scientific purposes and were approved by the Regierungspräsidium Tübingen.
Retina preparation and recording setup.
Ex vivo retinas from adult male C57BL/6J mice (wt), B6.CXB1-Pde6brd10/J mice (rd10; postnatal day >180), and C3H/HeOuJ mice (rd1; postnatal day >56) were used. For rd10 and rd1 mice, all photoreceptor outer segments are degenerated at the respective age, and no light responses are detected (Stasheff 2008; Stasheff et al. 2011). The retina preparation followed a previous report (Stutzki et al. 2014). Briefly, eyes were enucleated, and retinas were isolated and dissected in Ames' buffer under dim red-light conditions. A retinal portion was flat mounted in a subretinal configuration to the stimulation microchip (Rothermel et al. 2009). The microchip was first cleaned with Terg-A-Zyme (Z273287; Sigma-Aldrich, St. Louis, MO), dissolved in bi-distilled water, and subsequently coated with poly-l-lysine (P2636; 1 mg/ml dissolved in bi-distilled water; Sigma-Aldrich). The microchip is mounted on a printed circuit board, which provides the required voltage supply. A flex, transparent, and perforated MEA was lowered onto the ganglion cell layer using a micromanipulator (MPC-200/ROE-200; Sutter Instrument, Novato, CA) under optical control through a microscope (Olympus BX51WI). The recording chamber (2 ml), mounted on the printed circuit board comprising the microchip was constantly perfused with warm, carbonated Ames' buffer (A1420; 35°C, pH 7.4; Sigma-Aldrich) at a flow rate of 2 ml/min. A schematic drawing of the experimental setup is shown in Fig. 1A, whereas individual components are shown in Fig. 2.
Fig. 1.

Characterization of evoked RGC patterns and of electrical receptive fields (eRFs). A: experimental setup, where a subretinal microchip electrically stimulates ex vivo retina, and a transparent and flexible microelectrode array (flex MEA) records the ganglion cell activity. The stimulating electrodes of the microchip are activated by an OLED monitor, which illuminates a photodiode array with each photodiode connected to a stimulation electrode. Bar-like light stimuli are presented at 37 equidistant positions (separation 70 μm). The simplified retinal cross-section shows the 3 major cell layers (ganglion cells and inner and outer nuclear layers). B: extracellular signals recorded from 1 RGC of wt retina following stimulation by a rectangular electrode configuration at equidistant positions (separation 70 μm). Here, for each stimulus position, 1 out of 6 repetitions is shown. The white bar at time 0 marks the stimulus onset and a 3-ms time window without evaluated spikes. Inset: zoomed view of the recording of 4 individual voltage traces. C: color-coded average spike rate calculated from all stimulus repetitions at each position. The white star marks the position of the recording electrode relative to the stimulus position. Original vertical scale bar, 350 μm. The size of the entire stimulation array is 2.8 × 2.8 mm2. D: spatially resolved poststimulus time histogram of the stimulated spikes calculated in the time window of 3–500 ms after stimulus onset for 6 repetitions at each stimulus position.
Fig. 2.

Micrographs of the recording and stimulation devices used here. A: a flexible microelectrode array (flex MEA) attached to a rigid Kapton foil is lowered onto the retinal ganglion cell layer (compare with Fig. 1A). Light is projected from an OLED monitor through the MEA onto the stimulation chip shown in C. B: zoom on the central part of the flex MEA and perforated MEA comprising 16 electrodes separated by 60 μm. The electrodes (10 μm diameter) are visible as black dots in the center. C: subretinal stimulation chip Alpha AMS (position marked with a white square) on a planar printed circuit board. The insulated power contacts appear as bright circles on the left side of the stimulation chip. D: zoom on the subretinal chip Alpha AMS (Retina Implant AG) comprising 40 × 40 stimulation sites. A light stimulation bar used in this study is flashed onto the chip. Inset: part of the stimulus chip (5 × 5 stimulation sites) at higher magnification. Distance between stimulation sites: 70 μm.
Electrical stimulation using an implantable microchip.
The electronic functionality of the Conformité Européenne-approved, implantable subretinal microchip Alpha AMS (Retina Implant AG, Reutlingen, Germany) has been described previously (Rothermel et al. 2009). Briefly, the microchip consists of 1,600 pixels arranged in 40 rows and 40 columns at equidistant positions (spacing 70 μm), covering a total area of 2.8 × 2.8 mm2. Each pixel is composed of a microphotodiode, amplification electronics, and a stimulation electrode. Here, the electrode top material is iridium oxide, in contrast to a previous version using TiN (Zrenner et al. 2011). Individual photodiodes were illuminated using an OLED monitor (eMagin, Bellevue, WA), illuminating the back focal plane of a 4× microscope objective (Plan C 4×/0.10). Here, the visible spectrum of an OLED monitor was used to illuminate the implant's photodiodes, thus mimicking its use in everyday light conditions. The light intensity (65 mW/m2) and the illuminance (25 lux, background <1 lux) at the retinal surface were measured using a photometer (P-2000; Gigahertz-Optik GmbH, Türkenfeld, Germany). The sensitivity of the microchip's photodiodes was adjusted using a global reference current to allow the delivery of appropriate stimulation currents (see Fig. 4A). In this study, pixel columns of the microchip were illuminated consecutively with bar-like stimuli of light (depending on experiment: 70 μm × 3 mm, 140 μm × 3 mm, or 560 μm × 3 mm) for 15 s. The light-bar stimulus was continuously presented to the retina/stimulation chip by moving the bar sequentially to 38 different positions (each separated by 70 μm) without any temporal delay between stimulus locations. This bar-stimulus paradigm did not evoke light-evoked spikes from wt retinas. An interpulse interval of 2 s was used between the 2-ms stimulation pulses, leading to a minimum of six repetitive electrical stimulus presentations at each stimulus location. The continuous bar presentation to a wt retina for 15 s/position may result in local photoreceptor adaptation, which however, does not affect any results presented here. The change in photocurrent detected by the stimulation chip was transferred to user-defined stimulation pulses, voltage limited to ±1.6 V. The stimulation current is calculated from the amplified (100×) voltage drop across a 10-Ω resistor in series with the common ground electrode (Eickenscheidt et al. 2012). Consistent stimulation currents are measured at each stimulus position. The main current pulse (2 ms duration) is preceded by a brief prepulse (0.1 ms) and followed by a rebound current of smaller amplitude and longer duration (10 ms) that ensures charge-balanced stimulation.
Fig. 4.

Spatially resolved poststimulus spike time histograms (PSTH) obtained for stimulation with different electrode sizes indicate the existence of an antagonistic surround in the wt and in the rd10 retina. A: PSTH obtained for a wt RGC stimulated with 2 different electrode sizes (140 × 3,000 μm2, gray circles; and 560 × 3,000 μm2, black squares). The large electrode field leads to a broader eRF center but evokes fewer spikes. B: PSTH obtained for an rd10 RGC stimulated with 2 different electrode sizes. The large electrode field leads to a broader eRF center but evokes fewer spikes. C: spatiotemporal response patterns of the RGC shown in A for 2 electrode sizes. D: spatiotemporal response patterns of the RGC shown in B for 2 electrode sizes. Original scale bars apply to all subplots (C and D).
Extracellular recording using a flex MEA.
The RGC activity was recorded using a custom-built, transparent, and flex MEA. The flex MEA technology was adapted from a previous report (Molina-Luna et al. 2007). Briefly, the conduction lines and electrodes are sandwiched between two polyimide foils (PI-2611). Above the electrode position, the upper polyimide layer is removed by photolithography. TiN is then sputtered onto the recording electrodes. The flex MEA used in this study comprises 16 electrodes (diameter: 10 μm; spacing: 60 μm), arranged in a 4 × 4 grid (Fig. 2C). The impedance of the electrodes was 500 kΩ at 1 kHz. The perforated polyimide foil (perforation diameter: 15–40 μm) allows for oxygenation of the retina. Here, the flex MEA was connected to preamplifiers (Multi Channel Systems MCS GmbH, Reutlingen, Germany), and the recording was performed using MC_Rack software (Multi Channel Systems MCS GmbH). The recording sampling rate was 50 kHz, with an amplifier input range of ±400 mV and occasionally of ±4 V. The small voltage range was used to identify spikes and the large voltage range to measure the stimulus-induced passive retinal signal (“stimulus artifact”) and determine the relative position of the stimulation electrodes to the recording electrodes. An Ag/AgCl pellet (World Precision Instruments, Sarasota, FL) was used as the common ground electrode for recording and stimulation.
Data analysis.
To extract the stimulus-evoked spiking activity of individual RGCs, an analysis process, including trigger alignment, artifact subtraction, spike detection, and clustering, was applied to the recordings. Timings of electrical stimulation onsets were derived from the microchip's internal clock signal. Illumination onset was logged from the OLED-driving personal computer's trigger output. Based on this information, the stimulation epochs were identified in the raw data, extracted, and aligned. The median of all electrode signals was derived for every point in time and subtracted from individual electrode signals to remove common-mode noise and reduce stimulation artifacts. The first 3 ms following stimulus onset was excluded from spike sorting, except for experiments where a large amplifier input range was selected. This latter experiment was only used to confirm that no spikes are evoked within the first 3 ms. Residual stimulation artifacts were modeled by moving polynomial regression (fifth order on 401 points) and subtracted from the data (Savitzky and Golay 1964). Spike detection was performed by threshold crossing using a multiple of the median absolute deviation on each electrode as threshold (5 × sigma) to compensate for high cell activity. To counteract sampling offsets, detected spike times were realigned to the energy center of the respective waveform. Spike waveforms were clustered by the expectation maximization algorithm (Kadir et al. 2014), and separated clusters were assigned to single RGCs. Duplicate recordings of the same cell on different electrodes were identified by temporal cross-correlation and were removed. RGC activity maps (Fig. 1C) were computed as probability density maps from the sorted spikes using multivariate kernel density estimation (Simonoff 1996). The estimated spike rates represent instantaneous rates.
The first-spike latency was calculated considering the three stimulus positions centered around the recording electrode. The position of the recording electrode, with respect to the stimulation electrodes, was estimated from the maximal stimulation amplitude or in the case of a saturated amplifier, from the decaying extracellular voltage signal at a fixed poststimulus time. For each position, the latency of the first spike was estimated, provided this spike was followed by at least a second spike within 5 ms to avoid counting spontaneous activity.
The diameter of the eRF was calculated by applying a Gaussian fit to the spatially resolved, poststimulus spike-time histograms (Fig. 1D). The radius of the eRF center corresponds to the SD boundary of the best-fit Gaussian profile. Only profiles with appropriate fit quality with a coefficient of determination of r2 > 0.7 were considered.
For statistical comparison, the Wilcoxon rank sum test was applied to keep significance evaluation nonparametric. All data analysis software was written in Python (version 2.7), including SciPy and Matplotlib (SciPy; http://www.scipy.org/), and Matlab 2014 (MathWorks, Natick, MA).
RESULTS
Electrically evoked RGC response patterns and receptive fields.
To assess the functional integrity of the inner retinal circuitry upon photoreceptor degeneration, we investigated the electrically evoked RGC response patterns and mapped their eRF in ex vivo retinas from two different rod-degeneration mouse models (rd10 and rd1) and from wt mice (C57BL/6J). The concept used throughout this study is illustrated in Fig. 1.
Electrical stimulation was performed with a microchip in a subretinal configuration (Fig. 1A). Details of the microchip and the stimulation protocol are given in methods and in Fig. 2. The stimulus-induced spiking activity from multiple RGCs was recorded using a flex MEA placed on the ganglion cell layer (Figs. 1A and 2C). Offline spike sorting assigned each spike to the corresponding RGC. On average, with the use of a 16-electrode flex MEA (electrode field: 180 × 180 μm2; electrode spacing: 60 μm), we identified six to seven RGCs per retina. All detected RGCs were activated by the electrical stimulation. For the mapping of eRFs, anodal current pulses were used, as this pulse polarity was suggested to depolarize bipolar cell axon terminals in subretinal stimulation, which in turn, leads to ganglion cell activity (Boinagrov et al. 2014; Eickenscheidt et al. 2012). The eRFs were mapped using a bar-like stimulus (140 × 3,000 μm) presented at equidistant (70 μm) stimulus positions across the retina. Figure 1B shows a representative recording of RGC activity evoked by stimulation at each stimulus position over a distance of ∼2.8 mm. This value corresponds to the size of the retina implant (see methods). The shape of the extracellular waveforms confirms that signals above the RGC soma are recorded and not from axons of passage (Fig. 1B). For each recorded RGC, the average evoked response (calculated as described in Data analysis) was plotted at each stimulus position as a color-coded map (Fig. 1C). These maps were used to distinguish RGC response patterns, depending on the response polarity and duration following stimulus onset. For the quantitative evaluation of the eRF size, spatially resolved poststimulus spike time histograms (PSTH) were calculated (Fig. 1D). The eRF diameter was evaluated by applying a Gaussian fit to the PSTH, as described in methods. Only PSTH profiles with a good fit quality (r2 > 0.7) were considered further, thus reducing the number of analyzed RGCs in the recorded area to an average value of 4.5 per retina.
In a separate experiment, with increased amplifier input range, we continuously identified spikes during stimulation without spike sorting and assigned them to corresponding RGCs. We confirmed that no direct RGC activation occurs for the used stimulation parameters (data not shown). Furthermore, in these experiments, the position of the recording electrode and thus of the RGC soma (Fig. 1C) was estimated with respect to the stimulation electrodes. This allows the estimation of how local the stimulated RGC responses are. The concept presented in Fig. 1 works equally well for blind and for healthy retinas, without any contamination from light-activated photoreceptors. We exclude any potential error of eRF estimation in wt retinas by presenting a continuous light stimulus (15 s) at each stimulus position. During the light stimulus, brief electrical pulses (2 ms) were generated by the microchip at a pulse rate of 0.5 Hz. Light onset and electrical pulses were uncorrelated. The continuous presentation of bar-like light stimuli, which was stepped every 15 s by 70 μm, is most probably the reason why we did not detect light-triggered responses in wt or in rd retinas. In summary, we developed a method to estimate spatiotemporal RGC response patterns and to quantify eRFs in healthy and blind retinas. In the following, we compare these response patterns and eRFs in different retinas.
Similarity of spatiotemporal RGC response patterns and eRFs in wt and rd10 retina for anodal stimulation.
We recorded different electrically evoked spatiotemporal RGC response patterns across the three investigated retina models. Based on the spatiotemporal characteristics (Fig. 1C), we first categorized the RGC responses in wt retinas (n = 13 retinas) as electrically ON (eON) if the RGC activity increased following the electrical stimulus. The eON responses were either transient (n = 42; Figs. 3A and 4C) if the RGC activity lasted <100 ms following stimulus onset or bursting if the eON activity showed a prolonged bursting (n = 29; Figs. 1C and 3B), exceeding a duration of 100 ms after stimulus onset. We identified for spontaneously active RGCs a decrease in activity following the electrical stimulus. These electrically OFF (eOFF; Fig. 3C) response patterns were detected together with eON patterns in the same retina. For eOFF response patterns (n = 14), the spontaneous spiking was reduced within a restricted area (eRF center) and within the first 100 ms upon stimulus onset. The OFF-type eRF is accompanied by an elevated evoked spiking in the surround of the eRF center, which extends over the entire chip length (2.8 mm). All three basic response types (eON transient, eON bursting, and eOFF) could be recorded in the same retina within a recording area of 180 × 180 μm2 (size of the recording electrode array). The estimated patterns overlapped in space, indicating that diverse retinal circuits are activated by one given electrical stimulus.
Fig. 3.
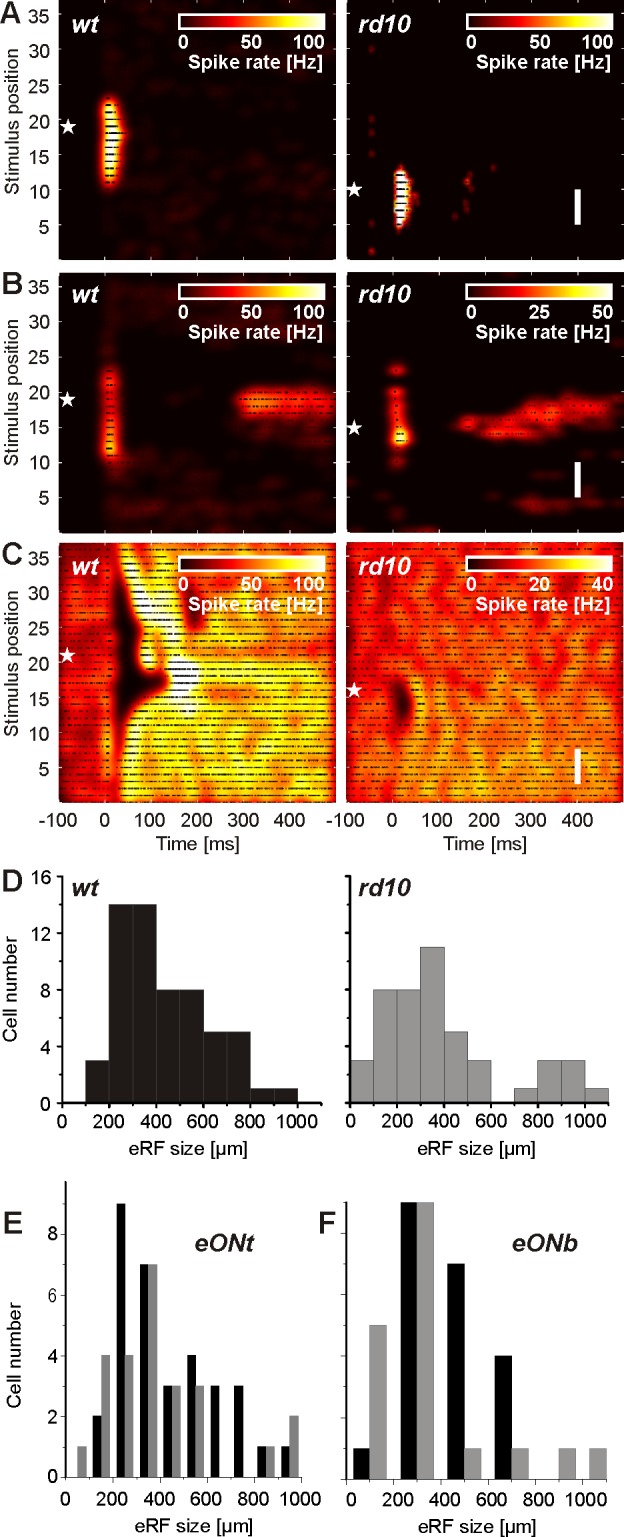
Spatiotemporal response patterns and eRF sizes of healthy wt (left) and blind rd10 (right) RGCs upon anodal subretinal stimulation. A–C: white stars mark the position of the recording electrode. A: eON transient RGC response pattern. B: eON bursting RGC response pattern. C: eOFF response pattern of spontaneously active RGCs. Original vertical scale bars, 350 μm (A–C). D: histogram of eRF sizes for 59 RGCs in wt (left) and 46 RGCs in rd10 (right) retinas. The median eRF size of the 2 populations is not statistically different. E: comparison of eRF sizes for wt (black bars) and rd10 (gray bars) RGCs with ON transient (eONt) response patterns. The median eRF sizes of the 2 populations are not statistically different. F: comparison of eRF sizes for wt (black bars) and rd10 (gray bars) RGCs with ON bursting (eONb) response patterns. The median eRF sizes of the 2 populations are not statistically different.
The electrically induced RGC patterns in rd10 retinas (n = 10 retinas) could be classified in the same way as eON transient (n = 18; Figs. 3A and 4D), bursting eON (n = 15; examples shown in Fig. 3B, and see Fig. 6B), or eOFF (n = 6; Fig. 3C). The eOFF response pattern is accompanied by elevated spiking in the surround, similar to the patterns detected in the wt retina. The ratio between eON and eOFF RGC patterns was biased toward eON in wt retinas (ratio: 5.1), as well as in rd10 retinas (ratio: 5.5). In the second rod-degenerated mouse model studied here (rd1), we identified eON responses (n = 27 RGCs/5 retinas) but never eOFF responses.
Fig. 6.

RGC response patterns and eRF size upon change in stimulus polarity. A: anodal (left) and cathodal (right) current stimuli used in this study. The current density is calculated as described in methods. The arrows indicate the start of the stimulation pulses. B: cathodal stimulation (right) evokes a spatially confined RGC pattern in the rd10 retina, with longer first-spike latency compared with anodal stimulation (left). White stars mark the position of the recording electrode. C: boxplot of first-spike latencies for rd10 (red) and wt (gray) RGCs for anodal and cathodal stimulation. The median first-spike latency (bars inside boxes) increases significantly for rd10 RGCs but not for wt RGCs. D: boxplot of eRF diameter for rd10 (red) and wt (gray) RGCs for anodal and cathodal stimulation. E: opposite stimulus polarity changes the stimulated oscillatory pattern of rd10 RGCs in the central part of the receptive field. Original vertical scale bars, 350 μm (B and E).
We next quantified the size of the electrically evoked RGC response patterns in healthy and blind retinas (Fig. 3D), based on the method illustrated in Fig. 1D. The median diameter of the eRF center was 396 μm in wt retinas (n = 59 RGCs/13 retinas) and 348 μm in rd10 retinas (n = 46 RGCs/10 retinas). Statistical comparison revealed no significant difference between the two populations (P = 0.11). Similarly, statistical comparison of the eRFs for eON transient (median diameter in wt: 390 μm; rd10: 336 μm) and eON bursting patterns (median diameter in wt: 420 μm; rd10: 324 μm) did not reveal any significant difference between wt and rd10 (P = 0.08 for eON transient; P = 0.25 for eON bursting patterns) RGCs. The histograms for these two response patterns are shown in Fig. 3, E and F.
The median eRF sizes estimated here represent an upper bound of the eRF, given that it was probed with 140 μm-wide stimulation electrodes. For both populations (wt and rd10), the majority of eRFs was smaller than 400 μm, as expected for light-induced receptive fields in mouse retina (Kerschensteiner et al. 2008). A smaller number of retinas (wt: n = 2 retinas; rd10: n = 4 retinas) were stimulated with narrower bar-like stimuli (70 × 3,000 μm2) as well. The median diameters of the eRF center estimated from these experiments (wt: 330 μm, n = 10 RGCs; rd10: 310 μm, n = 26 RGCs) are approximately the difference in smaller stimulus size compared with default values (140 × 3,000 μm2). To confirm further that the evaluated eRF is affected by stimulus size, we used a wider light-stimulation pattern (560 × 3,000 μm2) in a subset of retinas. All RGCs (wt: n = 12; rd10: n = 9) showed significantly larger eRFs (P < 0.001) compared with the same cells probed with the default stimuli (140 × 3,000 μm2). The eRF size increased, on average, by 300 μm.
Stimulation results using small and large electrode fields were compared with the activation of an antagonistic surround in rd10 and in wt retinas (Fig. 4). If an antagonistic surround would be electrically stimulated, then the evoked response amplitude should decrease compared with stimulation using electrodes matching the eRF size and centered onto the RGC (Zeck et al. 2005). Indeed, stimulation with large electrode fields (560 × 3,000 μm2) evoked fewer spikes at any stimulus position compared with activation of the same cells using small (140 × 3,000 μm2) electrode fields centered onto the cell soma. This result was confirmed in wt retinas (n = 8/12 RGCs; Fig. 4A) and in rd10 retinas (n = 7/9 RGCs; Fig. 4B). Stimulation with different electrode sizes did not change the RGC response patterns (Fig. 4, C and D).
We note further that stimulation with small electrodes also evoked RGC response patterns, extending up to 1,000 μm (Fig. 3, D and E). A small number of large eRFs have been reported in a recent study using another subretinal stimulation device (Lorach et al. 2015) and may be attributed to the electrical activation of horizontal or of large amacrine cells (Boinagrov et al. 2014; Eickenscheidt et al. 2012).
In summary, the three major spatiotemporal RGC response patterns detected in wt retinas are also found in rd10 retinas. The evaluated eRFs do not differ significantly in size. The electrical activation of an antagonistic surround (Figs. 3C and 4) indicates in rd10 retinas a network similar to the physiological surround network. For rd1 RGCs (data not shown), we found a significantly smaller eRF diameter (median: 234 μm, n = 27 RGC, P < 0.001) compared with wt eRF diameters. However, besides the spatially restricted, selective response patterns, we detected rhythmic RGC activity in both rd retinas, which will be discussed in the following.
Electrically evoked rhythmic activity patterns in blind retinas.
It has been reported previously that RGCs in blind retinas show rhythmic spontaneous activity with the fundamental frequency in the range of 5–10 Hz (Borowska et al. 2011; Menzler and Zeck 2011), which might interfere with electrical stimulation. Here, rhythmic RGC spiking was evoked by the brief electrical stimulation pulses in both rd10 and rd1 retinas. These patterns are reflected in the color-coded activity maps (Fig. 5, A and B). We recorded spatially confined rhythmic RGC response patterns (rd10: n = 9 RGCs; rd1: n = 12 RGCs; Fig. 5A) and a larger proportion of spatially unconfined RGC patterns (rd10: n = 12; rd1: n = 23; Fig. 5B). Both spatially confined and unconfined patterns were detected within the same retina. Their eRFs were not evaluated here.
Fig. 5.

Rhythmic RGC response patterns evoked by anodal stimulation in 2 different rod-degenerated retinas (rd10 and rd1). A and B: white stars mark the position of the recording electrode. A: spatially confined rhythmic response of an rd10 RGC (left) and of an rd1 RGC (right). B: spatially unconfined rhythmic response of an rd10 RGC (left) and of an rd1 RGC (right). Original vertical scale bars, 350 μm (A and B). C: distribution of the 3 major response RGC patterns in wt, rd10, and rd1. For each RGC population, the percentage of response types is calculated separately.
Spatially confined RGC patterns (Fig. 5A) were evoked in cells without any or with nonrhythmic spontaneous activity. In contrast, all RGCs displaying rhythmic spontaneous activity had spatially unconfined RGC patterns (Fig. 5B). The spontaneous firing rhythm matched the rhythm of 7–10 Hz, detected after stimulation. We note that the electrical stimulation frequency of 0.5 Hz, presented six times at the same position, stimulates these cells in different phases of their spontaneous activity. Therefore, rhythmic prestimulus activity is not visible in the activity maps shown in Fig. 5B.
The ratio of RGC patterns in wt, rd10, and rd1 retinas is summarized in Fig. 5C. First and most important, in wt and rd10 retinas, we observed eON and eOFF responses at a similar ratio. Secondly, none of the recorded RGCs in wt retinas showed electrically evoked rhythmic activity, whereas ∼30% of rd10 RGCs and >50% of rd1 RGCs showed stimulus-induced rhythmic activity. More than one-half of these rhythmic responses were spatially unconfined, which does not allow coding of stimulus position. Thirdly, none of the RGCs in rd1 retinas were inhibited by electrical stimulation. Given the diverse spatiotemporal patterns and spatially confined eRFs observed after anodal stimulation, we next asked how robust they are with respect to cathodal stimulus polarity.
Comparison of RGC response patterns for opposite stimulus polarities.
In a subset of experiments, we used cathodal stimulation pulses (Fig. 6A) with otherwise the same stimulation amplitudes. The stimulation current densities (20–40 mA/cm2) for both stimulus polarities are above the stimulation threshold (Eickenscheidt et al. 2012) but well below values reported for tissue damage (Butterwick et al. 2007; Cohen et al. 2011). This experiment is motivated by the finding that in healthy retinas, stimulation with opposite stimulus polarity activated different cell terminals (Boinagrov et al. 2014; Eickenscheidt et al. 2012; Im and Fried 2015).
The three major RGC response patterns (transient eON, bursting eON, and eOFF) were detected upon cathodal stimulation in wt retinas (n = 43 RGCs/8 retinas). In rd10 retinas (n = 36 RGCs/5 retinas), we detected, in addition, rhythmic RGC patterns. The RGC response patterns in wt or in rd10 never switched polarity; however, for some eON patterns, the bursting activity disappeared for cathodal stimuli (Fig. 6B).
To quantify the differences between anodal and cathodal stimulation, we evaluated three characteristics of the evoked RGC response: 1) first-spike latency, 2) size of the eRF, and 3) firing rate ratio for the two stimulus polarities. Anodal stimuli lead to bursting activity with a median first-spike latency of 5 ms for wt RGCs and of 7 ms for rd10 RGCs (n = 13 RGCs; Fig. 6C). The first-spike latency value, together with the response duration of ∼50 ms, indicates that bipolar cells are activated by anodal stimuli in these retinas (Eickenscheidt et al. 2012). The evaluation of first-spike latencies for cathodal stimuli revealed a significant and unexpected difference between RGCs in wt and rd10. Whereas in rd10, the median of the first-spike latency increased significantly to 35 ms (P = 0.002), it did not change for wt RGCs (P = 0.98).
Secondly, the median eRF diameter decreased for cathodal stimuli by ∼100 μm and by ∼200 μm for rd10 and wt RGCs, respectively, evaluated for a subset of 13 RGCs in each mouse strain (Fig. 6D). For rd10 RGCs, the change was not significant (P = 0.09), whereas it changed significantly for wt RGCs (P = 0.002). The latter result may be influenced by the relatively large median value of the wt subpopulation analyzed in this experiment (compared with the median eRF of all wt RGCs shown in Fig. 2D). For cathodal stimuli in rd1 retinas, only 5 out of 19 responsive RGCs had high-quality eRFs, with a median value not significantly different from anodal stimulation.
Thirdly, we analyzed the ratio of the evoked spikes (within the 500-ms poststimulus interval) for the two stimuli. For rd10 RGCs, anodal stimuli evoked a statistically significant, higher number of spikes compared with cathodal stimuli (ratio: 1.9, P < 0.05). In contrast, for wt RGCs, there was no significant difference in the number of evoked spikes (ratio: 1.1). This result, together with the unchanged response latency, indicates that wt RGCs are equally affected by the so-called anodal and cathodal pulses. The analysis of RGC response patterns to cathodal stimuli revealed unchanged eRF sizes for rd10 RGCs, longer response latencies, and a smaller number of evoked spikes.
Finally, we note that cathodal stimuli trigger rhythmic and spatially unconfined RGC patterns in rd10 RGCs (Fig. 6E) and in rd1 RGCs but never in wt RGCs. However, whereas anodal stimuli evoke a strong response within the eRF center of rhythmic cells, this response is nearly absent for cathodal stimuli.
In summary, although in a subretinal configuration, cathodal stimuli are less effective in stimulating the retinal circuitry of rd10 retinas, the robust RGC patterns indicate a preserved and excitable network that may signal polarity changes by the first-spike latency and/or spike number.
DISCUSSION
Our data have demonstrated that temporally diverse and spatially confined RGC response patterns are evoked by electrical stimulation of blind rd10 retina using an implantable microchip. These patterns are similar to the patterns observed in healthy wt retinas and may provide a basis for visual information coding in higher brain areas. However, in the majority of rd1 RGCs—a mouse model with early degeneration onset—and in a subset of rd10 RGCs, electrical stimulation evokes rhythmic and spatially nonrestricted response patterns, which prohibit coding of spatial information. In the following paragraphs, we provide the following: 1) discussion of the cellular basis of the evoked RGC response patterns, 2) comparison of the spatially restricted spiking to light-induced patterns, and 3) analysis of implications for vision-restoration strategies.
The spatially and temporally restricted RGC response patterns reported here for photoreceptor-degenerated retinas agree qualitatively with previous studies performed either in a healthy rabbit retina (Eickenscheidt et al. 2012; Im and Fried 2015) or in a healthy rat retina (Boinagrov et al. 2014). Early spiking onset (latency < 10 ms) was assigned to bipolar cell activation in the cited studies. The size of the eRFs and the first-spike latencies reported here for rd10 RGCs indicate that in a subretinal configuration, anodal stimuli activate bipolar cell terminals in a physiological way. This is in agreement with previous reports (Boinagrov et al. 2014; Eickenscheidt et al. 2012), indicating that long stimuli activate the retinal network, whereas short pulses activate ganglion cells directly. However, no cell type-specific distinction can be achieved by variation of the pulse duration. The long-latency spikes (latency > 10 ms), as detected here for the eON bursting RGC patterns (Fig. 3B), were assigned previously to photoreceptor activation (Boinagrov et al. 2014; Eickenscheidt et al. 2012), whereas a complex mechanism comprising multiple bursts is reported in a recent study in rabbit retina (Im and Fried 2015). The stimulation of remnant photoreceptor terminals (Busskamp et al. 2010) in rd retinas is unlikely here, given that late spiking is evoked at few stimulus positions centered on the cell soma (Figs. 1C, 3B, and 6B). The activation of photoreceptors in healthy retinas occurs over areas larger than 500 μm (Eickenscheidt et al. 2012). Given that the bursting patterns detected for several cells (shown in Figs. 3B, 5A, and 6B) were restricted to ∼200 μm, we suggest that small-sized interneurons are stimulated in rd10 and wt retinas, which themselves, activate RGCs. A possible candidate is the amacrine AII cell, which is involved in the rhythm generation in rd retinas (Trenholm and Awatramani 2015). In accordance with results shown for healthy retinas by Eickenscheidt et al. (2012) and Im and Fried (2015), stimulation with opposite polarity leads to a reduction of the RGC bursting pattern (Fig. 6B), indicating a preferential activation of the unknown cell class.
In both rd mouse models, hyperactive and rhythmic RGC activity has been reported in adult retinas (Stasheff 2008; Stasheff et al. 2011; Ye and Goo 2007). The degree of hyperactive and rhythmic spiking is higher in rd1 compared with rd10 (Menzler et al. 2014) and varies among retinas as well (Menzler and Zeck 2011). This finding corresponds to our observation, where approximately one-third of rd10 RGCs showed—independent of stimulus polarity—rhythmic activity patterns compared with >50% of rd1 RGCs. The rhythmic activity is most probably generated in amacrine AII cells (Borowska et al. 2011; Yee et al. 2014) and propagates in rd1, but apparently not in rd10, through the electrically coupled network of bipolar and amacrine AII cells across the retina, thereby activating postsynaptic RGCs (Zeck 2016). Electrical stimulation of the inner retina, as performed here, likely activates, in some cases, this aberrant network (Ryu et al. 2010), which extends over several millimeters (Figs. 5 and 6). We note that in all investigated rd10 retinas, spatially restricted RGC patterns were stimulated, accompanied in some cases by rhythmic patterns of neighboring RGCs. This result suggests that individual retinal circuitries may degenerate to different degrees at a given time point. This hypothesis is supported by the recent finding of different stimulation thresholds in the rd10 retina (Cho et al. 2016). Adjustment of the stimulation strength might avoid activation of aberrant network activity, probably at the cost of less-activated cells. Stimulation efficiency (i.e., increased percentage of spatially confined RGC responses) may be improved by blocking gap junctions (Barrett et al. 2015; Toychiev et al. 2013); however, further studies are needed to carefully titrate such drugs without silencing the retinal network completely (Menzler and Zeck 2011).
The electrically evoked response patterns reported here constitute a relevant fraction of physiological activity. However, 10 different RGC response patterns have been obtained in healthy retinas upon light stimulation with bar-like stimuli (Roska et al. 2006; Roska and Werblin 2001; Zeck et al. 2005). These patterns reveal distinct retinal circuits projecting to different RGC types; however, they do not reveal the full range of RGC cell types (Baden et al. 2016). The electrical stimulation used here activates different circuits in blind retinas, which then leads to the distinct RGC response patterns (ON transient, ON bursting, OFF transient) reported in Figs. 3–6. However, the brief stimulation pulse (2 ms), which is in contrast to the much-longer light stimuli applied in physiological conditions, most probably prevents the stimulation of additional patterns. The extension of the stimulation time to 1 s using capacitive electrodes revealed additional RGC response patterns, including the ON–OFF polarity (Eickenscheidt and Zeck 2012).
In healthy retinas, it has been established that different RGCs tile the ganglion cell layer with their receptive fields in a mosaic-like fashion (Wässle 2004). Consequently, the size of the receptive-field center is largely invariant to changes in stimulus size or polarity (Gauthier et al. 2009). Visual stimuli of different sizes are convolved with the spatial RF, thus leading to the different reported RGC patterns (Roska et al. 2006; Roska and Werblin 2001; Zeck et al. 2005). In agreement with these reports, electrical stimulation with increasing electrode sizes increases the response pattern (Fig. 4), suggesting a robust underlying neural basis of the integrative retinal circuitry. The reversal of the polarity of visual stimuli leads to few spikes or even inhibits spiking. For electrical stimulation, the reversal of stimulus polarity in a subretinal (epiretinal) configuration from an anodal (cathodal) to cathodal (anodal) configuration evokes fewer spikes but does not inhibit spiking (Im and Fried 2015). This effect is explained by a stimulation model (Boinagrov et al. 2014; Eickenscheidt et al. 2012), where monophasic anodal (cathodal) current polarities depolarize bipolar cell axon terminals in a subretinal (epiretinal) configuration. In agreement with this model, the extension of the cathodal stimulus phase leads to fewer stimulated RGCs, increases latency for rd10 RGCs (Fig. 6C), and evokes fewer spikes and slightly smaller eRFs (Fig. 6D). Anodal stimuli activate the eRF center (probably via bipolar cell activation), whereas cathodal stimuli preferentially activate the surround for rhythmic RGC patterns (Fig. 6E). The long latency spikes in rd10 (Fig. 6B) evoked by cathodal stimuli most probably originate from the activation of inhibitory retinal interneurons. The existence of retinal circuitries mediating an inhibitory surround in rd10 retinas is supported by the results shown in Figs. 3C and 4. An antagonistic surround in blind retinas might originate from the activation of remnant horizontal cells (Euler and Schubert 2015) or from the activation of an amacrine cell network. The rich response patterns reported here for blind retinas complement the response patterns reported for healthy rabbit retinas (Eickenscheidt et al. 2012; Im and Fried 2015, 2016). Future studies, aided by morphological characterizations, need to clarify to what degree the electrically evoked response patterns correspond to different cell types.
The implications of the presented results for vision-restoration strategies are analyzed in the following. Electrical implants are currently the most advanced vision restoration tools in clinical use (Chuang et al. 2014). A slightly modified version of the implantable microchip used here (see methods) has been used already by blind patients (Stingl et al. 2015). A second study using a preclinical implant (Lorach et al. 2015) reported the similarity of eRFs in healthy and rod-degenerated rat retina but did not evaluate the diversity and robustness of RGC patterns. Although the quantitative evaluation of the performance of electrical implants is encouraging, it also points to limitations. Only a few cells were inhibited by electrical stimuli (Fig. 5C), whereas in healthy retinas, physiological, incremental light stimuli inhibit one-half of the RGCs (the so-called OFF RGCs). Preliminary experiments show that light-induced RGC response patterns, estimated using 1 Hz flicker protocol, do not correspond to the electrically evoked RGC response patterns. The strong bias toward eON RGC response patterns likely explains the performance of implanted patients to detect bright objects on a dark background (da Cruz et al. 2013; Stingl et al. 2015; Zrenner et al. 2011). Inversion of physiological light-stimulus polarity evokes inversion of the RGC response pattern. Here, we observed little changes in the electrically evoked RGC patterns when switching stimulus polarity (Fig. 6). We speculate that the anodal stimulus component (Fig. 6A) excites for both stimulus waveforms the axonal terminals of bipolar cells, therefore leading to a strong bias for ON-type electrically evoked responses. High-frequency stimulation combined with diamond-shaped, low-frequency modulation demonstrated ON and OFF response patterns in rabbit RGCs, which switched response polarity upon switching stimulus polarity (Twyford et al. 2014). The challenge of continuous high-frequency stimulation using metal-based electrodes may be the following: 1) the surface potential, which needs to remain in a safe voltage range to avoid electrochemical reactions, and 2) the avoidance of axonal stimulation (Eickenscheidt and Zeck 2014). Gene-replacement therapy and optogenetics (Sahel and Roska 2013), synthetic photo-switchable ligand stimulation (Polosukhina et al. 2012), or cell transplantation (Jayakody et al. 2015) are alternative strategies to evoke ON and OFF response patterns in RGCs of blind retinas. Light activation of the optogenetic actuator halorhodopsin in remnant cones (Busskamp et al. 2010) or activation of a chimeric melanopsin- metabotropic glutamate receptor 6 molecule in rd1 ON bipolar cells (van Wyk et al. 2015) restored ON and OFF RGC response polarities. Similarly, upon gene-replacement therapy (Michalakis et al. 2010) or after the transplantation of cone-like cells (Santos-Ferreira et al. 2015) in photoreceptor-deficient mice, ON and OFF RGC response patterns have been reported. For the listed alternative approaches, a quantitative analysis of diversity of induced RGC patterns and of stimulated receptive fields is missing.
In conclusion, our study shows that the remaining neuronal circuits in photoreceptor-degenerated retinas appear to be functionally connected for many RGCs and thus enable spatially confined and temporally diverse stimulated activity. Future improved vision restoration strategies may avoid the easily inducible rhythmicity and enable elaborate stimulation protocols for activating diverse response patterns by the many different ganglion cell types.
GRANTS
Support for this work was partially provided by a grant of the German Ministry of Education and Research (BMBF; FKZ: 1312038).
DISCLOSURES
No conflicts of interest, financial or otherwise, are declared by the authors.
AUTHOR CONTRIBUTIONS
F.H., M.E., and G.Z. conception and design of research; H.S. and F.H. performed experiments; H.S. and F.H. analyzed data; H.S., M.E., and G.Z. interpreted results of experiments; H.S. and F.H. prepared figures; H.S., F.H., and G.Z. drafted manuscript; H.S., F.H., M.E., and G.Z. edited and revised manuscript; H.S., F.H., M.E., and G.Z. approved final version of manuscript.
ACKNOWLEDGMENTS
K. Gutöhrlein is gratefully acknowledged for the manufacturing of the flexible microelectrode arrays. Two subretinal microchips were kindly provided by Retina Implant AG (Reutlingen, Germany).
Present address of M. Eickenscheidt: Laboratory for Biomedical Microtechnology, Dept. of Microsystem Engineering, IMTEK, Univ. of Freiburg, 79110 Freiburg, Germany.
REFERENCES
- Ayton LN, Blamey PJ, Guymer RH, Luu CD, Nayagam DA, Sinclair NC, Shivdasani MN, Yeoh J, McCombe MF, Briggs RJ, Opie NL, Villalobos J, Dimitrov PN, Varsamidis M, Petoe MA, McCarthy CD, Walker JG, Barnes N, Burkitt AN, Williams CE, Shepherd RK, Allen PJ; Bionic Vision Australia Research Consortium. First-in-human trial of a novel suprachoroidal retinal prosthesis. PLoS One 9: e115239, 2014. [DOI] [PMC free article] [PubMed] [Google Scholar]
- Baden T, Berens P, Franke K, Román Rosón M, Bethge M, Euler T. The functional diversity of retinal ganglion cells in the mouse. Nature 529: 345–350, 2016. [DOI] [PMC free article] [PubMed] [Google Scholar]
- Barrett JM, Degenaar P, Sernagor E. Blockade of pathological retinal ganglion cell hyperactivity improves optogenetically evoked light responses in rd1 mice. Front Cell Neurosci 9: 330, 2015. [DOI] [PMC free article] [PubMed] [Google Scholar]
- Boinagrov D, Pangratz-Fuehrer S, Goetz G, Palanker D. Selectivity of direct and network-mediated stimulation of the retinal ganglion cells with epi-, sub- and intraretinal electrodes. J Neural Eng 11: 026008, 2014. [DOI] [PMC free article] [PubMed] [Google Scholar]
- Borowska J, Trenholm S, Awatramani GB. An intrinsic neural oscillator in the degenerating mouse retina. J Neurosci 31: 5000–5012, 2011. [DOI] [PMC free article] [PubMed] [Google Scholar]
- Busskamp V, Duebel J, Balya D, Fradot M, Viney TJ, Siegert S, Groner AC, Cabuy E, Forster V, Seeliger M, Biel M, Humphries P, Paques M, Mohand-Said S, Trono D, Deisseroth K, Sahel JA, Picaud S, Roska B. Genetic reactivation of cone photoreceptors restores visual responses in retinitis pigmentosa. Science 329: 413–417, 2010. [DOI] [PubMed] [Google Scholar]
- Butterwick A, Vankov A, Huie P, Freywert Y, Palanker D. Tissue damage by pulsed electrical stimulation. IEEE Trans Biomed Eng 54: 2261–2267, 2007. [DOI] [PubMed] [Google Scholar]
- Chang B, Hawes NL, Hurd RE, Davisson MT, Nusinowitz S, Heckenlively JR. Retinal degeneration mutants in the mouse. Vision Res 42: 571–525, 2002. [DOI] [PubMed] [Google Scholar]
- Cho A, Ratliff C, Sampath A, Weiland J. Changes in ganglion cell physiology during retinal degeneration influence excitability by prosthetic electrodes. J Neural Eng 13: 025001, 2016. [DOI] [PMC free article] [PubMed] [Google Scholar]
- Chuang AT, Margo CE, Greenberg PB. Retinal implants: a systematic review. Br J Ophthalmol 98: 852–856, 2014. [DOI] [PubMed] [Google Scholar]
- Cohen E, Agrawal A, Connors M, Hansen B, Charkhkar H, Pfefer J. Optical coherence tomography imaging of retinal damage in real time under a stimulus electrode. J Neural Eng 8: 056017, 2011. [DOI] [PubMed] [Google Scholar]
- da Cruz L, Coley BF, Dorn J, Merlini F, Filley E, Christopher P, Chen FK, Wuyyuru V, Sahel J, Stanga P, Humayun M, Greenberg RJ, Dagnelie G. The Argus II Epiretinal Prosthesis System allows letter and word reading and long-term function in patients with profound vision loss. Br J Ophthalmol 97: 632–636, 2013. [DOI] [PMC free article] [PubMed] [Google Scholar]
- Eickenscheidt M, Jenkner M, Thewes R, Fromherz P, Zeck G. Electrical stimulation of retinal neurons in epiretinal and subretinal configuration using a multicapacitor array. J Neurophysiol 107: 2742–2755, 2012. [DOI] [PubMed] [Google Scholar]
- Eickenscheidt M, Zeck G. Action potentials in retinal ganglion cells are initiated at the site of maximal curvature of the extracellular potential. J Neural Eng 11: 036006, 2014. [DOI] [PubMed] [Google Scholar]
- Eickenscheidt M, Zeck G. Repetitive capacitive stimulation of the retina in a stack-configuration. In: 8th International Meeting on Substrate-integrated Microelectrode Arrays. Reutlingen, Germany: NMI Natural and Medical Sciences Institute at the University of Tuebingen, 2012, p. 188–189. [Google Scholar]
- Euler T, Schubert T. Multiple independent oscillatory networks in the degenerating retina. Front Cell Neurosci 9: 444, 2015. [DOI] [PMC free article] [PubMed] [Google Scholar]
- Fujikado T, Kamei M, Sakaguchi H, Kanda H, Morimoto T, Ikuno Y, Nishida K, Kishima H, Maruo T, Konoma K, Ozawa M, Nishida K. Testing of semichronically implanted retinal prosthesis by suprachoroidal-transretinal stimulation in patients with retinitis pigmentosa. Invest Ophthalmol Vis Sci 52: 4726–4733, 2011. [DOI] [PubMed] [Google Scholar]
- Gauthier JL, Field GD, Sher A, Greschner M, Shlens J, Litke AM, Chichilnisky EJ. Receptive fields in primate retina are coordinated to sample visual space more uniformly. PLoS Biol 7: e1000063, 2009. [DOI] [PMC free article] [PubMed] [Google Scholar]
- Im M, Fried SI. Indirect activation elicits strong correlations between light and electrical responses in ON but not OFF retinal ganglion cells. J Physiol 593: 3577–3596, 2015. [DOI] [PMC free article] [PubMed] [Google Scholar]
- Im M, Fried SI. Temporal properties of network-mediated responses to repetitive stimuli are dependent upon retinal ganglion cell type. J Neural Eng 13: 025002, 2016. [DOI] [PMC free article] [PubMed] [Google Scholar]
- Jayakody SA, Gonzalez-Cordero A, Ali RR, Pearson RA. Cellular strategies for retinal repair by photoreceptor replacement. Prog Retin Eye Res 46: 31–66, 2015. [DOI] [PubMed] [Google Scholar]
- Jones BW, Marc RE. Retinal remodeling during retinal degeneration. Exp Eye Res 81: 123–137, 2005. [DOI] [PubMed] [Google Scholar]
- Kadir SN, Goodman DF, Harris KD. High-dimensional cluster analysis with the masked EM algorithm. Neural Comput 26: 2379–2394, 2014. [DOI] [PMC free article] [PubMed] [Google Scholar]
- Kerschensteiner D, Liu H, Cheng CW, Demas J, Cheng SH, Hui CC, Chow RL, Wong RO. Genetic control of circuit function: Vsx1 and Irx5 transcription factors regulate contrast adaptation in the mouse retina. J Neurosci 28: 2342–2352, 2008. [DOI] [PMC free article] [PubMed] [Google Scholar]
- Levick WR. Receptive fields and trigger features of ganglion cells in the visual streak of the rabbit's retina. J Physiol 188: 285–307, 1967. [DOI] [PMC free article] [PubMed] [Google Scholar]
- Lorach H, Goetz G, Smith R, Lei X, Mandel Y, Kamins T, Mathieson K, Huie P, Harris J, Sher A, Palanker D. Photovoltaic restoration of sight with high visual acuity. Nat Med 21: 476–482, 2015. [DOI] [PMC free article] [PubMed] [Google Scholar]
- Luo YH, da Cruz L. The Argus(®) II Retinal Prosthesis System. Prog Retin Eye Res 50: 89–107, 2016. [DOI] [PubMed] [Google Scholar]
- Maturana MI, Apollo NV, Hadjinicolaou AE, Garrett DJ, Cloherty SL, Kameneva T, Grayden DB, Ibbotson MR, Meffin H. A simple and accurate model to predict responses to multi-electrode stimulation in the retina. PLoS Comput Biol 12: e1004849, 2016. [DOI] [PMC free article] [PubMed] [Google Scholar]
- Mazzoni F, Novelli E, Strettoi E. Retinal ganglion cells survive and maintain normal dendritic morphology in a mouse model of inherited photoreceptor degeneration. J Neurosci 28: 14282–14292, 2008. [DOI] [PMC free article] [PubMed] [Google Scholar]
- Meister M, Pine J, Baylor DA. Multi-neuronal signals from the retina-acquisition and analysis. J Neurosci 51: 95–106, 1994. [DOI] [PubMed] [Google Scholar]
- Menzler J, Channappa L, Zeck G. Rhythmic ganglion cell activity in bleached and blind adult mouse retina. PloS One 9: e106047, 2014. [DOI] [PMC free article] [PubMed] [Google Scholar]
- Menzler J, Zeck G. Network oscillations in rod-degenerated mouse retinas. J Neurosci 31: 2280–2291, 2011. [DOI] [PMC free article] [PubMed] [Google Scholar]
- Michalakis S, Muhlfriedel R, Tanimoto N, Krishnamoorthy V, Koch S, Fischer MD, Becirovic E, Bai L, Huber G, Beck SC, Fahl E, Buning H, Paquet-Durand F, Zong X, Gollisch T, Biel M, Seeliger MW. Restoration of cone vision in the CNGA3−/− mouse model of congenital complete lack of cone photoreceptor function. Mol Ther 18: 2057–2063, 2010. [DOI] [PMC free article] [PubMed] [Google Scholar]
- Molina-Luna K, Buitrago MM, Hertler B, Schubring M, Haiss F, Nisch W, Schulz JB, Luft AR. Cortical stimulation mapping using epidurally implanted thin-film microelectrode arrays. J Neurosci Methods 161: 118–125, 2007. [DOI] [PubMed] [Google Scholar]
- Polosukhina A, Litt J, Tochitsky I, Nemargut J, Sychev Y, De Kouchkovsky I, Huang T, Borges K, Trauner D, Van Gelder RN, Kramer RH. Photochemical restoration of visual responses in blind mice. Neuron 75: 271–282, 2012. [DOI] [PMC free article] [PubMed] [Google Scholar]
- Rodieck RW. The First Steps in Seeing. Sunderland, MA: Sinauer Associates, Inc, 1998. [Google Scholar]
- Roska B, Molnar A, Werblin FS. Parallel processing in retinal ganglion cells: how integration of space-time patterns of excitation and inhibition form the spiking output. J Neurophysiol 95: 3810–3822, 2006. [DOI] [PubMed] [Google Scholar]
- Roska B, Werblin F. Vertical interactions across ten parallel, stacked representations in the mammalian retina. Nature 410: 583–587, 2001. [DOI] [PubMed] [Google Scholar]
- Rothermel A, Liu L, Aryan NP, Fischer M, Wuenschmann J, Kibbel S, Harscher A. A CMOS chip with active pixel array and specific test features for subretinal implantation. IEEE J Solid-St Circ 44: 290–300, 2009. [Google Scholar]
- Ryu SB, Ye JH, Goo YS, Kim CH, Kim KH. Temporal response properties of retinal ganglion cells in rd1 mice evoked by amplitude-modulated electrical pulse trains. Invest Ophthalmol Vis Sci 51: 6762–6769, 2010. [DOI] [PubMed] [Google Scholar]
- Sahel JA, Roska B. Gene therapy for blindness. Annu Rev Neurosci 36: 467–488, 2013. [DOI] [PubMed] [Google Scholar]
- Santos A, Humayun MS, deJuan E, Greenburg RJ, Marsh MJ, Klock IB, Milam AH. Preservation of the inner retina in retinitis pigmentosa. A morphometric analysis. Arch Ophthalmol 115: 511–515, 1997. [DOI] [PubMed] [Google Scholar]
- Santos-Ferreira T, Postel K, Stutzki H, Kurth T, Zeck G, Ader M. Daylight vision repair by cell transplantation. Stem Cells 33: 79–90, 2015. [DOI] [PubMed] [Google Scholar]
- Savitzky A, Golay MJ. Smoothing and differentiation of data by simplified least squares procedures. Anal Chem 36: 1627–1639, 1964. [Google Scholar]
- Simonoff JS. Smoothing Methods in Statistics (Springer Series in Statistics). New York: Springer-Verlag, 1996. [Google Scholar]
- Stasheff SF. Emergence of sustained spontaneous hyperactivity and temporary preservation of OFF responses in ganglion cells of the retinal degeneration (rd1) mouse. J Neurophysiol 99: 1408–1421, 2008. [DOI] [PubMed] [Google Scholar]
- Stasheff SF, Shankar M, Andrews MP. Developmental time course distinguishes changes in spontaneous and light-evoked retinal ganglion cell activity in rd1 and rd10 mice. J Neurophysiol 105: 3002–3009, 2011. [DOI] [PubMed] [Google Scholar]
- Stingl K, Bartz-Schmidt KU, Besch D, Chee CK, Cottriall CL, Gekeler F, Groppe M, Jackson TL, MacLaren RE, Koitschev A, Kusnyerik A, Neffendorf J, Nemeth J, Naeem MA, Peters T, Ramsden JD, Sachs H, Simpson A, Singh MS, Wilhelm B, Wong D, Zrenner E. Subretinal visual implant alpha IMS—clinical trial interim report. Vision Res 111: 149–160, 2015. [DOI] [PubMed] [Google Scholar]
- Stutzki H, Leibig C, Andreadaki A, Fischer D, Zeck G. Inflammatory stimulation preserves physiological properties of retinal ganglion cells after optic nerve injury. Front Cell Neurosci 8: 38, 2014. [DOI] [PMC free article] [PubMed] [Google Scholar]
- Toychiev AH, Ivanova E, Yee CW, Sagdullaev BT. Block of gap junctions eliminates aberrant activity and restores light responses during retinal degeneration. J Neurosci 33: 13972–13977, 2013. [DOI] [PMC free article] [PubMed] [Google Scholar]
- Trenholm S, Awatramani GB. Origins of spontaneous activity in the degenerating retina. Front Cell Neurosci 9: 277, 2015. [DOI] [PMC free article] [PubMed] [Google Scholar]
- Twyford P, Cai C, Fried S. Differential responses to high-frequency electrical stimulation in ON and OFF retinal ganglion cells. J Neural Eng 11: 025001, 2014. [DOI] [PMC free article] [PubMed] [Google Scholar]
- van Wyk M, Pielecka-Fortuna J, Lowel S, Kleinlogel S. Restoring the ON switch in blind retinas: opto-mGluR6, a next-generation, cell-tailored optogenetic tool. PLoS Biol 13: e1002143, 2015. [DOI] [PMC free article] [PubMed] [Google Scholar]
- Wässle H. Parallel processing in the mammalian retina. Nat Rev Neurosci 5: 747–757, 2004. [DOI] [PubMed] [Google Scholar]
- Ye JH, Goo YS. The slow wave component of retinal activity in rd/rd mice recorded with a multi-electrode array. Physiol Meas 28: 1079–1088, 2007. [DOI] [PubMed] [Google Scholar]
- Yee CW, Toychiev AH, Ivanova E, Sagdullaev BT. Aberrant synaptic input to retinal ganglion cells varies with morphology in a mouse model of retinal degeneration. J Comp Neurol 522: 4085–4099, 2014. [DOI] [PMC free article] [PubMed] [Google Scholar]
- Zeck G. Aberrant activity in degenerated retinas revealed by electrical imaging. Front Cell Neurosci 10: 25, 2016. [DOI] [PMC free article] [PubMed] [Google Scholar]
- Zeck GM, Xiao Q, Masland RH. The spatial filtering properties of local edge detectors and brisk-sustained retinal ganglion cells. Eur J Neurosci 22: 2016–2026, 2005. [DOI] [PubMed] [Google Scholar]
- Zrenner E, Bartz-Schmidt KU, Benav H, Besch D, Bruckmann A, Gabel VP, Gekeler F, Greppmaier U, Harscher A, Kibbel S, Koch J, Kusnyerik A, Peters T, Stingl K, Sachs H, Stett A, Szurman P, Wilhelm B, Wilke R. Subretinal electronic chips allow blind patients to read letters and combine them to words. Proc Biol Sci 278: 1489–1497, 2011. [DOI] [PMC free article] [PubMed] [Google Scholar]