Abstract
In vivo imaging of treatment responses at the molecular level could have a significant impact on the speed of drug discovery and ultimately lead to personalized medicine. Strong interest has been shown in developing quantitative fluorescence-based technologies with good molecular specificity and sensitivity for noninvasive 3D imaging through tissues and whole animals. We show herein that tumor response to chemotherapy can be accurately resolved by fluorescence molecular tomography (FMT) with a phosphatidylserine-sensing fluorescent probe based on modified annexins. We observed at least a 10-fold increase of fluorochrome concentration in cyclophosphamide-sensitive tumors and a 7-fold increase of resistant tumors compared with control studies. FMT is an optical imaging technique developed to overcome limitations of commonly used planar illumination methods and demonstrates higher quantification accuracy validated by histology. It is further shown that a 3-fold variation in background absorption heterogeneity may yield 100% errors in planar imaging but only 20% error in FMT, thus confirming tomographic imaging as a preferred tool for quantitative investigations of fluorescent probes in tissues. Tomographic approaches are found essential for small-animal optical imaging and are potentially well suited for clinical drug development and monitoring.
Keywords: drug discovery, quantification, three-dimensional
The ability to noninvasively image molecular processes in vivo is an emerging reality with different reporter and detection approaches (1, 2). Molecular imaging has been heralded to lead to earlier detection than current anatomical imaging approaches, which typically detect late-stage abnormalities. Another important prospect of molecular imaging is the ability to examine and quantify treatment responses in vivo by monitoring specific primary molecules or downstream targets. Therapeutic efficacy could then be probed dynamically on timescales of hours to days. This ability is in contrast to the mainstay of today's healthcare with traditionally late end points of drug efficacy, a practice that often impairs prompt revision and exclusion of ineffective treatment strategies with potentially lethal results.
Drug-induced apoptosis is considered a generic biomarker of monitoring the effects of chemotherapeutic drugs (3), antihormonal therapeutics (4), or antiangiogenic therapies (5). Of several different detection methods, optical imaging is emerging as an important alternative to techniques using ionizing radiation and offers the advantages of stable fluorochromes, easier to perform chemistries, and portable and cost-effective imaging practices. Laxman et al. (6), for example, developed a recombinant luciferase reporter molecule that amplifies luminescence in apoptotic cells by specific cleavage of a Asp-Glu-Val-Asp fragment by caspase 3, which can be used in animal studies. Fluorescence detection using an annexin V probe tagged with a cyanine dye has been demonstrated by Schellenberger et al. (7) and Petrovsky et al. (8). Imaging of drug targets has also been demonstrated recently in a study that monitored MMP2 suppression after Prinomastat treatment with fluorescent activatable probes (9).
Despite the development of novel fluorescent probes, most optical investigations are performed by using planar imaging, i.e., by obtaining 2D fluorescence images of the tissue investigated by using appropriate filters, similar to photography. Planar imaging has received much attention because of its ease of implementation and operational simplicity, but it also comes with significant limitations, including lack of quantification, low penetration depths (<1 cm), and inability to accurately provide depth and size information (10). Optical tomography could overcome several of these limitations by using accurate theoretical models of photon propagation in tissues and subsequent mathematical inversion (10–12), yielding improved resolution, penetration depth, and quantification performance. Fluorescence tomography of whole animals and human organs is feasible in the near-IR region where the lower tissue attenuation allows the penetration of photons over several centimeters (13). Considerable literature exists in theoretical models of photon propagation in diffuse media but, despite original experimental studies with phantoms (14–17), the in vivo demonstration of tomographic utility over existing imaging methods is limited. A few fiber-based systems for fluorescence tomography were recently reported (18–20) and the feasibility for in vivo imaging of proteases was demonstrated (21). Fiber technology limits the spatial sampling of photon signals and has been shown to compromise imaging performance and resolution (22). Improved performance and image fidelity is expected by high spatial sampling systems using noncontact detection of diffuse photons through animal bodies, accomplished by direct lens coupling of a charge-coupled device camera for tomographic detection (23, 24). Besides tomographic improvements, advanced scanning schemes, such as raster scanning, have also been reported recently (25) as alternatives to improving planar imaging detection.
This work focused on two major areas. The first was to examine the basic feasibility to tomographically assess treatment response and correlate tomographic findings in whole animals with microscopic tissue observations of excised samples. The second focus was to investigate how fluorescence molecular tomography (FMT) compares with planar imaging technologies currently used for small-animal optical imaging. We investigated the performance of this technique with phantoms and in vivo with previously validated phosphatidylserine-sensing and control fluorochromes based on modified annexins (7). We hypothesized that FMT could accurately visualize treatment response to chemotherapy and attain significant utility to drug discovery by combining the simplicity and versatility of fluorescent probes with 3D visualization and quantification capacity. A related assumption was that FMT could offer superior quantification performance compared with planar optical imaging methods. The findings of this work demonstrate that FMT could surpass the imaging capacity of planar optical imaging as is currently applied and could offer the imaging robustness required to transform optical imaging from a qualitative modality to an accurate technology with wide applications in drug research and discovery.
Materials and Methods
Fluorescent Probes. Two modified annexin V probes were synthesized similarly to procedures reported earlier (7, 8, 26). Recombinant annexin V, identical with that used clinically, was provided by Theseus Imaging (Worcester, MA) (3) and was dialyzed against sodium bicarbonate (0.1 M, pH 8.0) before use. The reaction of 1 mg of annexin V (3 mg/ml) with two vials of Cy5.5 (≈500 μg of dye, emission/excitation maxima 670 and 692 nm, respectively) resulted in 1.1 mol of Cy5.5 dye (673 nm excitation maximum, 690 nm emission maximum) per mole of protein (batch to batch variations of dye) termed Cy5.51.1–annexin V. The second probe, used for control purposes, was an overloaded variant of Cy5.51.1–annexin V, where ≈2.4 dyes were loaded per annexin V molecule. It was found that the Cy5.52.4–annexin V loses binding affinity but retains physical properties equal to active Cy5.51.1–annexin V (26). With this probe, it is possible to measure nonspecific accumulation in the tumor. Protein was separated from nonreacted fluorochromes by two successive spin separations by using 10-ml BioGel P6 columns in PBS pH 7,4 (Bio-Rad). The Cy5.5 dye concentration was measured spectrophotometrically (Cy5.5 E678 = 250,000) and protein was determined by the bicinchoninic acid (BCA) method (Bio-Rad). The binding affinity for apoptotic cells was controlled by fluorescence-activated cell-sorting analysis of camptothecin-treated Jurkat T cells as described previously.
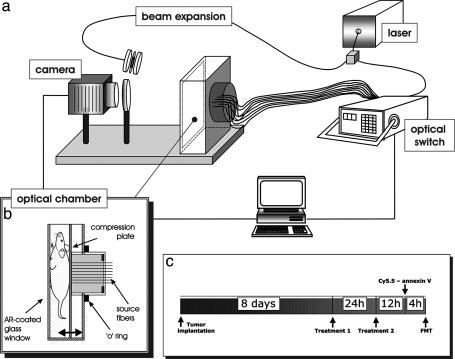
Animal Models and Imaging Protocol. Procedures were approved by the Center for Molecular Imaging Research's animal care and use committee and are graphically depicted in Fig. 1c. Lewis lung carcinoma (LLC) cell lines sensitive to and resistant to cyclophosphamide were provided by T. Browder (Children's Hospital, Boston). Cells were grown as monolayers in DMEM (Cellgro, Mediatech, Washington, DC), containing 10% inactivated FBS, 1% penicillin/streptomycin, and 0.15% l-glutamine at 37°C in a humidified 5% CO2 atmosphere. One million cells (0.05 ml) of LLC were s.c. injected into the left mammary pad in 13 female athymic nu/nu mice (28 g; The Jackson Laboratory). Three days after implantation of the LLC cells, 1 million cyclophosphamide-resistant LLC (CR-LLC) cells (0.05 ml) were injected at the contralateral mammary pad (right). Different implantation days were selected because of the faster growth rate of the CR-LLC cell line. Tumors reached average diameters of 3–4 mm ≈8 days after LLC implantation, although size variations of ±9 mm between the left and right side were not uncommon. Eight and 10 days after LLC implantation, 10 animals received 170 mg/kg i.p. cyclophosphamide (Mead Johnson). Three animals did not receive treatment for negative control purposes.
Fig. 1.
The combined planar imaging/FMT system. (a) A schematic of the major components of the system is shown, with details given in the text. (b) Details of the imaging chamber that was used for planar, transillumination, and tomographic acquisitions of small animals. AR-coated, antireflection-coated. (c) Experimental protocol followed for the animal studies performed.
At 11 days after CR-LLC implantation, seven treated animals and the untreated animals (n = 3) were anesthetized (ketamine/xylazine, 200/30 mg/kg i.p.) and injected with 1 nmol of Cy5.5–annexin V (about 1 mol of dye molecule per mol of annexin V) in 200 μl of saline by the tail vein. The remaining three treated animals were similarly administered the inactive Cy5.5 2.4–annexin V probe at 1 nmol of dye (≈2.4 mol of dye molecule per mol of annexin V). Two hours after probe injection, all animals were anesthetized again and imaged by using FMT and planar illumination imaging.
Optical Imaging and Tomography. All optical imaging studies were performed with a prototype imaging scanner (23) that implements a planar and an FMT system as shown in Fig. 1a. The central piece of the system was the animal-imaging chamber that was configured in parallel plate geometry as shown in Fig. 1b. The chamber consisted of a moving plate holding 32 optical fibers, which placed the mice against a glass window applying slight pressure. The core and clad dimensions of the 32 source fibers were 100 and 140 μm, respectively. The chamber was water-sealed, and the animal was surrounded by matching fluid for simplifying the boundary conditions of the tomographic problem, although more recently we have reported on reconstruction methods that do not require matching fluids (27, 28). The light source was a laser diode at 672 nm, typically operating at 10 mW (actual delivered power was ≈1 mW). Light was directed to an 1 × 2 optical switch (Dicon Fiberoptics, Richmond, CA). One output of the switch was channeled through a beam splitter (not shown) to a 1 × 32 optical switch that sequentially illuminated each of the 32 source fibers on the moving plate of the animal chamber. The second output of the beam splitter implemented a reference channel for monitoring and postprocessing correction of laser fluctuations. The second output of the 1 × 2 optical switch was directed to a beam expander that can front-illuminate the rodent imaged through the glass window of the imaging chamber in a planar imaging mode. All imaging was performed with a charge-coupled device camera (Roper Scientific, Trenton, NJ; VersArray 16-bit, –40°C cooled, 5122 pixels back-illuminated) by means of an imaging lens (Nikon 35 mm f/1.2) and appropriate band pass (three-cavity interference at 670 nm ± 5nm for excitation measurements and 710 nm ± 10 nm for emission measurements; Andover, Salem, NH) and long-pass filter (cutoff, 695 nm for emission measurements; Omega Optical, Brattleboro, VT) filters.
FMT was performed with a previously reported theoretical model that combines measurements at both the excitation and emission wavelengths (16). The algorithm solves a volume integral equation that relates spatially distributed fluorochrome concentrations (in physical units) to the measurements. Inversion was performed by using the algebraic reconstruction technique. Convergence was assumed after 20 iterations, as empirically determined to yield optimal imaging performance based on phantom measurements. Although several criteria may be applied to ensure convergence, we often find that this approach yields the most robust results. Typical volumes considered in the reconstruction mesh assumed a field of view of 2.2 cm × 1.6 cm with typical slab width of 1.3 cm. We used 40 × 25 detector measurements over the same field of view (2.2 cm × 1.6 cm). Each detector assumed 4 × 4 pixel binning.
Quantification. Although FMT is based on self-referenced measurements, it requires a single calibration constant Q that accounts for the system's spectral response, transmission factors, and gains as noted in ref. 16. Absolute concentration values plotted on the images are based on a Q obtained from calibration studies done on nude mice injected with the annexin V–Cy5.5 conjugate and surgically implanted with fluorescent tubes of known fluorochrome concentration. In these in vivo titration studies (data not shown here are included as a separate study in the supporting information, which is published on the PNAS web site) we observed a linear response of reconstructed concentration as a function of fluorochrome titration (≈5% linear accuracy for the 0–1,000-nM range), justifying the use of a single calibration factor for the fluorochrome range observed. It was also important to obtain this calibration in vivo because 20% inaccuracies were observed between calibrations obtained from phantoms vs. ones performed in vivo. To extract geometrical dimensions of the lesions reconstructed, a threshold was applied equal to 40% of the maximum value of each lesion reconstructed. This threshold was empirically determined from phantom measurements. Lesion volume was then calculated as the total volume occupied by voxels containing values above the threshold.
Phantoms. Phantoms simulating tissue were constructed to demonstrate tomographic feasibility, illuminate differences of planar imaging and tomographic imaging, and test quantification performance. An intralipid–India ink solution was used to simulate a diffuse medium with the optical properties of small animals (μa = 0.4 cm–1, μs′ = 6 cm–1) and characterized by time-resolved spectroscopy. Tumor-like heterogeneities were constructed by using 3-mm-diameter semitranslucent straws sealed at the lower end by a small plastic circular sheet and silicon. The tubes were filled with the same intralipid solution used for the background diffuse medium and positioned adjacent to the chamber window at a geometry reflecting the in vivo imaging of the two tumors. Different absorbing properties were simulated by adding additional amounts of India ink into the tubes, whereas fluorescent properties were induced by dilution of the Cy5.5 fluorochrome. Similar procedures were followed for the studies included in the supporting information.
Histology and Image Analysis. After imaging, animals were killed with pentobarbital (200 mg/kg i.p.). The tumors were excised, snap-frozen, and cut into sections, which were then divided into two groups in an interleaved manner. Two histological examinations were carried out for cross-validation. Sections were imaged for Cy5.5 distribution or stained for apoptosis by using a commercially available terminal deoxynucleotidyltransferase-mediated dUTP nick end labeling (TUNEL) method (ApopTag kit, Intergen, Purchase, NY). Some animals also received 200 μg/kg Lycopersicon esculentum (tomato) lectin labeled with Alexa 488 dye (Molecular Probes) to stain their microvasculature before killing.
Image analysis of histological slices consisted of preprocessing all images with two passes of 5 × 5 kernel median filtering followed by normalization of the image by setting the maximum value to 1 and the mean of the noise floor to zero. The images were converted to binary images by applying a threshold set to 0.5 for the fluorescence images and to 0.9 for the images obtained after tunnel staining. These thresholds were set after optimization on a set of images used for training and were identical for all the observations performed. The number of lesions (for TUNEL staining) were obtained from the binary images by using a labeling algorithm for objects that are larger than a single pixel with eight neighboring pixels clustering.
Results
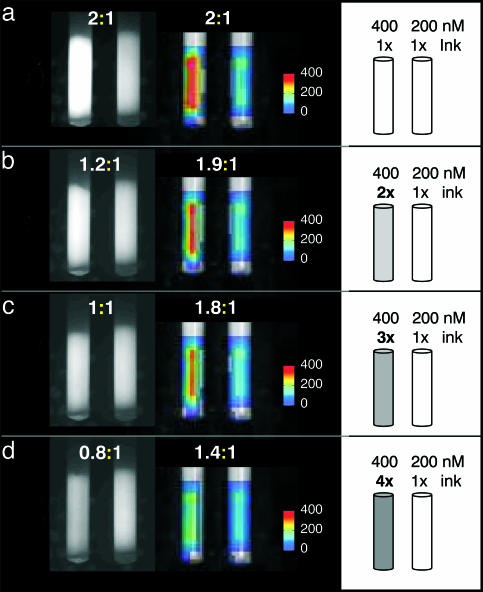
Tomographic validation relevant to the subsequent in vivo studies was performed with the phantom shown in Fig. 2. A superficial tube containing 400 nM Cy5.5 dye was immersed into a diffuse medium of animal-like properties, next to an identical tube of half the fluorescence concentration (200 nM). Originally, both tubes had optical properties identical to background, besides the Cy5.5 fluorochrome contained. Then India ink was added to the higher fluorescent tube at two, three, and four times the background concentration as schematically shown in the right column of Fig. 2. The planar and FMT results are shown in the left and middle columns, respectively. The ratios calculated from the imaging studies in each titration are also reported north of each corresponding image. The ink increasingly absorbs fluorescent photons as a function of titration, as seen on the planar images, which is misleading as to the actual fluorochrome contained in the tubes and yields significant underestimation. Conversely, FMT results are significantly more robust, more accurately reconstructing the fluorochrome concentration (<20% error up to the 3× titration).
Fig. 2.
Phantom study examining the relative appearance of planar and FMT images as a function of increasing absorption in the left of the two tubes shown. Experimental details are described in the text.
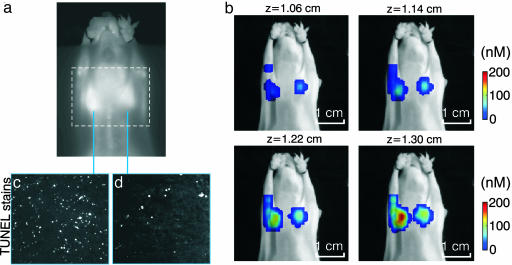
Fig. 3 depicts imaging from a treated animal injected with Cy5.51.1–annexin V (active probe). Fig. 3a shows the planar fluorescence imaging result superimposed with a dashed rectangle, indicating the field of view subsequently imaged by FMT. Fig. 3b shows four consecutive fluorescence slices of ≈0.8-mm thickness obtained from the 3D FMT set (total of 16 slices). The slices are shown in color and are registered onto the grayscale planar excitation light image of the mouse for visualization purposes. Very low background values (<10 nM) are not rendered to allow for the concurrent visualization of FMT results on the corresponding mouse planar image (photograph). FMT accurately resolved the two tumors and calculated higher fluorescence concentration in the LLC tumor than that shown in the planar image. This was consistent with the underlying higher apoptotic index as confirmed with TUNEL staining and histology of 10 interleaved slices throughout the tumor, a representative set of which is shown in Fig. 3 c and d.
Fig. 3.
Imaging apoptotic response in vivo. (a) Planar fluorescence image. (b) Four consecutive FMT slices (in color) superimposed on the planar image of the mouse obtained at the excitation wavelength. The bottom right slice is the one closer to the surface of the animal as seen in a, and successive slices are reconstructed from deeper in the animal. (c and d) TUNEL-stained histological slices from the sensitive LLC and resistant CR-LLC tumors.
In general, very little fluorescence was reconstructed deeper in the mouse where low-background apoptosis is expected in healthy tissues. This result can be seen in the supporting information, where the entire volume reconstructed for the mouse seen in Fig. 3 is shown by using a 10- and 0-nM visualization threshold. Some artifacts appear on the slices close to the source locations, congruent with source positions. This behavior is typical, possibly appearing because of noise and the unbalanced number of sources and detectors in this experimental setup; it could be reduced with more symmetric data sets and improvements in noise-handling and forward models.
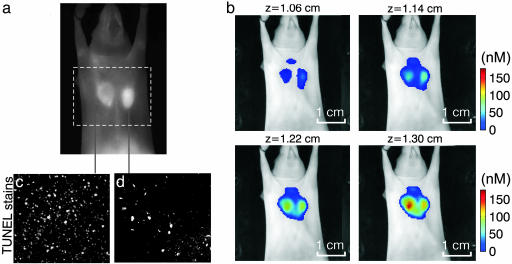
Although Fig. 3 depicts a typical finding in terms of FMT performance, planar imaging results varied throughout the study. A representative example of this variability is shown in Fig. 4, which has been added to demonstrate why FMT should be the method of choice when performing fluorescence investigations of whole animals or tissues. Fig. 4 is arranged similarly to Fig. 3, where a planar image is contrasted with four consecutive FMT slices superimposed on the excitation light planar image for orientation purposes. FMT images demonstrate appearance similar to the study in Fig. 3 where the sensitive tumor exhibits higher fluorochrome binding than the resistant tumor. Conversely, the planar image shows an ambiguous response with the resistant tumor, demonstrating slightly higher overall fluorescence intensity. At first, this result may appear controversial. However, it is known that fluorescence photons nonlinearly attenuate as a function of tumor depth and optical properties (29), as also demonstrated in Fig. 2. Therefore, changes in implantation depth and increased vascularization may contribute to unequal attenuation of fluorescent photons emanating from within the animal body. In contrast to planar imaging methods, FMT has significantly reduced sensitivity to background absorption fluctuations and also corrects for attenuation changes as a function of depth. Therefore, it could produce more accurate observations in in vivo measurements where high background heterogeneity is expected.
Fig. 4.
Second imaging example, showcasing advantages of FMT imaging compared with planar imaging. (a) Planar fluorescence image. (b) Four consecutive FMT slices (in color) superimposed on the planar image of the mouse obtained at the excitation wavelength. The bottom right slice is the one closer to the surface of the animal as seen in a, and successive slices are reconstructed from deeper in the animal. (c and d) TUNEL-stained histological slices from the sensitive LLC and resistant CR-LLC tumors.
To validate these findings, we performed correlative studies. TUNEL staining shown in Fig. 4 c and d depicted significantly higher apoptotic index for the sensitive tumor (≈2.3:1 ratio in this case as calculated from a total of 10 histological slices from each of the two tumors). Further correlation studies are presented in the supporting information and demonstrate that fluorescence microscopy at the Cy5.5 channel also reveals higher fluorochrome distribution for the LLC vs. CR-LLC tumor. This supporting information also shows that the LLC tumor appears “darker” than the CR-LLC on images obtained at the excitation wavelength indicating an area of higher absorption contained in the LLC tumor, which is congruent with the appearance of reduced fluorescence from the LLC tumor.
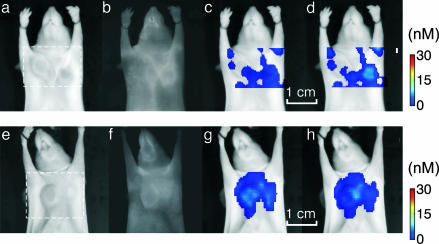
Fig. 5 depicts results from control studies performed to further examine the imaging capacity and detection specificity of the method. Fig. 5a demonstrates imaging results obtained from a mouse injected with the control, nonbinding Cy5.52.4–annexin V probe. Fig. 5a shows the result of planar imaging, and Fig. 5 b and c depicts two consecutive FMT slices that traverse the tumor plane and are obtained from the field of view indicated in Fig. 5a with a dashed line. Both imaging studies depict low-fluorescence signals, indicating that the fluorescence activity seen in Figs. 3 and 4 correlate with targeting and not with generic accumulation. Similarly, Fig. 5d shows planar and Fig. 5 e and f shows FMT imaging results from a nontreated mouse injected with the Cy5.51.1–annexin V, arranged respectively to those of Fig. 5 a–c. No significant fluorescence signals were observed in either planar or FMT images, showing that the background apoptosis in the tumors and elsewhere is low, compared with treatment-induced apoptosis. The complete reconstructed set is given in supporting information.
Fig. 5.
Control studies. (a–d) Imaging results from a treated animal injected with the nonbinding annexin V2.4-Cy5.5 probe. (a and e) Excitation light images. (b and f) Fluorescence images. (c and g) FMT slices, z = 1.22 cm. (d and h) FMT slices, z = 1.30 cm. Very little background fluorescence is shown in either planar (b) or FMT images (c and d) serving as a positive control for nonspecific accumulation. (f–h) Planar (f) and FMT (g and h) results from an untreated animal injected with the annexin V1.1-Cy5.5 probe. Slightly higher fluorescence is resolved than in b and c, especially for the CR-LLC tumor, as seen in the FMT images indicative of background apoptosis. Overall, the fluorescence activity resolved in control studies is 10-fold less than when imaging chemo-induced apoptosis.
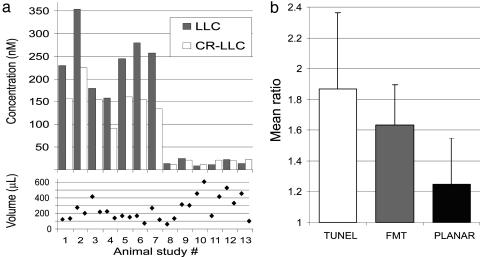
Fig. 6 summarizes the results from the FMT studies. Fig. 6a shows average fluorescence concentration from the LLC and CR-LLC tumors reconstructed, plotted per animal studied, and the corresponding volumes retrieved by FMT. Overall the concentration seen in control animals is ≈1 order of magnitude less than in the normal studies. The mean concentrations for the LLC and CR-LLC were 243 nM and 153 nM, respectively, whereas for the control studies the corresponding values were 16 nM and 17 nM, respectively. The average volumes reconstructed for LLC and CR-LLC were 277 μl and 224 μl, respectively. Fig. 6b summarizes the apoptotic or fluorescence ratios of the LLC over the CR-LLC tumors from the standard animals as observed by histology, FMT, and planar imaging. FMT appears in better agreement with TUNEL staining results than planar imaging results. The mean ratios calculated are 1.97 for TUNEL, 1.59 for FMT, and 1.24 for planar imaging.
Fig. 6.
Summary of results. (a) Mean concentration values (Upper) calculated for the LLC and CR-LLC tumors for the animals studied and corresponding volumes reconstructed (Lower). (b) Summary of apoptotic index ratio between LLC and CR-LLC calculated from volumetric TUNEL histological analysis from excised tumors (left column) and corresponding in vivo calculation of fluorescence ratios obtained with FMT (center column) and planar imaging (right column).
Discussion
The ability to noninvasively assess pharmacodynamics and early responses to treatment would broaden our understanding on the potential of a given therapeutic regimen and would allow more accurate prediction of treatment outcome. The goal of this work was to investigate the FMT capacity in resolving treatment in vivo and to perform a side-to-side comparison with planar imaging. In vivo studies demonstrated FMT capacity to visualize cell death and show detection specificity as concluded by the control studies. Figs. 2 and 4 further manifested the necessity of using tomographic techniques for true quantitative imaging even of superficial tissues. In Fig. 4, the cyclophosphamide-sensitive tumor exhibited higher light attenuation than the CR-LLC (evident also in the supporting information) corresponding to increased topical vascularization. Vascularization was also examined with histological studies of tomato lectin staining blood vessels and was found to be 1.3 times higher than the CR-LLC (results also included in the supporting information). These effects resulted in a weaker fluorescence appearance of the sensitive tumor on planar images, which did not correlate with the apoptotic index. Conversely, FMT used appropriate theoretical models to account for nonlinear light attenuation and absorption heterogeneity (12, 16), and it reduced sensitivity to heterogeneous intrinsic absorption, as also evidenced in Fig. 2. This outcome is achieved herein by normalizing the fluorescent data with measurements at the excitation wavelength as described in ref. 16, but other approaches that tomographically resolve images of intrinsic absorption and then use this information in the fluorescence tomography problem as apriori information could be used as well.
Overall, light attenuation in tissues depends nonlinearly on the medium's absorption, scattering coefficients, and propagation distance from a source to a detector (12). Therefore, planar illumination techniques appear linear when only the fluorochrome concentration changes locally, but they are strongly nonlinear for varying optical properties or as a function of lesion depth, yielding loss of image fidelity and possibly inaccurate conclusions. When performing studies where the optical properties or the location and size of the fluorescent lesion may change (for example, several tumor growth and treatment studies), it would be important to use appropriate photon propagation models and tomographic principles for (i) achieving superior quantification even at highly varying background optical heterogeneity and (ii) more accurately resolving depth and size information. The supporting information further shows that detection and resolution of two small fluorescent tubes (10 ml volume, 500 nM Cy5.5 concentration) becomes challenging even at 3 mm below the surface of diffuse phantoms, but it can be detected and well resolved with FMT even at the middle of 1.3 cm of diffuse media simulating the compressed thickness of a small animal. It has also been reported that FMT could image >10 cm deep in the breast and lung and 4–5 cm into muscle and brain (13). We note that the particular chamber design selected herein is the diffuse optical equivalent of x-ray tomosynthesis and offers significant implementation advantages and highly spatial sampling along the x–y axis, yielding submillimeter resolution (23). Similarly to tomosynthesis, however, it offers compromised resolution (≈2 mm) along the z axis. Appropriate theory for implementing highly spatial sampling measurements at 360° angles have been developed recently (27) and paved the way to CT-like illumination-detection schemes that could further advance the FMT imaging capacity.
FMT versatility is constantly growing with the corresponding increasing availability of novel biocompatible fluorescent probes with molecular specificity and technological advances toward improved imaging performance. Simultaneous imaging of many targets could be achieved by spectral decomposition of probes emitting at different wavelengths, and fluorochrome quantities of a few picomoles or less are detectable in the case of small animals (23, 30). Accurate localization of fluorescent lesions deep in living animals has been also demonstrated (21, 23, 28). Because of its operational safety, versatility, and cost efficiency, FMT could be the method of choice for bench-top quantitative optical imaging. An important limitation of the technology is the diffusive nature of photon propagation that limits the resolution offered and complicates inversion procedures compared with x-ray computed tomography. An additional limitation is that high background fluorescence may deteriorate imaging performance of the technology; therefore, highly specific targeting and appropriate background subtraction schemes are crucial for optimal operation. Currently, we are investigating high spatial sampling time-resolved technologies and more symmetrical illumination schemes for further improving imaging performance and reducing reconstruction artifacts. Clinical translation of this technology could probably begin by dedicating scanners to certain organs, such as the breast or head and neck tumors for which optical tomography has been shown feasible (31, 32); for more superficial structures, such as skin and cervix, or in endoscopy or in combination with high-resolution anatomical modalities such as MRI, CT, or ultrasound. Advanced handheld approaches with quantification capabilities could be also a viable approach in the near future as near-IR fluorescent probes become available for human use.
Supplementary Material
Acknowledgments
We thank Heung-Kook Choi, Andreas Yulliano, Alexander Petrovsky, Giannis Zacharakis, and Joshua Dunham for invaluable assistance with experiments and discussions. This work was supported in part by National Institute of Health Grants P50 CA 86355, RO1 EB 000750-1, R33 CA 91807, and T32 CA 79443.
This paper was submitted directly (Track II) to the PNAS office.
Abbreviations: FMT, fluorescence molecular tomography; LLC, Lewis lung carcinoma; CR-LLC, cyclophosphamide-resistant LLC; TUNEL, terminal deoxynucleotidyltransferase-mediated dUTP nick end labeling.
References
- 1.Herschman, H. R. (2003) Science 302, 605–608. [DOI] [PubMed] [Google Scholar]
- 2.Massoud, T. F. & Gambhir, S. S. (2003) Genes Dev. 17, 545–580. [DOI] [PubMed] [Google Scholar]
- 3.Blankenberg, F. G., Naumovski, L., Tait, J. F., Post, A. M. & Strauss, H. W. (2001) J. Nucl. Med. 42, 309–316. [PubMed] [Google Scholar]
- 4.Thompson, C. B. (1995) Science 267, 1456–1462. [DOI] [PubMed] [Google Scholar]
- 5.Brooks, P. C., Montgomery, A. M., Rosenfeld, M., Reisfeld, R. A., Hu, T., Klier, G. & Cheresh, D. A. (1994) Cell 79, 1157–1164. [DOI] [PubMed] [Google Scholar]
- 6.Laxman, B., Hall, D. E., Bhojani, M. S., Hamstra, D. A., Chenevert, T. L., Ross, B. D. & Rehemtulla, A. (2002) Proc. Natl. Acad. Sci. USA 99, 16551–16555. [DOI] [PMC free article] [PubMed] [Google Scholar]
- 7.Schellenberger, E., Bogdanov, A., Jr., Petrovsky, A., Ntziachristos, V., Weissleder, R. & Josephson, L. (2003) Neoplasia 5, 1–6. [DOI] [PMC free article] [PubMed] [Google Scholar]
- 8.Petrovsky, A., Schellenberger, E., Josephson, L., Weissleder, R. & Bogdanov, A., Jr. (2003) Cancer Res. 63, 1936–1942. [PubMed] [Google Scholar]
- 9.Bremer, C., Tung, C. & Weissleder, R. (2001) Nat. Med. 7, 743–748. [DOI] [PubMed] [Google Scholar]
- 10.Weissleder, R. & Ntziachristos, V. (2003) Nat. Med. 9, 123–128. [DOI] [PubMed] [Google Scholar]
- 11.Hawrysz, D. J. & Sevick-Muraca, E. M. (2000) Neoplasia 2, 388–417. [DOI] [PMC free article] [PubMed] [Google Scholar]
- 12.Arridge, S. R. (1999) Inverse Probl. 15, R41–R93. [Google Scholar]
- 13.Ntziachristos, V., Bremer, C. & Weissleder, R. (2003) Eur. J. Radiol. 13, 195–208. [DOI] [PubMed] [Google Scholar]
- 14.Chang, J. H., Graber, H. L. & Barbour, R. L. (1997) IEEE Trans. Biomed. Eng. 44, 810–822. [DOI] [PubMed] [Google Scholar]
- 15.Jiang, H. B., Ramesh, S. & Bartlett, M. (2000) Crit. Rev. Biomed. Eng. 28, 371–375. [DOI] [PubMed] [Google Scholar]
- 16.Ntziachristos, V. & Weissleder, R. (2001) Opt. Lett. 26, 893–895. [DOI] [PubMed] [Google Scholar]
- 17.Eppstein, M. J., Hawrysz, D. J., Godavarty, A. & Sevick-Muraca, E. M. (2002) Proc. Natl. Acad. Sci. USA 99, 9619–9624. [DOI] [PMC free article] [PubMed] [Google Scholar]
- 18.Milstein, A. B., Oh, S., Webb, K. J., Bouman, C. A., Zhang, Q., Boas, D. A. & Millane, R. P. (2003) Appl. Opt. 42, 3081–3094. [DOI] [PubMed] [Google Scholar]
- 19.Ntziachristos, V., Ripoll, J. & Weissleder, R. (2002) Opt. Lett. 27, 333–335. [DOI] [PubMed] [Google Scholar]
- 20.Godavarty, A., Eppstein, M. J., Zhang, C. Y., Theru, S., Thompson, A. B., Gurfinkel, M. & Sevick-Muraca, E. M. (2003) Phys. Med. Biol. 48, 1701–1720. [DOI] [PubMed] [Google Scholar]
- 21.Ntziachristos, V., Tung, C., Bremer, C. & Weissleder, R. (2002) Nat. Med. 8, 757–760. [DOI] [PubMed] [Google Scholar]
- 22.Graves, E., Culver, J., Ripoll, J., Weissleder, R. & Ntziachristos, V. (2003) J. Opt. Soc. Am. A 21, 231–241. [DOI] [PubMed] [Google Scholar]
- 23.Graves, E., Ripoll, J., Weissleder, R. & Ntziachristos, V. (2003) Med. Phys. 30, 901–911. [DOI] [PubMed] [Google Scholar]
- 24.Culver, J., Choe, R., Holboke, M., Zubkov, L., Durduran, T., Slemp, A., Ntziachristos, V., Chance, B. & Yodh, A. (2003) Med. Phys. 30, 235–247. [DOI] [PubMed] [Google Scholar]
- 25.Pogue, B. W., Gibbs, S. L., Chen, B. & Savellano, M. (2004) Technol. Cancer Res. Treat. 3, 15–21. [DOI] [PubMed] [Google Scholar]
- 26.Schellenberger, E. A., Weissleder, R. & Josephson, L. (2004) Chembiochem 5, 271–274. [DOI] [PubMed] [Google Scholar]
- 27.Ripoll, J., Schultz, R. & Ntziachristos, V. (2003) Phys. Rev. Lett. 91, 103901-1-4. [DOI] [PubMed] [Google Scholar]
- 28.Schultz, R., Ripoll, J. & Ntziachristos, V. (2003) Opt. Lett. 28, 1701–1703. [DOI] [PubMed] [Google Scholar]
- 29.Yodh, A. G. & Chance, B. (1995) Phys. Today 48, 34–40. [Google Scholar]
- 30.Ntziachristos, V. & Weissleder, R. (2002) Med. Phys. 29, 803–809. [DOI] [PubMed] [Google Scholar]
- 31.Ntziachristos, V., Yodh, A. G., Schnall, M. & Chance, B. (2000) Proc. Natl. Acad. Sci. USA 97, 2767–2772. [DOI] [PMC free article] [PubMed] [Google Scholar]
- 32.Pogue, B. W., Poplack, S. P., McBride, T. O., Wells, W. A., Osterman, K. S., Osterberg, U. L. & Paulsen, K. D. (2001) Radiology 218, 261–266. [DOI] [PubMed] [Google Scholar]
Associated Data
This section collects any data citations, data availability statements, or supplementary materials included in this article.


