This work presents a new automated, image-guided patch-clamp system for brain slices. We have developed novel computer vision-based algorithms of user-independent identification of patch pipettes and fluorescently labeled neurons. Our system integrates all steps of the patch-clamp process: image acquisition through a microscope, automated identification of patch pipettes and fluorescently labeled neurons, micromanipulator control, and automated patching. This innovation allows robust, reproducible patch clamp with higher success rate and decreased trial duration compared with manual patching.
Keywords: patch-clamp, computer vision, fluorescent cell detection, in vitro slice electrophysiology
Abstract
Patch clamp is the main technique for measuring electrical properties of individual cells. Since its discovery in 1976 by Neher and Sakmann, patch clamp has been instrumental in broadening our understanding of the fundamental properties of ion channels and synapses in neurons. The conventional patch-clamp method requires manual, precise positioning of a glass micropipette against the cell membrane of a visually identified target neuron. Subsequently, a tight “gigaseal” connection between the pipette and the cell membrane is established, and suction is applied to establish the whole cell patch configuration to perform electrophysiological recordings. This procedure is repeated manually for each individual cell, making it labor intensive and time consuming. In this article we describe the development of a new automatic patch-clamp system for brain slices, which integrates all steps of the patch-clamp process: image acquisition through a microscope, computer vision-based identification of a patch pipette and fluorescently labeled neurons, micromanipulator control, and automated patching. We validated our system in brain slices from wild-type and transgenic mice expressing channelrhodopsin 2 under the Thy1 promoter (line 18) or injected with a herpes simplex virus-expressing archaerhodopsin, ArchT. Our computer vision-based algorithm makes the fluorescent cell detection and targeting user independent. Compared with manual patching, our system is superior in both success rate and average trial duration. It provides more reliable trial-to-trial control of the patching process and improves reproducibility of experiments.
NEW & NOTEWORTHY
This work presents a new automated, image-guided patch-clamp system for brain slices. We have developed novel computer vision-based algorithms of user-independent identification of patch pipettes and fluorescently labeled neurons. Our system integrates all steps of the patch-clamp process: image acquisition through a microscope, automated identification of patch pipettes and fluorescently labeled neurons, micromanipulator control, and automated patching. This innovation allows robust, reproducible patch clamp with higher success rate and decreased trial duration compared with manual patching.
patch-clamp recording is a gold-standard technique for accurate measurement of membrane voltage fluctuations, synaptic currents, and ionic channel activity in neurons (Neher and Sakmann 1976). It has allowed neuroscientists to study properties of individual ion channels (Hoshi et al. 1990) and synapses (Edwards et al. 1990) and to characterize synaptic plasticity (Jaffe and Johnston 1990; Zalutsky and Nicoll 1990) and dendritic integration (Larkum et al. 1999). Patch-clamp recording also has been essential for dissecting the pathophysiology of neurological disorders caused by mutations in channels and synaptic proteins (Ackerman and Clapham 1997). In combination with morphological characterization, this method has been used for classifying cell types in the brain (Kawaguchi and Kubota 1993) and elucidating connectivity among nearby neurons (Markram et al. 1997). It also has been successfully coupled with optogenetics (Boyden et al. 2005) and applied to map long-range neuronal circuits (Petreanu et al. 2007).
There is a growing demand for large data sets of patch-clamp recordings and morphological reconstructions. For example, large-scale cell-type classification of neurons based on electrophysiology and morphology as well as the study of their synaptic connections are some of the highest-priority goals in modern neuroscience (Alivisatos 2012, 2013; Insel et al. 2013; Jiang et al. 2015; Kandel et al. 2013). However, patch-clamp recording of a large number of neurons has limitations: it is a challenging, laborious technique, akin to an art form, requiring a skilled and highly trained investigator. It is also low throughput: even the most skilled and experienced patch-clamp investigators can only record from a few neurons per day.
A typical patch-clamp experiment is highly repetitive, making it strenuous and error prone for the investigator. For example, when the micropipette is being advanced toward the target cell, errors such as advancing the pipette too far into the tissue, breaking the pipette tip, and improperly setting the pipette pressure are common among novices and occasional among experienced researchers. Furthermore, these errors usually accumulate toward the end of the day when researchers get fatigued. Some steps of the patch-clamp process are difficult to control manually. For example, the delicate pneumatic pressure changes applied to the pipette are necessary to form a whole cell configuration. This pressure control is typically performed by mouth or with a syringe (Boulton et al. 1995; Walz 2007), making it difficult to replicate among laboratories, among different investigators in the same laboratory, and even by the same researcher. Consequently, wide variability in manual patch-clamp methodology creates challenges when large data sets collected by various laboratories for a single study must be directly comparable (Tripathy et al. 2015). Furthermore, when multiple cells must be patched simultaneously or when patch clamping must be integrated with other techniques such as optogenetics, the compounded complexity of the procedure could prohibit new investigators from initiating such projects. Thus there is a need to automate the patch-clamp process and minimize human involvement in its technical aspects.
Some of the currently available open-source and commercial software packages attempt to make some parts of the process more convenient (Campagnola et al. 2014; Edelstein et al. 2010; Long et al. 2015; Perin and Markram 2013; Suter et al. 2010). However, there is no comprehensive free and open-source solution that automates the patch-clamp procedure in vitro. We previously developed and tested the “Autopatcher,” a robot for automated “blind” patch-clamp recording in vivo (Kodandaramaiah et al. 2012). The Autopatcher was designed to use only electrical resistance, not visual information, as an indicator of cell proximity. However, in brain slice preparations, targeting cells on the basis of visual cues such as the shape or fluorescence of a cell is often required (Komai et al. 2006; Lefort et al. 2009). Currently, no automation software exists to assist in the performance of such visually guided patch-clamp experiments in tissue.
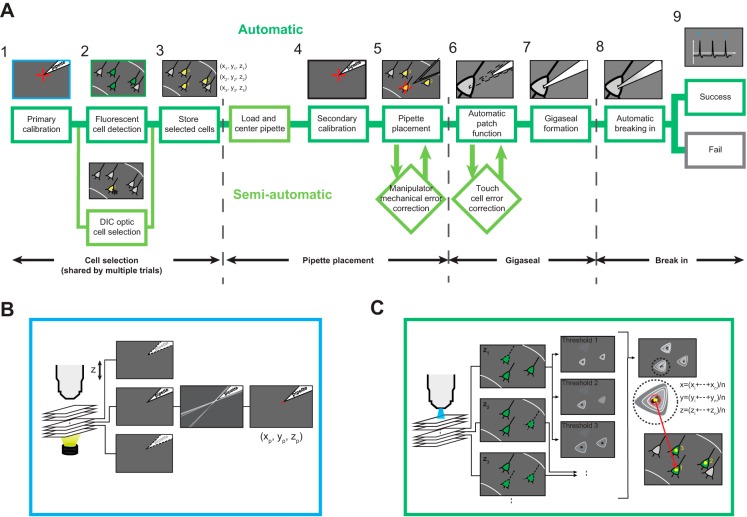
We have developed the Autopatcher IG (“Image Guided”), a system that enables a conventional electrophysiology rig to automatically perform patch-clamp electrophysiology in vitro. The system reduces the need for manual intervention by automating highly skilled but repetitive tasks in the patch-clamp process (Fig. 1A). This is accomplished by automation of pipette calibration (Fig. 1B), fluorescent cell detection (Fig. 1C), manipulator trajectory planning and execution, pneumatic pressure control, electrophysiological measurements, and data logging (Fig. 1). We have validated the performance of the Autopatcher IG by performing patch-clamp recordings of over 200 cells in mouse brain slices from wild-type, transgenic, and virally injected mice. The Autopatcher IG demonstrated robust performance, reproducibility, and twofold improvement in speed and likelihood of obtaining a successful recording compared with manual patching.
Fig. 1.
Automated image-guided in vitro patch-clamp workflow. A: steps in an automated in vitro patch-clamp experiment. 1, Primary calibration is done automatically through computer vision (also see B). 2, Target cell selection is then done using either mouse clicks (bottom) or automatic fluorescent cell detection (top; algorithm explained in detail in C). 3, Selected cell coordinates are stored for further patching (subscripts indicate the cell identification no.). 4, This is followed by a pipette calibration step that determines the coordinates of the patch pipette with micrometer-scale accuracy and resolution (indicated by red crosshairs). 5, With the coordinates of the pipette tip and target neuron determined, a pipette guidance algorithm determines the trajectory to be taken by the pipette and automatically guides the pipette to the targeted cells. 6–8, The patch algorithm (also see Fig. 6 for detailed algorithm flowchart) is then initiated, which uses pipette impedance measurements to detect contact with the neuron (6), form a gigaseal (7), and break in (8). 9, After successful break-in, a whole cell recording is performed. A fully automatic patching process is defined as the successful automatic execution of all steps from loading a new pipette to obtaining a whole cell patch (marked by dark green lines). If adjustments are to be made at any point to this automatic process, it is defined as a semiautomatic patching trial (marked by light green lines). Such adjustments are mainly manipulator mechanical error correction, caused by mechanical errors in manipulator positioning, and touch cell error correction, caused by incorrect cell contact detection. Dark green borders indicate fully automatic procedure; light green borders indicate a semiautomatic trial, involving at least some human interference. DIC, differential interference contrast. B: computer vision algorithm is used to determine the coordinates of the pipette tip during automatic calibration. A series of images along the optical z-axis are acquired under bright-field illumination to determine if the pipette tip is in focus using local contrast detection. Gaussian blur, Canny edge detection, and Hough transform are then applied to identify the pipette tip (indicated by red dot), and the tip coordinates are identified (xp, yp, zp; also see Fig. 4A). C: computer vision algorithm used to detect and log coordinates of fluorescent cells. A series of images are acquired under epifluorescence illumination along the optical z-axis of the microscope (left), with the step size and the depth defined by an experimenter. Each acquired image at depth zn is analyzed using a series of thresholds to detect cell contours. The centroids of the identified cell contours for each threshold are superimposed and clustered along the x and y dimensions. Final cell coordinates are computed as the average of the corresponding x, y, z cluster coordinates.
MATERIALS AND METHODS
Animals.
All animal procedures were approved by the Committee on Animal Care at the Allen Institute for Brain Science, the Massachusetts Institute of Technology, and the Purdue Animal Care and Use Committee. Both male and female animals were used in acute brain slice preparation. C57BL/6 (wild type) mice were used in all experiments except for testing fluorescent cell detection and patching algorithm. A stable mouse line expressing channelrhodopsin 2 (ChR2) fused with enhanced yellow fluorescent protein (EYFP) under Thy1 promotor, B6.Cg-Tg(Thy1-COP4/EYFP)18Gfng/J (Thy1-ChR2-EYFP line 18), was purchased from Jackson Laboratory (Arenkiel et al. 2007).
Acute mouse cortical slice preparation.
Visual cortical slices from young (postnatal day 21–50; P21–P50) mice were prepared as described previously (Philpot et al. 2001). Mice were anesthetized with isoflurane and decapitated after confirmation of deep anesthesia using tests of corneal reflex and toe pinch. The brain was removed and sliced with the use of a vibrating-blade microtome (Leica Microsystems, Buffalo Grove, IL) in an ice-cold, oxygenated, high-sucrose dissection buffer containing (in mM) 75 sucrose, 10 glucose, 87 NaCl, 2.5 KCl, 1.25 NaH2PO4, 25 NaHCO3, 0.5 CaCl2, 7 MgCl2, and 1.3 ascorbic acid. Coronal slices (350 μm) containing primary visual cortex were incubated at 32°C for 15 min in a holding chamber with oxygenated artificial cerebrospinal fluid (ACSF) containing (in mM) 124 NaCl, 3.5 KCl, 1 CaCl2, 0.8 MgCl2, 1.23 NaH2PO4, 26 NaHCO3, and 10 glucose, and were subsequently incubated at 30°C for the remainder of the day.
Acute brain slices were prepared from adult (P50–P180) mice using the protective recovery method described in detail elsewhere (Ting et al. 2014). Briefly, animals were heavily anesthetized with isoflurane and perfused transcardially with N-methyl-d-glucamine (NMDG) solution containing (in mM) 93 NMDG, 2.5 KCl, 1.2 NaH2PO4, 30 NaHCO3, 20 HEPES, 25 glucose, 5 Na-ascorbate, 3 Na-pyruvate, 10 MgSO4·7H2O, and 0.5 CaCl2·2H2O (pH titrated to 7.3–7.4, osmolarity 300–310 mosM). Mice were quickly decapitated, and the brain was extracted, embedded in 2% agarose, and cut into 300-μm coronal slices in the cutting solution using a VF200 compresstome (Precisionary Instruments). The slices were incubated at 34°C in the cutting solution for 10–12 min. They were then transferred to a recovery solution containing (in mM) 92 NaCl, 2.5 KCl, 1.2 NaH2PO4, 30 NaHCO3, 20 HEPES, 25 glucose, 5 Na-ascorbate, 2 thiourea, 3 Na-pyruvate, 2 MgSO4·7H2O, and 2 CaCl2·2H2O (pH 7.3–7.4, osmolarity 300–310 mosM) for at least 60 min before recording began. Recordings were performed at room temperature (25°C) in an open bath chamber (RC-29; Warner Instruments) with standard recording solution containing (in mM) 124 NaCl, 2.5 KCl, 1.2 NaH2PO4, 24 NaHCO3, 5 HEPES, 12.5 glucose, 2 MgSO4·7H2O, and 2 CaCl2·2H2O. The liquid junction potential was not corrected.
Electrophysiology recordings.
In both preparations, patch-clamp electrodes were pulled from filamented borosilicate glass tubes (BF150-86-10; Sutter Instruments) with the use of a P-97 micropipette puller (Sutter Instruments) to a resistance of 3.5–7.9 MΩ. Internal solution contained (in mM) 20 KCl, 100 K-gluconate, 10 HEPES, 4 MgATP, 0.3 Na2GTP, 7 phosphocreatine, and 0.2% biocytin (pH adjusted to 7.4, osmolarity adjusted to 300 mosM). In some experiments, 4% (wt/vol) Alexa Fluor 594 (A-10438; Life Technologies) or Lucifer yellow (L-453; Life Technologies) was added to the intracellular solution to visualize patch-clamped cells under fluorescent optics. Cell characteristics were obtained 5 min after a successful break-in using Clampex. The algorithm is considered to yield a successful whole cell recording if access resistance is less than 80 MΩ and holding current at −70 mV is larger than −200 pA.
All data are reported as means ± SE. A two-tailed Student's t-test was used to compare between groups, and P < 0.05 is considered significant.
Cell labeling with fluorescent dye.
A glass pipette (with filament) was back-filled with 5 mM Alexa Fluor 568 in 5 mM KCl by contacting the back of the glass pipette (opposite side of the tip) with the dye solution such that a small volume of the dye solution filled the tip of the pipette by capillary force. The pipette was then back-filled with internal solution. The patch-clamp experiment was performed as described, and the cell was held for at least 30 min after whole cell configuration was formed to allow the dye to diffuse into the projections.
Immunohistochemistry and imaging.
Acute brain slices were fixed in 4% paraformaldehyde solution for 30 min at room temperature, washed with PBS three times over 1 h, and subjected to antibody labeling or directly mounted for imaging. We used chicken anti-green fluorescent protein (anti-GFP; ab13970; Abcam) diluted 1:1,000 in PBS with 5% bovine serum albumin and 0.1% Triton X-100 overnight at 4°C to label channelrhodopsin-EYFP. Slices were washed in PBS three times over 1 h and incubated with goat anti-chicken Alexa 488 (A-11039: Thermal Fisher) overnight at 4°C in the same buffer used for primary antibody labeling. Slices were then washed and mounted for imaging with confocal scanning microscopy (Zeiss LSM710).
Viral injection surgery.
ArchT-EYFP was cloned into the herpes simplex virus (HSV) amplicon vector p1006, under the control of the murine cytomegalovirus (mCMV) promoter. It was packaged using the standard amplicon packaging protocol. The titer was 3 × 10⁸ infectious units (i.u.)/ml. C57BL/6 (wild type) mice ages P16–P25 were used to inject HSV-ArchT-EYFP in the primary visual cortex. Animals were initially anesthetized with 5% isoflurane and 1.5% during the surgery. The surgical site was shaved and disinfected with 75% ethanol. The skin above the visual cortex was surgically removed, and connective tissue was removed with 3% hydrogen peroxide. Four craniotomies (2 per hemisphere) at the primary visual cortex (coordinates determined by mouse brain atlas) were carefully drilled by a robotic rodent stereotactic surgery system (Neurostar). Virus (500 nl) was injected to each site at a 0.6-mm depth over a period spanning 10 min. The surgical site was sealed locally with Kwik-Cast sealant (WPI), and then the skull was sealed with dental cement (Ortho-Jet; Lang Dental). Animals recovered for 2–3 days before preparation of acute cortical slices reparation to allow optimum protein expression. The same procedure was then performed to prepare acute brain slices as described above.
Pressure control unit parts.
Parts used to construct the pressure control unit are as follows: a secondary data acquisition board (USB-1208FS; Measurement Computing, Norton, MA), solenoid valves (LHDA0531115H; The Lee Company), an air pump (VMP1625MX-12-90-CH mini-pump; Virtual Industries), and an air pressure sensor (MPXV7025G; Freescale Semiconductor).
RESULTS
Hardware.
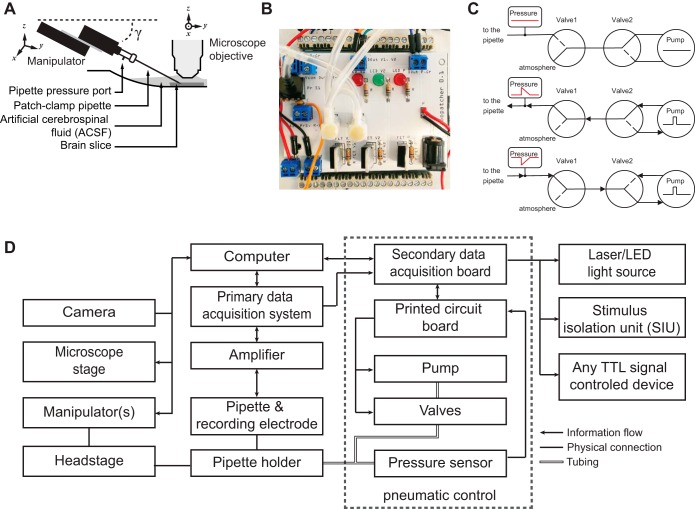
The Autopatcher IG utilizes off-the-shelf patch-clamp in vitro electrophysiology hardware. The setup is based on an upright microscope outfitted with differential interference contrast (DIC) optics. Brain slices are visualized using low-magnification (×4/×10) and high-magnification (×40/×60) water-immersion objectives that can be exchanged manually using a swinging nosepiece or automatically using a motorized carriage. Image guidance is accomplished by interfacing with a charge-coupled device (CCD) camera (QImaging). The Autopatcher IG relies on motorized three-axis control of the microscope stage and the patch-clamp pipette micromanipulator (Scientifica SliceScope Pro 1,000; Scientifica). A pipette holder is connected to the headstage of a patch-clamp amplifier (Multiclamp 700B). The headstage is mounted on the pipette manipulator (Fig. 2A). A data acquisition system (Digidata 1550A; Molecular Devices) relays the electrical signal from the amplifier to the computer for processing and storage (Fig. 2). Autopatcher IG also can be implemented to hardware systems different from that described above with driver programming.
Fig. 2.
Experimental setup. A: standard patch-clamp electrophysiology equipment is used in conjunction with a pneumatic pressure control unit (also see Fig. 3) and our custom-written software. B: image of the pipette pneumatic pressure control unit prototype. Two solenoid valves (white circles, center) and an air pressure sensor (black square, top left) are connected to control the pipette internal pressure. The air pump is not shown. C: 3 different valve configurations resulting in no pressure (top) or brief pulses of positive (middle) or negative pressure (bottom) applied to the back end of the pipette when the pump is activated by a transistor-transistor logic (TTL) signal. The pressure sensor provides feedback information to control the minimum and maximum pressure during patching. D: block diagram of the hardware setup. A central computer controls all components of the Autopatcher IG. The primary data acquisition system provides an interface to the patch-clamp amplifier and allows the user to perform a standard electrophysiology experiment. The secondary data acquisition board provides an interface to the pressure control unit and to the external electronics hardware, which can communicate via TTL signals. On the sensor side are signals from the patch pipette, microscope camera, and internal pipette pressure sensor. The custom graphical user interface (GUI; see Fig. 3) allows the user to control the manipulator, camera setting, microscope stage, pressure control unit, and patch-clamp amplifier [via software development kits (SDK) for digital amplifiers (Axon MultiClamp 700B)].
The only additional hardware component that is necessary for the Autopatcher IG is a custom-built pipette pneumatic pressure control unit (Fig. 2, B and C). Pneumatic pressure in the pipette is sensed and algorithmically controlled by interfacing with a secondary data acquisition board (USB-1208FS; Measurement Computing) that controls a series of valves, an air pump, and an air pressure sensor. Alternatively, we also have adopted the Autopatcher IG to utilize a commercially available patch-clamp pressure control system (Autopatcher pressure control box; Neuromatic Devices, Atlanta, GA).
Software architecture and graphical user interface.
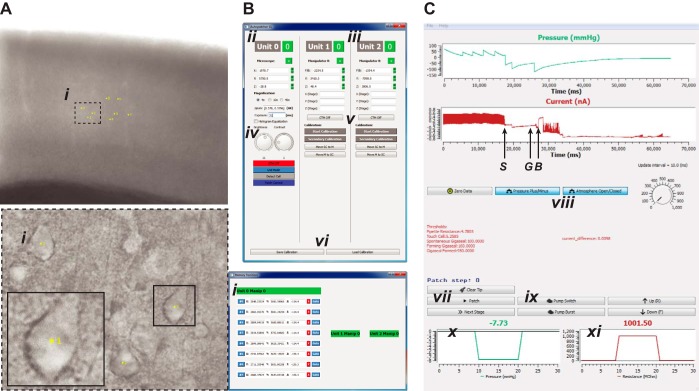
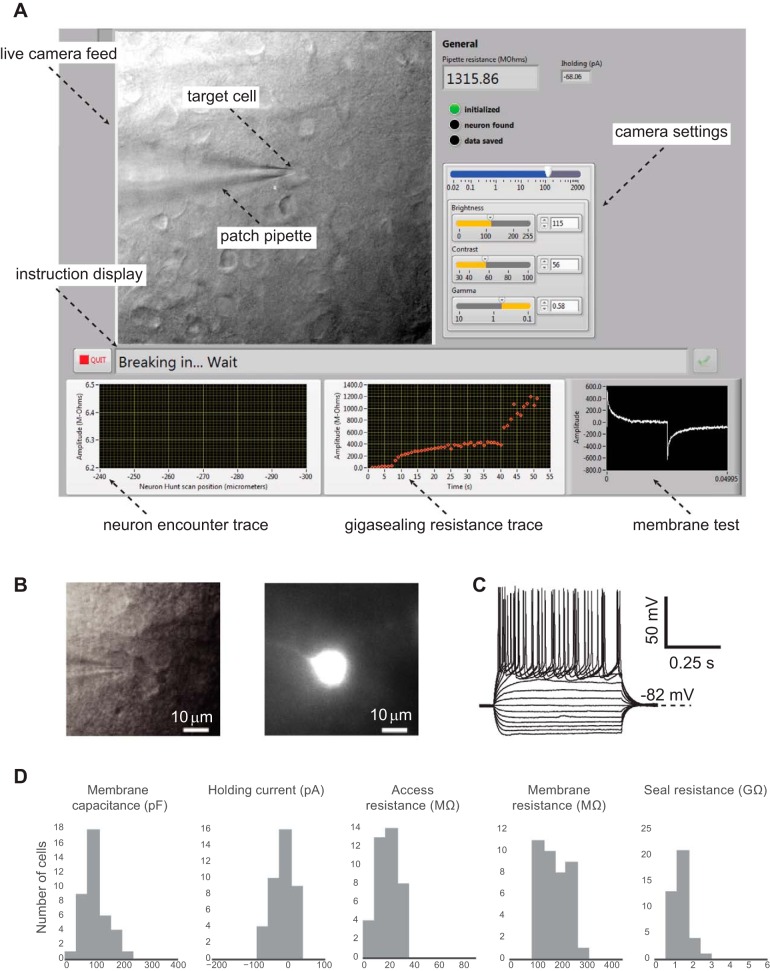
Autopatcher IG is organized modularly with the capability of easy functional expansion. Different modules communicate with each other through the main module and can run independently. The software is written in Python, a free and open-source programming language, using free and open-source libraries, such as the graphical user interface (GUI) PyQt (Riverbank Computing), which provides a Python interface to a popular open-source cross-platform GUI library, Qt (https://www.qt.io/), and OpenCV, an open-source computer vision library (Bradski 2000) (Fig. 3). Autopatcher IG software, user manual, tutorials, and an alternative implementation in LabVIEW (Fig. 4) are available online (www.autopatcher.org or https://github.com/chubykin/AutoPatcher_IG).
Fig. 3.
GUIs of the Python-based software featuring image acquisition, manipulator, and patch control. A: camera view of a brain slice with target cells (i) selected at a low magnification of ×4 (top) and at a high magnification of ×40 (bottom left). Yellow labels indicate the cell no.; coordinates of the cells are stored as the corresponding sequence of memory positions and indicated in the GUI (bottom right) B: main GUI providing settings for image acquisition, microscope stage, and micromanipulator control. ii, Microscope stage: controls include settings for stage coordinates, magnification, pixel-μm calibration; iii, micromanipulators: user can initiate automatic calibration and control individual micromanipulators; additional micromanipulator units are automatically recognized and added; iv, controls for camera exposure (in ms), image brightness, and contrast; v, automatic pipette calibration; vi, calibration save and load. C: patch control GUI during an ongoing patching experiment. Top trace indicates pressure (in mmHg); bottom trace indicates current measurements from the patch amplifier (letters denote key events in the patch-clamping process: S denotes the touch cell surface event, G denotes the time point at which a gigaseal is obtained, and B denotes when break-in is achieved). vii, Automatic patch algorithm; viii, independent valve configuration control: allows user to override the patch algorithm and manually apply user-required positive or suction pressure; ix, independent pump control: allows user to override the patch algorithm and control the pump; x, real-time pressure; xi, real-time resistance.
Fig. 4.
LabVIEW GUI, representative patch, and cell property statistics. A: LabVIEW-based GUI. B: a representative patched mouse neuron was filled with Alexa Fluor 594 and imaged at ×40 magnification. C: current-clamp recording of the same neuron in B shows response to a series of step current injections (−120 to +180 pA in 20-pA increments). D: measured properties of whole cell patches (n = 39 from 12 animals) are similar to properties determined by manual patching or automatic patching using a Python-based package.
Computer vision-aided pipette tip calibration.
A preliminary step to using the Autopatcher IG is manipulator primary calibration, which allows the software to manipulate the stage and pipette from the same reference coordinate system. It is performed once during initial setup and at any time the hardware configuration is changed. In the calibration process, the manipulator will move predefined distances along the x-, y-, and z-axes, and the position of the pipette tip will be identified using a computer vision algorithm after each movement as described in Fig. 5. A secondary calibration realigns the two coordinate systems by detecting the pipette tip and then applying transformation coefficients that were obtained from the primary calibration. Secondary calibration is performed every time a new pipette is installed.
Fig. 5.
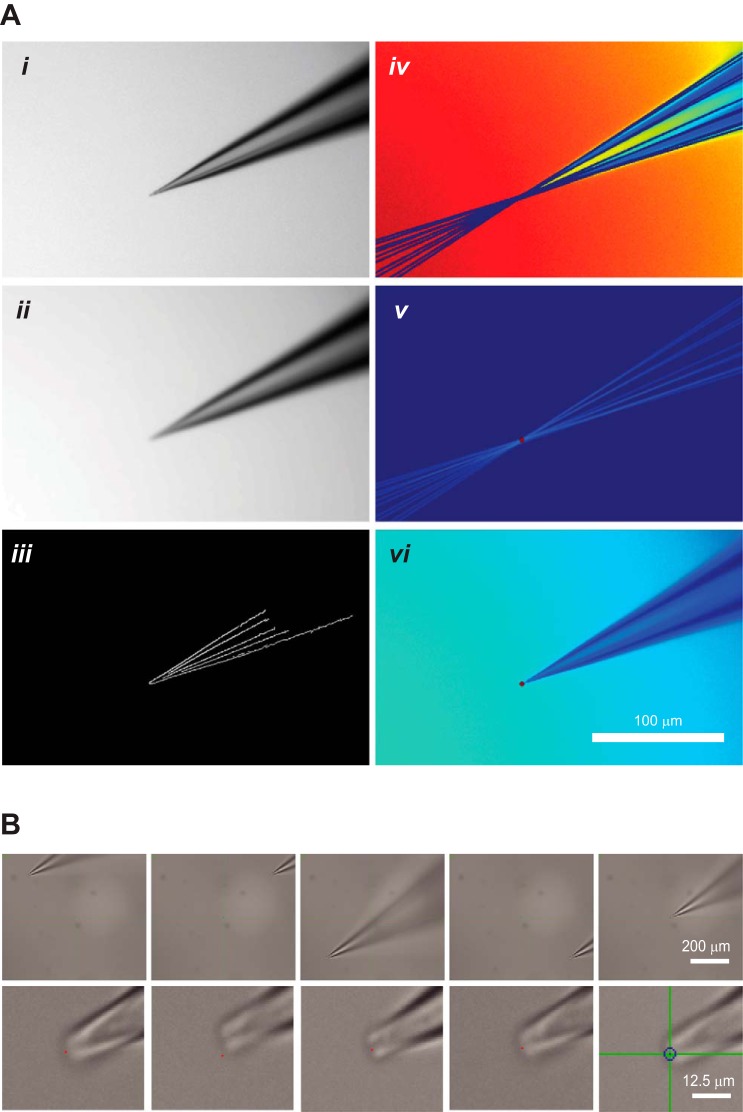
Computer vision-aided identification of the pipette tip coordinates. A: image acquisition and pipette tip detection. i, Original pipette image acquired by the microscope; ii, image after application of Gaussian blur; iii, Canny edge detection algorithm applied to the image in ii defines the contours of the pipette tip; iv, Hough transform performs feature extraction to fit the pipette contours with lines; v, color inversion and intensity calculation are used to detect the lines' point of intersection; vi, pipette tip detected by the algorithm as indicated by red dot. B: automatic pipette calibration achieves high precision. To test the precision of automatic pipette calibration, a predefined calibration grid was used and the pipette tip was then targeted to the centroids of four quadrants and the screen center. Top row shows the relative location of the pipette on the screen at ×4 magnification; bottom row shows the precision of the pipette placement at ×40 magnification. Red dots are 1 pixel in size and are the target locations.
In the automatic patching experiments we performed, each image after manipulator movement along the specific axis was subjected to Gaussian blur to decrease noise, the result of which was then used to extract pipette contour through Canny edge detection. Hough transform was subsequently applied to derive perfect lines fitting the pipette contour, which were then color inverted. The brightest point indicated where most of the pipette outlines intersected. The coordinates of this intersection point were assigned as the tip of the pipette (as shown in Fig. 5A). Such image processing was carried out twice on each image; the first iteration narrowed the detection range to a small cropped image near the tentative pipette tip, and the second iteration determined the final pipette tip coordinate. The reason for dual processing was to take into account changes in the angle of the pipette wall at different distances from the tip caused by the varying shapes of the pipettes prepared with the use of different pulling programs. For calibration along the z-axis, a focus detection algorithm was applied to derive the third pipette tip coordinate. The primary calibration process was performed only when the angles of the manipulator setup were changed. The secondary calibration process was performed each time a new pipette was installed and positioned within the visual field.
Automatic pipette tip calibration together with manual new pipette installation and positioning within the visual field took on average about 68 ± 6 s (mean ± SE; n = 10 trials), the average positioning error was 1.6 ± 0.215 μm when the pipette traveling distance was within a 200-μm radius after calibration (Fig. 5B). In addition, all of the automatic patching experiments described used the same primary calibration coefficients, which were saved and reloaded each day. There was no observable deterioration in performance, given that our hardware setup was stable (the angle and magnitude of manipulator movement relative to the microscope view did not change).
After the manipulator/pipette calibration was performed, the trajectory of the pipette could be controlled by using memory positions stored as target coordinates or by using a keyboard or a mouse to direct positioning. The automatic patching experiments described in this article used memorized target cell coordinates to direct both microscope and pipette to the target cell. After calibration, the pipette did not need to be located within the microscope view for targeting and positioning.
Automatic patching algorithm.
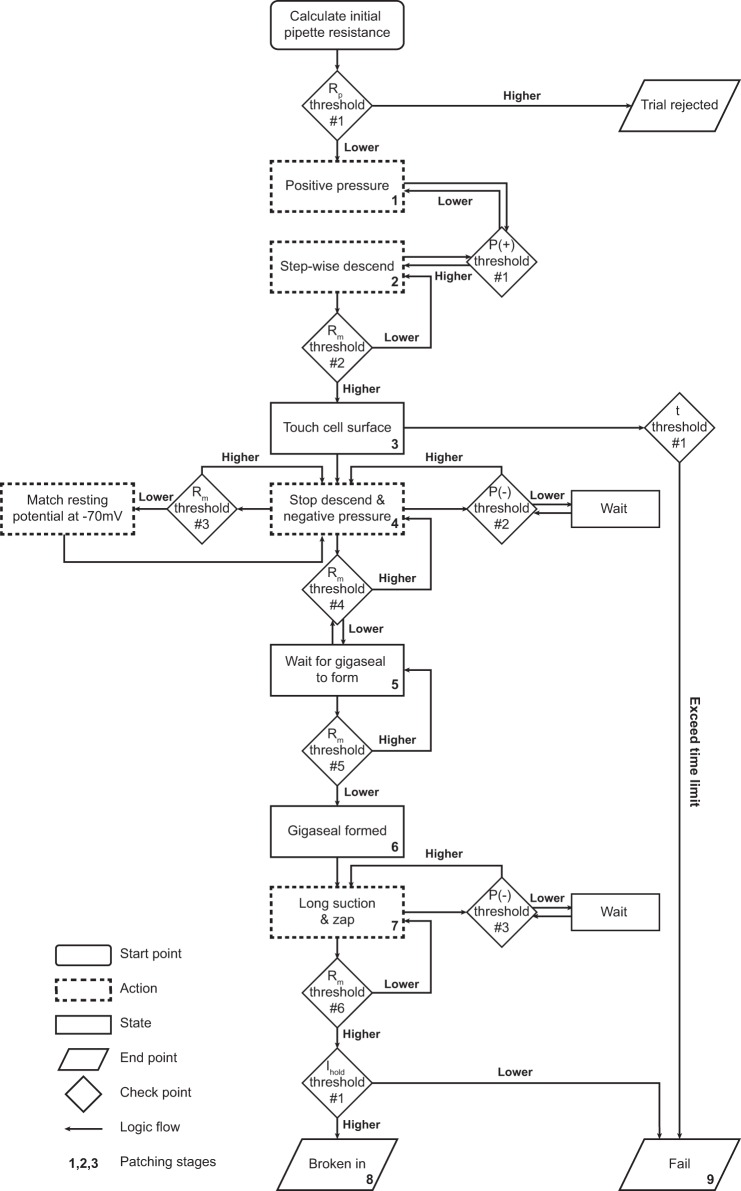
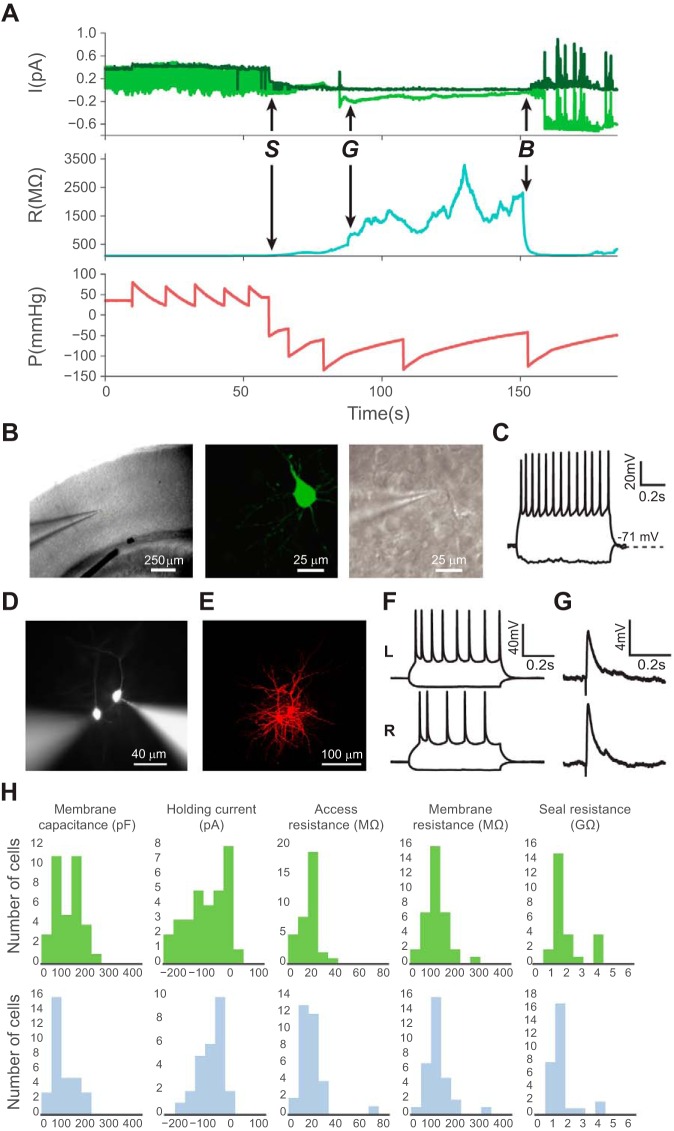
Gigaseal formation and break-in are automated by Autopatcher IG through the “Patch Control” module. After a cell is selected and a patch trial initiated, the pipette moves to the target coordinates offset by a user-defined “final approach” distance (10 μm, but can be changed by the user). The user can choose to approach the cell either along the shortest trajectory or vertically along the z-axis; all results shown were acquired using a vertical approach. Upon reaching the final approach distance, the manipulator starts descending in predefined step size (1 μm, but can be changed by the user) while the system is monitoring the resistance change calculated from membrane test current injection. Nine distinct stages are defined in the patching process, and the transitions between these stages are determined by a series of pipette resistance and pressure threshold configurations that can be changed and updated at any time point (Fig. 6, Table 1). A small positive pressure (35–60 mmHg by default) in the glass pipette is maintained through a pump-pressure sensor feedback loop. When the resistance has increased over the threshold (15% increase from initial pipette resistance by default), manipulator descent is stopped and the valve configuration is switched to apply negative pressure to the pipette to facilitate formation of a gigaseal. The Patch Control applies negative pressure pulses (starting at −60 mmHg and peaking at −100 mmHg by default) through the pressure control loop. When the next resistance threshold (90 MΩ) is reached, the holding voltage potential is decreased to −70 mV to match the cell resting membrane potential. The algorithm then stops applying negative pressure and waits for gigaseal formation, as defined by pipette resistance being >1 GΩ (Figs. 6 and 7A). After the gigaseal is formed, the program will halt and give an experimenter an option to apply “zap” as an alternative method to break in. By default, it will apply pulses of negative pressure to break in and establish a whole cell configuration (Fig. 7B). If the cell membrane resistance falls to <300 MΩ (default) and the holding current is within the range −200 to +100 pA (same as our definition for a successful patch), the break-in is considered to be successful and the whole cell configuration is established. Otherwise, if the success criteria or any intermediate thresholds are not met, the program will stay in the current stage and keep executing the respective action until the time limit (4 min by default) is exceeded. Successful patches were validated by measuring resting potential (less than −55 mV) and step current injection-induced action potentials (Fig. 7C). All pressure and resistance parameters are recorded and saved as patch logs to be used in post hoc analysis for experiment quality control and configuration optimization (Fig. 7A). The Autopatcher IG system is scalable and allows automated patching and recording from two or more cells simultaneously (Fig. 7, D–G).
Fig. 6.
Automatic patch function algorithm logic. Nine distinct stages are defined by a series of resistance (Rp, pipette resistance; Rm, membrane resistance; Ra, access resistance), positive and negative pressure [P(+/−)], and time (t) thresholds. Thresholds used in actual experiments are shown in Table 1.
Table 1.
Default threshold values in the gigasealing algorithm
| Parameter | Value | Factor Contributing to Variation |
|---|---|---|
| Rp threshold 1: initial pipette resistance | <10 MΩ | Pipette tip diameter, clogging |
| P(+) threshold 1: minimum positive pressure | >30 mmHg | Extracellular matrix composition, target cell depth (higher pressure may be necessary for deeper cells) |
| Rm threshold 2: touch cell resistance coefficient | >115% of initial Rp | Cell size/type |
| P(−) threshold 1: negative pressure for sealing | Less than −60 mmHg | Cell size/type |
| Rm threshold 3: for −70-mV adjustment | 100 MΩ | Based on experience; may be optimized by data mining |
| Rm threshold 4: wait for gigasealing resistance | 200 MΩ | Based on experience; may be optimized by data mining |
| Rm threshold 5: gigaseal resistance | 1,000 MΩ | Patch quality requirement; a higher value will result in the tighter seal |
| P(−) threshold 2: minimum negative pressure for break-in | Less than −85 mmHg | Cell size/type, ±zapping |
| Rm threshold 6: broken-in resistance | <300 MΩ | Cell size/type |
| Ihold threshold 1: broken-in holding current | Greater than −200 pA and <100 pA | Seal quality |
| t threshold 1: time to fail | 4 min | Based on experience |
Listed values are those used in the experiments described in this article. All listed thresholds are related to the representative patch in Fig. 4, and all can be changed by the user and saved in the Autopatcher IG configuration file.
Fig. 7.
Automatic image-guided patch clamp yields high-quality whole cell recordings comparable with manual patching. A: example patch log of a successful patching trial with a history of current (I), resistance (R), and internal pipette pressure (P) parameters. Top, raw voltage input from the data acquisition board (light green) and the membrane test current (dark green). Middle, membrane resistance. Bottom, internal pipette pressure (letters denote key events in the patch-clamping process: S denotes the touch cell surface event, G denotes the time point at which a gigaseal is obtained, and B denotes when break-in is achieved). The “saw tooth” pressure pattern is caused by the on-off feedback pressure controller switching between pump-on and pump-off states. B: representative images show an automatically patched cell at ×4 magnification (left) and ×40 magnification DIC optics (middle) in a mouse visual cortex brain slice. Right, the same neuron filled with Lucifer yellow, postfixed, and visualized with ×40 magnification epifluorescence optics. C: electrophysiological responses of an automatically patch-clamped neuron to hyperpolarizing and depolarizing current injections. D: representative image of 2 simultaneously patched cells in a slice. E: confocal image of the 2 cells in D filled with Alexa 568 hydrazide and fixed after patching. F: electrophysiological responses of these 2 patched cells to hyperpolarizing and depolarizing current injections. Top, cell on the left (L); bottom, cell on the right (R). G: simultaneous recordings of excitatory postsynaptic potentials (EPSPs) from these neurons evoked by white matter stimulation. H: automatic patching (top; n = 30 from 3 mice) generates high-quality patches that are comparable to those obtained using conventional manual patching (bottom; n = 30 from 6 mice). There was no significant difference between the 2 groups in the distribution of membrane capacitance (P = 0.06), holding potential (P = 0.70), access resistance (P = 0.70), membrane resistance (P = 0.97), and seal resistance (P = 0.33, 2-tailed Student's t-test).
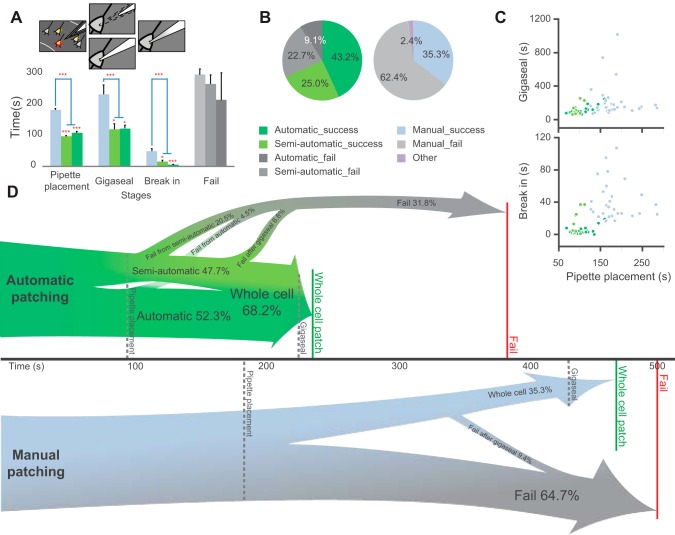
We conducted automatic and manual patch-clamp experiments to evaluate the efficiency and effectiveness of Autopatcher IG. We defined a trial as fully automatic if the system successfully completed a full whole cell patch-clamp trial from the beginning to the end without any interruption or user interference. We defined a semiautomatic trial as a trial that required any user interruption (Fig. 1A). Most of the interruptions were caused by either manipulator inaccuracies in pipette positioning or failures of the algorithm to establish a gigaseal. A total of 30 successful whole cell configurations were achieved in 44 automatic/semiautomatic patching trials, with a total success rate of 68.2%, whereas the success rate of manual patching was only 35.3% (30 of 85 trials). Among all 44 trials performed using Autopatcher IG, 23 trials (52.3%) were fully automatic, 19 of which were successful, which accounts for 82.6% in the fully automatic subcategory or 43.2% in total. The other 21 trials of the total 44 (47.7%) were semiautomatic, and 11 trials were successful, which accounts for 52.4% in the semiautomatic subcategory and 25.0% in total (Fig. 8, B and D). There was no significant difference (Student's t-test) in the quality of patches obtained using the two methods, based on the seal resistance (P = 0.33), the membrane capacitance (P > 0.06) and resistance (P = 0.97), the access resistance (P = 0.70), and the holding current (P = 0.70) (Fig. 8H). Both fully automatic and semiautomatic patching yielded a higher success rate compared with manual patching (Fig. 9).
Fig. 8.
Automatic patching algorithm significantly improves patch clamp efficiency. A: average time spent during pipette placement, gigaseal formation, and establishment of whole cell configuration (break in) in both automatic patching (dark green) and semiautomatic patching (light green) is significantly shorter than in manual patching (light blue) in successful trials. The time from the end of pipette placement to termination of a failed trial (gray) is not significantly different between the 2 methods (*P < 0.05; ***P < 0.001; 2-tailed Student's t-test). Error bars represent SE. B: success rate for automatic (n = 44 from 3 animals) and manual patching (n = 85 from 6 animals). C: distribution of times spent during the 3 patching steps. The automatic patching steps are faster and more reproducible compared with the manual patching steps. Data points are the times for pipette placement in all successful trials vs. gigaseal time (top) and break-in time (bottom). D: schematic illustration showing the average time and success/failure rates of automatic and manual patching.
Fig. 9.
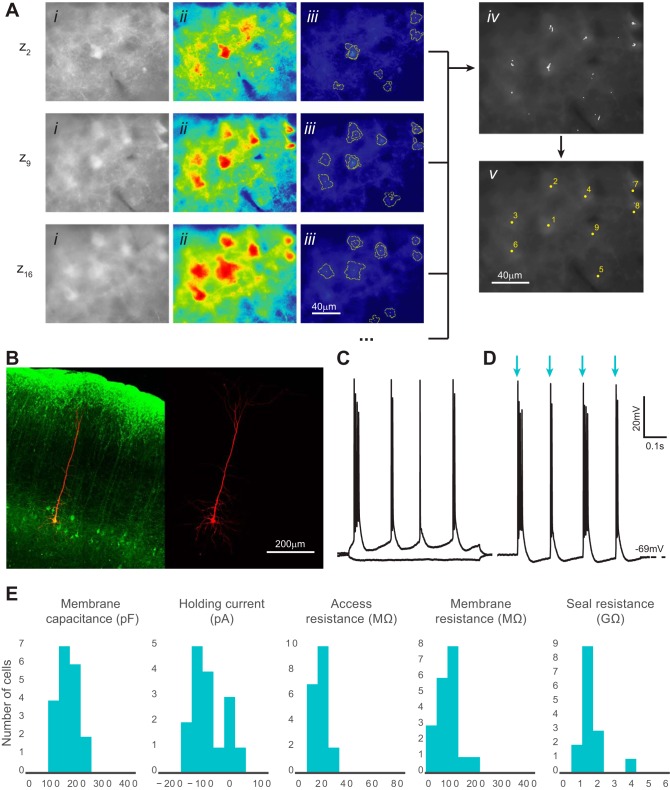
Automatic identification and patch clamp of fluorescent neurons in brain slices. A: computer vision processing of images acquired with epifluorescence optics detects fluorescent neurons and identifies their x, y, z coordinates. Three representative z sections are shown from a complete experiment (20 total z sections) using brain slices prepared from a mouse expressing channelrhodopsin-2-EYFP in layer 5 pyramidal cells (Thy1-ChR2-EYFP mouse line 18). i, Original image after histogram equalization; ii, pseudo-colored image after thresholding; iii, superimposed cell-like contours detected after a series of varying thresholds; iv, centroids of detected contours are accumulated from z sections; v, centroids from the complete z scan (20 z sections) are clustered and the final coordinates calculated. B: representative patched fluorescent neuron (green) filled with Alexa Fluor 568 dye (red) in layer 5 mouse neocortex. An acute brain slice was postfixed and immunolabeled with the anti-GFP antibody. Image acquisition was performed using confocal microscopy. C: current-clamp recordings of a patched cell responding to hyperpolarizing and depolarizing current injection. Firing pattern shows intrinsic bursting, which is characteristic of a layer 5 intrinsically bursting pyramidal neuron. D: the same neuron as in C reacts to light (480 nm) activation with bursts of action potentials. Blue arrows show the light on epochs that are 2 ms each and 150 ms apart. E: patched cell properties measured from each successful trial (n = 20 from 3 animals). No significant differences in holding current, access resistance, membrane resistance, and seal resistance were observed compared with those for nonfluorescent cells, shown in Fig. 7. Membrane capacitance distribution was significantly different from that in nonfluorescent cells, which can be explained by the larger size of the layer 5 pyramidal cells (P < 0.05, 2-tailed Student's t-test).
The average times for positioning a pipette tip next to a target cell, forming a gigaseal, and breaking in were significantly shorter when performed using automatic patching compared with manual patching (Fig. 8, A and D). Moving a pipette tip to a saved target cell location, with secondary calibration of the pipette offset, took on average 103.2 ± 2.7 s (n = 44) for both fully automatic and semiautomatic trials (no difference at this stage). This was significantly faster than manual pipette tip placement, which took 183.0 ± 4.4 s (n = 85, P < 0.0001, Student's t-test). Furthermore, the use of automatic manipulator control and memory positions enabled pipette tip placement outside of the microscope's visual field, which is impossible with manual patching. Automatic patch-clamp algorithm resulted in faster gigaseal formation, 119.5 ± 18.3 s (n = 23) for fully automatic and 122.6 ± 10.1 s (n = 19) for semiautomatic patching (no significant difference between the two, P = 0.88) compared with 233.6 ± 30.3 s (n = 85) for manual patching (P = 0.001). Precise, fast pressure control in response to resistance changes significantly decreased the break-in time from 49.1 ± 8.1 s for manual trials to 15.3 ± 4.3 s for semiautomatic trials (P = 0.036 compared with manual) and further decreased to 5.2 ± 1.0 s for fully automatic trials (P < 0.0002 compared with manual; P = 0.025 compared with semiautomatic; Fig. 9A). There was no significant difference between the duration of failed trials for either automatic or manual algorithms. However, because the duration of a successful trial was two times shorter, and the success rate was two times higher, the overall time spent to achieve comparable productivity was much shorter for the automatic algorithm. Furthermore, the time limit for automatic trial attempt may be further decreased, leading to less time spent during failed trials. Use of the Autopatcher IG also proved to be more consistent because the time spent during each automatic trial was less variable compared with manual patching (Fig. 8C).
Computer vision-aided fluorescent cell detection and patch clamp.
The Autopatcher IG can be used to automatically detect a fluorescent cell, determine the coordinates of this cell, and store the coordinates for subsequent patch-clamp experiments. This automation of cell detection is achieved using computer vision processing of fluorescent images acquired at different slice depths. The program takes a z stack (20 images, 2-μm z-step size, default settings), and each acquired image is transformed into a series of black-and-white images using different thresholds (0.5 to 5 times mean pixel intensity). The use of multiple thresholds instead of one single threshold ensures that the detection algorithm can accommodate a wide range of fluorescence intensities. After initial Canny edge detection, cell contours within the range of 75–250 μm2 in size and 60% circularity are considered to be tentative cells (Figs. 1C and 9Aiii). The centroids of these tentative cell contours from different thresholds are then clustered into groups on the basis of their distance from each other (Fig. 9Aiv). A threshold of a minimal number of detected centroids in a cluster is used to detect and exclude false positives. The final coordinates of each detected cell are the mean of all centroid coordinates along the x- and y- axes and the median along the z-axis (Fig. 9A). Automatic cell detection yields cell coordinates that are stored and can be saved in a file. These coordinates are shown in the memory positions GUI (Fig. 3) that is used to direct a patch pipette and also can be used for directing a puff pipette for local drug application, single-cell laser-scanning photostimulation, or chemical compound uncaging.
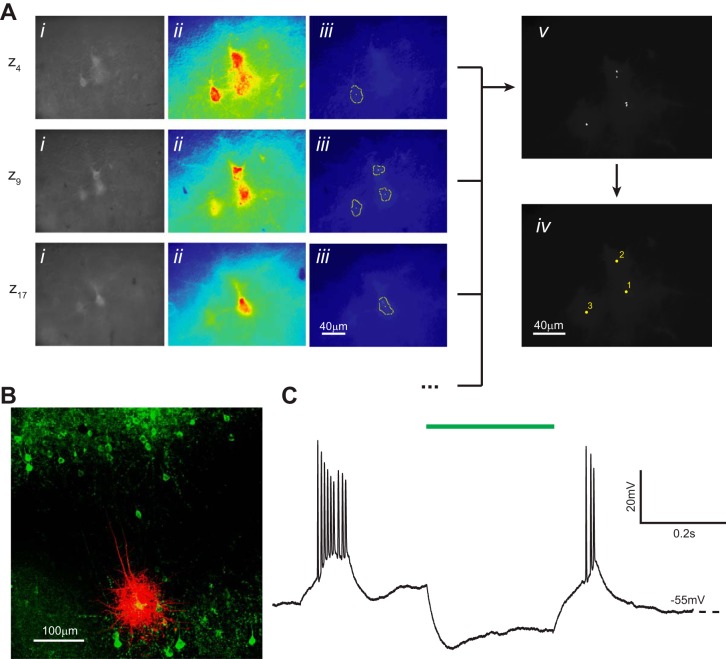
We tested our computer vision algorithm for detecting fluorescent cells in both cortical slices from a Thy1-channelrhodopsin 2-EYFP line 18 (Thy1-ChR2-EYFP) transgenic mouse (Fig. 9) and from a wild-type (WT) mouse injected with HSV-ArchT-EYFP virus (Fig. 10). The average time required to locate the cell centroids was 84.2 ± 0.9 s for ArchT-EYFP (n = 10 trials) and 89.3 ± 1.3 s for Thy1-ChR2-EYFP (n = 10 trials). The average false-positive rate, or computed coordinates not visibly centered over a cell, was low for both preparations at 4.9 ± 2.25% for HSV-ArchT-EYFP and 3.43 ± 1.75% for Thy1-ChR2-EYFP. Detection sensitivity (the percentage of fluorescent cells that can be detected within the field of view) was 76.4 ± 4.6% for HSV-ArchT-EYFP and 79.7 ± 8.8% for Thy1-ChR2-EYFP. There was no significant difference in false-positive rate or detection sensitivity between the two experimental preparations (P > 0.6 for both, Student's t-test). The detection threshold range and computing power could affect the total detection time, but they were sufficient for a standard desktop personal computer used in our experiments. The low variation demonstrates that our detection system reliably detects the majority of fluorescent cells in the field of view.
Fig. 10.
Computer vision-aided automatic cell detection of ArchT-EYFP-positive cells. A: computer vision processing of images acquired with epifluorescence optics detects fluorescent neurons and identifies their x, y, z coordinates. Three representative z sections are shown from a complete experiment (20 total z sections) using brain slices prepared from a mouse injected with HSV-ArchT-EYFP virus. i, Original image after histogram equalization; ii, pseudo-colored image after thresholding; iii, superimposed cell-like contours detected after a series of varying thresholds; iv, centroids of detected contours are accumulated from z sections; v, centroids from the complete z scan (20 z sections) are clustered and the final coordinates calculated. B: representative ArchT-EYFP-positive cell (green) filled with Alexa Fluor 568, postfixed, and immunolabeled with the anti-GFP antibody. Images are acquired using confocal microscopy. C: representative current-clamp recording trace of a layer 5 bursting cell hyperpolarized in response to light (550 nm) activation (green bar).
We then demonstrated the feasibility of a complete automatic patching algorithm from cell detection to whole cell configuration using Autopatcher IG. A total of 20 whole cell patches were formed from fluorescence-positive layer 5 neurons in Thy1-ChR2-EYFP cortical slices (Fig. 9, B and C). The average times were 98.5 ± 2.8 s for pipette positioning, 136.5 ± 20.1 s for gigaseal formation, and 9.8 ± 2.8 s for break-in, all of which were not significantly different from times in automatic and semiautomatic patching trials in WT mice (P > 0.4 for all). Patched cells were subjected to light activation to confirm ChR2-EYFP expression (Fig. 9D). Patch qualities were consistent with those for WT patches (Figs. 7H and 9E). No differences in seal resistance (P = 0.71, Student's t-test), membrane resistance (P > 0.05), access resistance (P = 0.95), and holding current (P = 0.96) were observed compared with the same measurements in manually patched cells. The success rate for automatic detection and patching of fluorescent cells was comparable to that for manual patching at 31.0% (n = 65 from 3 animals), the majority of which required adjustment at the touch cell surface step. The membrane capacitance of automatically patched fluorescent cells was significantly larger than that of nonfluorescent cells (P < 0.001), which could be potentially explained by changes in conductivity caused by expression of ChR2. Furthermore, expression of ChR2 was specific to larger layer 5 pyramidal cells, which may require different thresholds in the patching algorithm that can be determined after the corresponding patch logs are analyzed. The lower success rate and the need for threshold adjustments may also be explained by neuronal cell firing during fluorescence visualization. Alternatively, previous reports suggest that long-term high levels of expression of ChR2 may influence the health of a cell (Feldbauer et al. 2009; Lin 2011; Miyashita et al. 2013).
DISCUSSION
We have developed an image-guided patch-clamp electrophysiology software package, the Autopatcher IG, which achieves high-level automation for whole cell patch-clamp experiment in vitro. Some existing systems have attempted to automate separate steps in the whole process, such as cell detection (Long et al. 2015), pressure control (Desai et al. 2015), and pipette positioning (Long et al. 2015; Perin and Markram 2013); however, there has not been an integrated system that automates the entire patching process from targeting cells to forming whole cell patch clamp in vitro. We have tested Autopatcher IG performance in patch-clamp experiments conducted by a newly trained experimenter and have shown a twofold improvement of success rate and decrease in average time spent on each trial compared with the traditional manual patching procedure. Both factors contributed to an overall increase in throughput, which will improve the utilization of each tissue sample and decrease the time required to obtain large patch-clamp data sets. This is especially advantageous when experiments are conducted on valuable transgenic animals or require viral injection, or when long and complex training protocols must be implemented prior to the slice electrophysiology experiment. Furthermore, Autopatcher IG enables control of experimental parameters that is hard to achieve even for a trained user (for example, uniform descent speed and pressure application), which helps to minimize trial variability and promote reproducibility. The system is widely adaptable because the software is suitable for a broad range of hardware configurations augmented only by a pneumatic pressure control unit.
Some limitations of Autopatcher IG led to human interference during the automatic patch process, which was then followed by the fully automatic continuation of the algorithm (Figs. 1A and 8). In these “semiautomatic” trials there were errors in mechanical manipulator positioning at distances longer than 200 μm. There are two potential solutions to this problem: more accurate micromanipulators or a close-loop computer vision algorithm for pipette tip detection and real-time coordinate tracking. Another limitation that led to human interruption was caused by variability in automatic patching threshold parameters, which could be explained by cell heterogeneity. Optimization of these thresholds for specific cell types may solve this problem. Nonetheless, the system still achieved a 43.2% success rate when only fully automatic patching was counted. It is noteworthy that the rest of the trials were not failures and that the whole cell configurations could be reached with only minor adjustment in semiautomatic trials.
By integrating and automating all steps of the patching process, Autopatcher IG improves the speed and reproducibility of patching, leading to an increase in throughput. The age of the animal, duration of the experiment, area of the brain, and many more experimental details can have dramatic effects on the “health” of neurons and thus their ability to form stable gigaseals and whole cell configurations (Boulton al. 1995; Walz 2007). Autopatcher IG is intended to serve as a framework for quantifying and standardizing in vitro patch-clamp recording. The ability to algorithmically control all relevant peripheral devices from a single interface makes it possible to document and standardize existing “best practices” in obtaining whole cell recordings (Boulton et al. 1995; Walz 2007). Integrated algorithmic control also makes it possible to explore and quantify new ways of obtaining whole cell recordings. For instance, a millisecond-timescale closed-loop pipette pressure control system could potentially outperform even an expert in quickly establishing a gigaseal and breaking into a cell delicately. In the future, these algorithms can then be refined and optimized in a systematic fashion.
The difficulty of patch-clamp recording in brain slices is compounded when multiple cells must be patched simultaneously, for example, to profile interneuronal connectivity in a region of the brain (Le Be and Markram 2006; Perin et al. 2011). Because of its modular nature, the Autopatcher IG software is readily scalable for multiple manipulators, limited only by the hardware (manipulators, data acquisition board, amplifiers). Multipatch experiments are still impractical for many electrophysiology laboratories, despite notable system engineering efforts (Perin and Markram 2013; Wang et al. 2015). The improvements in whole cell yield and automation provided by Autopatcher IG may increase the likelihood of obtaining multiple stable simultaneous recordings. This could lower the barrier to entry for laboratories wishing to perform multipatch experiments.
A major innovation of Autopatcher IG is the incorporation of computer vision into image processing to robustly and reliably extract cell and pipette coordinate information. It is especially beneficial for detecting and storing the z coordinate of multiple fluorescent cells, which is complicated and time consuming in manual patching. However, the selection of a suitable target cell without fluorescent signal is still a difficult user-dependent task that is manually performed in the current system. Another rate-limiting step is the filling and changing of glass pipettes before each trial. In future versions of the software, we intend to develop computer vision algorithms to reliably identify and track healthy cell bodies under DIC optics (Alexopoulos et al. 2002), along with robotic devices for automatically swapping patch electrodes to perform patch-clamp experiments completely autonomously. The software presented in this article and the accompanying user manuals are freely available online for the neuroscience community (www.autopatcher.org or https://github.com/chubykin/AutoPatcher_IG). Software updates and bug fixes will be announced on those websites.
GRANTS
We are grateful for financial support from National Institutes of Health (NIH) Computational Neuroscience Training Grant DA032466-02 and NIH BRAIN Initiative Grant 1-U01-MH106027-01, the Simons Center for the Social Brain, and the Whitehall Foundation.
DISCLOSURES
No conflicts of interest, financial or otherwise, are declared by the authors.
AUTHOR CONTRIBUTIONS
Q.W., I.K., B.M.C., Z.S., W.S., S.B.K., R.N., and A.A.C. performed experiments; Q.W., I.K., and A.A.C. analyzed data; Q.W., I.K., H.Z., C.R.F., and A.A.C. interpreted results of experiments; Q.W., I.K., and A.A.C. prepared figures; Q.W., I.K., C.R.F., and A.A.C. drafted manuscript; Q.W., I.K., S.B.K., E.S.B., C.R.F., and A.A.C. edited and revised manuscript; C.R.F. and A.A.C. conception and design of research; C.R.F. and A.A.C. approved final version of manuscript.
ACKNOWLEDGMENTS
We thank the Allen Institute founders, Paul G. Allen and Jody Allen, for their vision, encouragement, and support.
REFERENCES
- Ackerman MJ, Clapham DE. Ion channels–basic science and clinical disease. N Engl J Med 336: 1575–1586, 1997. [DOI] [PubMed] [Google Scholar]
- Alexopoulos LG, Erickson GR, Guilak F. A method for quantifying cell size from differential interference contrast images: validation and application to osmotically stressed chondrocytes. J Microsc 205: 125–135, 2002. [DOI] [PubMed] [Google Scholar]
- Alivisatos AP, Chun M, Church GM, Greenspan RJ, Roukes ML, Yuste R. The brain activity map project and the challenge of functional connectomics. Neuron 74: 970–974, 2012. [DOI] [PMC free article] [PubMed] [Google Scholar]
- Alivisatos AP, Chun M, Church GM, Deisseroth K, Donoghue JP, Greenspan RJ, McEuen PL, Roukes ML, Sejnowski TJ, Weiss PS, Yuste R. Neuroscience. The brain activity map. Science 339: 1284–1285, 2013. [DOI] [PMC free article] [PubMed] [Google Scholar]
- Arenkiel BR, Peca J, Davison IG, Feliciano C, Deisseroth K, Augustine GJ, Ehlers MD, Feng G. In vivo light-induced activation of neural circuitry in transgenic mice expressing channelrhodopsin-2. Neuron 54: 205–218, 2007. [DOI] [PMC free article] [PubMed] [Google Scholar]
- Boulton AA, Baker GB, Walz W. Patch-Clamp Applications and Protocols. Totowa, NJ: Humana, 1995. [Google Scholar]
- Boyden ES, Zhang F, Bamberg E, Nagel G, Deisseroth K. Millisecond-timescale, genetically targeted optical control of neural activity. Nat Neurosci 8: 1263–1268, 2005. [DOI] [PubMed] [Google Scholar]
- Bradski G. The OpenCV library. Dr Dobbs J Softw Tools 25: 120–126, 2000. [Google Scholar]
- Campagnola L, Kratz MB, Manis PB. ACQ4: an open-source software platform for data acquisition and analysis in neurophysiology research. Front Neuroinform 8: 3, 2014. [DOI] [PMC free article] [PubMed] [Google Scholar]
- Desai NS, Siegel JJ, Taylor W, Chitwood RA, Johnston D. MATLAB-based automated patch-clamp system for awake behaving mice. J Neurophysiol 114: 1331–1345, 2015. [DOI] [PMC free article] [PubMed] [Google Scholar]
- Edelstein A, Amodaj N, Hoover K, Vale R, Stuurman N. Computer control of microscopes using μManager. Curr Protoc Mol Biol chapter 14: unit 14.20, 2010. [DOI] [PMC free article] [PubMed] [Google Scholar]
- Edwards FA, Konnerth A, Sakmann B. Quantal analysis of inhibitory synaptic transmission in the dentate gyrus of rat hippocampal slices: a patch-clamp study. J Physiol 430: 213–249, 1990. [DOI] [PMC free article] [PubMed] [Google Scholar]
- Feldbauer K, Zimmermann D, Pintschovius V, Spitz J, Bamann C, Bamberg E. Channelrhodopsin-2 is a leaky proton pump. Proc Natl Acad Sci USA 106: 12317–12322, 2009. [DOI] [PMC free article] [PubMed] [Google Scholar]
- Hoshi T, Zagotta WN, Aldrich RW. Biophysical and molecular mechanisms of Shaker potassium channel inactivation. Science 250: 533–538, 1990. [DOI] [PubMed] [Google Scholar]
- Insel TR, Landis SC, Collins FS. Research priorities. The NIH BRAIN Initiative. Science 340: 687–688, 2013. [DOI] [PMC free article] [PubMed] [Google Scholar]
- Jaffe D, Johnston D. Induction of long-term potentiation at hippocampal mossy-fiber synapses follows a Hebbian rule. J Neurophysiol 64: 948–960, 1990. [DOI] [PubMed] [Google Scholar]
- Jiang X, Shen S, Cadwell CR, Berens P, Sinz F, Ecker AS, Patel S, Tolias AS. Principles of connectivity among morphologically defined cell types in adult neocortex. Science 350: aac9462, 2015. [DOI] [PMC free article] [PubMed] [Google Scholar]
- Kandel ER, Markram H, Matthews PM, Yuste R, Koch C. Neuroscience thinks big (and collaboratively). Nat Rev Neurosci 14: 659–664, 2013. [DOI] [PubMed] [Google Scholar]
- Kawaguchi Y, Kubota Y. Correlation of physiological subgroupings of nonpyramidal cells with parvalbumin- and calbindinD28k-immunoreactive neurons in layer V of rat frontal cortex. J Neurophysiol 70: 387–396, 1993. [DOI] [PubMed] [Google Scholar]
- Kodandaramaiah SB, Franzesi GT, Chow BY, Boyden ES, Forest CR. Automated whole-cell patch-clamp electrophysiology of neurons in vivo. Nat Methods 9: 585–587, 2012. [DOI] [PMC free article] [PubMed] [Google Scholar]
- Komai S, Denk W, Osten P, Brecht M, Margrie TW. Two-photon targeted patching (TPTP) in vivo. Nat Protoc 1: 647–652, 2006. [DOI] [PubMed] [Google Scholar]
- Larkum ME, Zhu JJ, Sakmann B. A new cellular mechanism for coupling inputs arriving at different cortical layers. Nature 398: 338–341, 1999. [DOI] [PubMed] [Google Scholar]
- Le Be JV, Markram H. Spontaneous and evoked synaptic rewiring in the neonatal neocortex. Proc Natl Acad Sci USA 103: 13214–13219, 2006. [DOI] [PMC free article] [PubMed] [Google Scholar]
- Lefort S, Tomm C, Floyd Sarria JC, Petersen CC. The excitatory neuronal network of the C2 barrel column in mouse primary somatosensory cortex. Neuron 61: 301–316, 2009. [DOI] [PubMed] [Google Scholar]
- Lin JY. A user's guide to channelrhodopsin variants: features, limitations and future developments. Exp Physiol 96: 19–25, 2011. [DOI] [PMC free article] [PubMed] [Google Scholar]
- Long B, Li L, Knoblich U, Zeng H, Peng H. 3D image-guided automatic pipette positioning for single cell experiments in vivo. Sci Rep 5: 18426, 2015. [DOI] [PMC free article] [PubMed] [Google Scholar]
- Markram H, Lubke J, Frotscher M, Roth A, Sakmann B. Physiology and anatomy of synaptic connections between thick tufted pyramidal neurones in the developing rat neocortex. J Physiol 500: 409–440, 1997. [DOI] [PMC free article] [PubMed] [Google Scholar]
- Miyashita T, Shao YR, Chung J, Pourzia O, Feldman DE. Long-term channelrhodopsin-2 (ChR2) expression can induce abnormal axonal morphology and targeting in cerebral cortex. Front Neural Circuits 7: 8, 2013. [DOI] [PMC free article] [PubMed] [Google Scholar]
- Neher E, Sakmann B. Single-channel currents recorded from membrane of denervated frog muscle fibres. Nature 260: 799–802, 1976. [DOI] [PubMed] [Google Scholar]
- Perin R, Berger TK, Markram H. A synaptic organizing principle for cortical neuronal groups. Proc Natl Acad Sci USA 108: 5419–5424, 2011. [DOI] [PMC free article] [PubMed] [Google Scholar]
- Perin R, Markram H. A computer-assisted multi-electrode patch-clamp system. J Vis Exp (80): e50630, 2013. [DOI] [PMC free article] [PubMed] [Google Scholar]
- Petreanu L, Huber D, Sobczyk A, Svoboda K. Channelrhodopsin-2-assisted circuit mapping of long-range callosal projections. Nat Neurosci 10: 663–668, 2007. [DOI] [PubMed] [Google Scholar]
- Philpot BD, Sekhar AK, Shouval HZ, Bear MF. Visual experience and deprivation bidirectionally modify the composition and function of NMDA receptors in visual cortex. Neuron 29: 157–169, 2001. [DOI] [PubMed] [Google Scholar]
- Suter BA, O'Connor T, Iyer V, Petreanu LT, Hooks BM, Kiritani T, Svoboda K, Shepherd GM. Ephus: multipurpose data acquisition software for neuroscience experiments. Front Neural Circuits 4: 100, 2010. [DOI] [PMC free article] [PubMed] [Google Scholar]
- Ting JT, Daigle TL, Chen Q, Feng G. Acute brain slice methods for adult and aging animals: application of targeted patch clamp analysis and optogenetics. Methods Mol Biol 1183: 221–242, 2014. [DOI] [PMC free article] [PubMed] [Google Scholar]
- Tripathy SJ, Burton SD, Geramita M, Gerkin RC, Urban NN. Brain-wide analysis of electrophysiological diversity yields novel categorization of mammalian neuron types. J Neurophysiol 113: 3474–3489, 2015. [DOI] [PMC free article] [PubMed] [Google Scholar]
- Walz W. Patch-Clamp Analysis: Advanced Techniques. Totowa, NJ: Humana, 2007. [Google Scholar]
- Wang G, Wyskiel DR, Yang W, Wang Y, Milbern LC, Lalanne T, Jiang X, Shen Y, Sun QQ, Zhu JJ. An optogenetics- and imaging-assisted simultaneous multiple patch-clamp recording system for decoding complex neural circuits. Nat Protoc 10: 397–412, 2015. [DOI] [PMC free article] [PubMed] [Google Scholar]
- Zalutsky RA, Nicoll RA. Comparison of two forms of long-term potentiation in single hippocampal neurons. Science 248: 1619–1624, 1990. [DOI] [PubMed] [Google Scholar]


