Abstract
Introduction and Objectives
Oncogenic FGFR3-TACC3 fusions and FGFR3 mutations are target candidates for small molecule inhibitors in bladder cancer (BC). Because FGFR3 and TACC3 genes are located very closely on chromosome 4p16.3, detection of the fusion by DNA-FISH (fluorescent in situ hybridization) is not a feasible option. In this study, we developed a novel RNA-FISH assay using branched DNA probe to detect FGFR3-TACC3 fusions in formaldehyde-fixed paraffin-embedded (FFPE) human BC samples.
Materials and Methods
The RNA-FISH assay was developed and validated using a mouse xenograft model with human BC cell lines. Next, we assessed the consistency of the RNA-FISH assay using 104 human BC samples. In this study, primary BC tissues were stored as frozen and FFPE tissues. FGFR3-TACC3 fusions were independently detected in FFPE sections by the RNA-FISH assay and in frozen tissues by RT-PCR. We also analyzed the presence of FGFR3 mutations by targeted sequencing of genomic DNA extracted from deparaffinized FFPE sections.
Results
FGFR3-TACC3 fusion transcripts were identified by RNA-FISH and RT-PCR in mouse xenograft FFPE tissues using the human BC cell lines RT112 and RT4. These cell lines have been reported to be fusion-positive. Signals for FGFR3-TACC3 fusions by RNA-FISH were positive in 2/60 (3%) of non-muscle-invasive BC (NMIBC) and 2/44 (5%) muscle-invasive BC (MIBC) patients. The results of RT-PCR of all 104 patients were identical to those of RNA-FISH. FGFR3 mutations were detected in 27/60 (45%) NMIBC and 8/44 (18%) MIBC patients. Except for one NMIBC patient, FGFR3 mutation and FGFR3-TACC3 fusion were mutually exclusive.
Conclusions
We developed an RNA-FISH assay for detection of the FGFR3-TACC3 fusion in FFPE samples of human BC tissues. Screening for not only FGFR3 mutations, but also for FGFR3-TACC3 fusion transcripts has the potential to identify additional patients that can be treated with FGFR inhibitors.
Introduction
Activation of fibroblast growth factor receptor 3 (FGFR3) has been reported to play important roles in several malignancies, including uterine cervix carcinoma and multiple myeloma as well as bladder cancers (BC)[1][2]. Ninety-seven percent of activating FGFR3 mutations observed in BC are clustered in either exon 7 (codons 248 and 249), exon 10 (codons 372, 373 and 375), or exon 15 (codon 652)[3]. Mutations in exons 7 or 10 create unpaired cysteines in the proximal extracellular region, leading to the formation of disulfide bonds between adjacent receptors, thereby inducing ligand-independent dimerization and activation[4][5]. Mutations within the kinase domain, such as codon 652, are thought to induce a conformational change in the activation loop, resulting in constitutive autophosphorylation of the receptor[6].
Recently, FGFR3-transforming acidic coiled-coil 3 (TACC3) fusions have been identified in glioblastoma[7], head and neck carcinoma[8], and lung cancer[9], as well as urothelial cancer (UC)[10]. FGFR tyrosine kinase inhibitors have been developed and shown to be effective in cell lines harboring not only an activating FGFR3 mutations, but also an FGFR3-TACC3 fusion gene in vitro and in vivo[11]. These include the S249C mutation in human BC cells 97–7[12], Y375C mutation in human BC cells MGH-U3[13], and FGFR3-TACC3 fusion in human glioma stem cells GIC-1123[11]. In addition, significant clinical responses to an FGFR inhibitor were reported in FGFR3-TACC3 fusion-positive patients with cervical cancer[14] or glioma[11] in Phase I clinical trials. Thus, detection of not only the activating FGFR3 mutations, especially in exons 7, 10 and 15, but also the FGFR3-TACC3 fusion in BC patients could be clinically important to identify responders to FGFR kinase inhibitors.
DNA fluorescent in situ hybridization (DNA-FISH) is widely used to detect fusion genes from genomic DNA[15][16]. However, genomic DNA-FISH is not a feasible option to detect an FGFR3-TACC3 fusion. Generally, fusion detection assays of DNA-FISH are based on 2 strategies, dual fusion or break apart. In the dual fusion strategy, 2 colored probes are designed to span the breakpoint of the 2 genes involved in the fusion. These probes are visually distinct in normal cells but appear merged by the specific fusion event. However, this strategy is not a feasible option for FGFR3-TACC3 fusion detection because the 2 genes map very closely, at a distance of only 48 Kb on chromosome 4p16.3, and thus the 2 probes appear merged in both normal cells and fusion-positive cells. In the break-apart strategy, probes are designed to target opposite sides of the translocation break point for a given gene, each labeled by a different color. These probes generate signals in normal cells that are co-localized and appear merged. Following a translocation, the signals are no longer co-localized but appear to be separate. This strategy is also not a feasible option for FGFR3-TACC3 fusion detection. According to Parker et al., the FGFR3-TACC3 fusion is caused by tandem duplication of a 70 kb region on 4p16.3[17]. This is confirmed by performing genomic DNA capillary sequencing of tandem duplication boundaries[17]. Therefore, fluorescent probes appear merged in both normal and fusion-positive cells.
Recently, several RNA-ISH based assays have been applied to detect mRNA transcripts of fusion genes, which include padlock probes/rolling circle amplification (RCA), “smFISH,” and “branched DNA (bDNA)-FISH”. For example, TMPRSS2-ERG fusion transcripts were identified by padlock probes/RCA[18]. However, the padlock probe/RCA approach needs an in situ cDNA preparation, which would pose additional technical difficulty when using formaldehyde-fixed paraffin-embedded (FFPE) tissue slides due to degradation and modification of nucleic acids. “smFISH” systems using single fluorophore-labeled probes are also applied to detect mRNA transcripts of fusion genes[19][20]. Following smFISH, “bDNA-FISH” system has been applied to detect mRNA transcripts of fusion genes[21]. In “bDNA-FISH,” sequential hybridization of a series of oligonucleotide probes generates signal amplification. This contrasts with “smFISH,” which lacks a signal-amplification step. The bDNA probes are commercially available as a 'ViewRNA' system (Affymetrix, Santa Clara, CA, USA) or an 'RNAscope' system (Advanced Cell Diagnostics, Hayward, CA, USA). “bDNA-FISH” and “smFISH” demonstrate the same accuracy, but “bDNA-FISH” yields brighter spots with a better signal-to-noise ratio[22]. Neither “smFISH” nor “bDNA-FISH” assay has been applied to detect FGFR3-TACC3 fusion yet.
Here, we sought to develop an RNA-FISH assay using bDNA probes to detect FGFR3-TACC3 fusion gene transcripts in FFPE tissue, which are the most widely available specimens in clinical settings. In this study, we first applied an RNA-FISH assay using bDNA probes to detect FGFR3-TACC3 fusion transcripts in human FFPE BC tissue. We also analyzed the relationship between the FGFR3 mutation, FGFR3-TACC3 fusion status, and clinical information in a prospective multicenter cohort of more than 100 patients with the clinical diagnosis of BC.
Materials and Methods
Patients and tissue samples
This study was conducted as a prospective multicenter cohort study including 144 patients from 7 institutions with the clinical diagnosis of UC. The participating hospitals were Tohoku University Hospital, Akita University Hospital, Kyoto University Hospital, Kagawa University Hospital, Hitachi General Hospital, Tsukuba Medical Center Hospital, and Tsukuba University Hospital. Primary cancer tissue samples obtained from 106 patients with non-metastatic BCs were stored as frozen and FFPE tissues. The remaining 38 cases were metastatic UC includes bladder, ureter, and renal pelvis cancer. For these metastatic UC patients, archival FFPE samples of the primary tumors were used if fresh frozen tissues were not available.
This research protocol was approved by the Ethics Committee of Tsukuba University Hospital (Approval number: H25-116). This study was also reviewed and approved by the Ethics Committees of the following institutes: Tohoku University Hospital, Akita University Hospital, Kyoto University Hospital, Kagawa University Hospital, Hitachi General Hospital, and Tsukuba Medical Center Hospital. Tumor specimens, blood, and clinicopathologic information were collected with written informed consent.
Portions of tissue samples were frozen and stored at −80°C, and the remainder of the sample was fixed in 10% formaldehyde for 12–24 hours at room temperature and embedded in paraffin for diagnostic assessment. Hematoxylin and eosin staining (H&E) was performed, and the slides were reviewed by a pathologist. Tumors were staged according to the 2009 UICC 7th TNM Classification system. Tissue sections that showed malignant tumor cell nuclei in 10% or more cells on the whole specimen were included in this study. A total of 144 patients were enrolled, 7 patients were excluded from this study due to a low tumor fraction in the whole specimen (less than 10%). Two patients were excluded because their tumors were not malignant. One sample was excluded due to a lack of genomic DNA yield from the FFPE sample. Thirty samples were excluded because fresh frozen tissues were not available. Finally, 104 BC patients were included. The patient characteristics are summarized in Table 1. Of the 104 patients, 60 were classified as non-muscle invasive BC (NMIBC) and 44 as muscle-invasive BC (MIBC) according to the pathological findings.
Table 1. Characteristics of bladder cancer patients.
| NMIBC | MIBC | Total | ||
|---|---|---|---|---|
| N | 60 | 44 | 104 | |
| Age (years) | Median (range) | 69 (30–87) | 72 (42–87) | 70 (30–87) |
| Gender | Male (%) | 55 (92) | 32 (73) | 87 (84) |
| Female (%) | 5 (8) | 12 (27) | 17 (16) | |
| T stage | Ta (%) | 43 (72) | ||
| Tis/T1 (%) | 17 (28) | |||
| ≧T2 (%) | 44 (100) | |||
| M stage | M1 (%) | 0 (0) | 4 (10) | |
| Grade | High grade (%) | 26 (47) | ||
| Low grade (%) | 34 (53) | |||
| Multiplicity | Solitary (%) | 24 (40) | 23 (52) | |
| Multiple (%) | 33 (55) | 15 (34) | ||
| Unknown (%) | 3 (5) | 6 (14) | ||
| Tumor size | <3 cm (%) | 41 (68) | 9 (20) | |
| >3 cm (%) | 19 (32) | 35 (80) |
Cell lines and cell culture
Three human BC cell lines (RT112[23], FGFR3-TACC3 fusion-positive[10]; RT4[24], FGFR3-TACC3 fusion-positive[10]; and T24[25], FGFR3 wild type[10]) and HSC-39 (human signet ring cell gastric carcinoma cell line[26], FGFR3 wild type) were used. All cells were cultured in RPMI 1640 (Wako, Osaka, Japan) supplemented with 10% fetal bovine serum (FBS) at 37°C in 5% CO2 and 20% O2.
Subcutaneous xenografts and FFPE slide preparation
For establishment of tumor xenografts, log-phase RT112, RT4, T24, and HSC-39 cells were implanted intradermally (5×10⁶ cells per mouse in 0.1 mL PBS) into the backs of female BALB/c-nu/nu mice (Charles River Laboratories, Wilmington, MA, USA) at 5 to 6 weeks old. All surgery was performed under ether anesthesia, and all efforts were made to minimize suffering. Mice were euthanized by cervical dislocation while under anesthesia when tumor size exceeded 200 mm3 in size. Tumors were excised from mice and divided into 2 pieces. One piece was dip-washed in saline, blotted dry, snap frozen in liquid nitrogen, and stored at −80°C until analysis. The other piece was fixed in 10% formaldehyde for 24 hours at room temperature before embedding in paraffin for tissue sections. All experiments were performed in compliance with the relevant Japanese and institutional laws and guidelines and approved by the University of Tsukuba Animal Ethics Committee (authorization number 15–162).
Detection of fusion transcripts by RNA-FISH
In situ detection of FGFR3 and TACC3 transcripts in FFPE sections was conducted using a QuantiGene® ViewRNA ISH Tissue Assay Kit (Affymetrix) with a modified protocol for custom-made probes. For TACC3, Alexa 546 (Excitation = 556 nm and Emission = 573 nm) was used, and for FGFR3, Alexa 647 (Excitation = 650 nm and Emission = 668 nm) was used as a fluorescent dye; both were purchased as custom-made products (namely type 1 for TACC3 and type 6 for FGFR3) from Veritas (an Affymetrix sales representative in Japan). A step-by-step protocol is provided as the S1 Protocol. In brief, FFPE sections were treated according to the manufacturer’s protocol of QuantiGene® ViewRNA ISH Tissue Assay Kit before adding the labeled probe solution. In order to detect the mRNA signal with high resolution, the fluorescent label reagent (label probe mix) from a QuantiGene ViewRNA ISH Cell Assay Kit (Affymetrix) and its compatible custom-made probes described above were used.
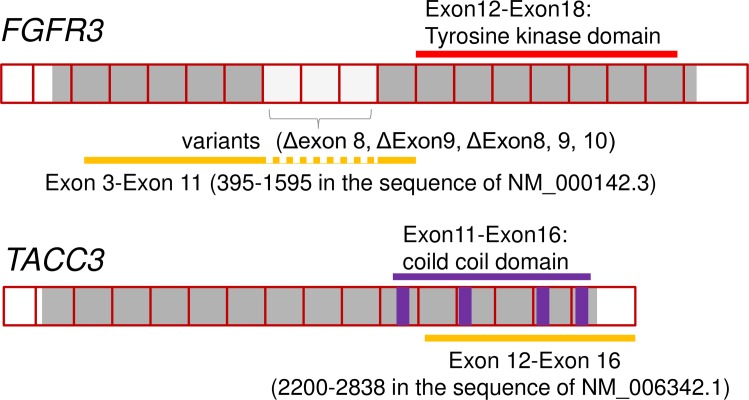
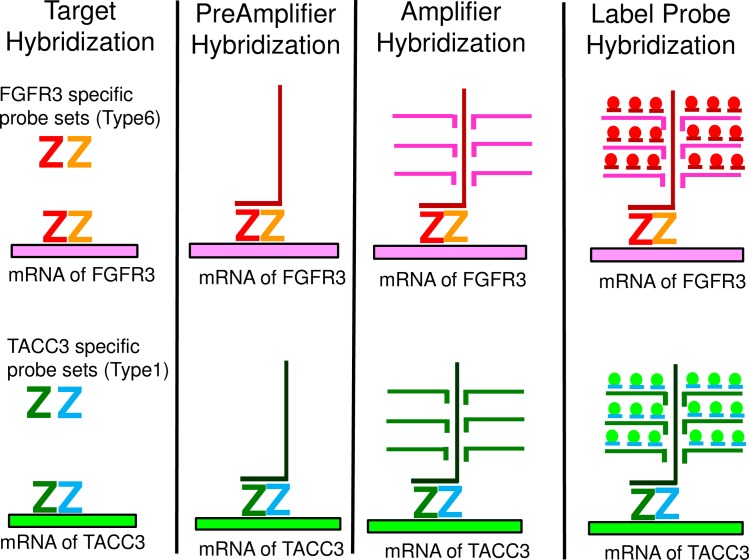
The target sequence of the FGFR3-specific oligonucleotide probes was located in exons 3 to 11 corresponding to nucleotide numbers 395–1595 in the sequence of NM_000142.3 of FGFR3 except for exons 8, 9 and 10, which are variable in alternative splicing. Thus the probes specifically hybridize to all three variants of human FGFR3 mRNA. The target sequence of the TACC3-specific oligonucleotide probes was located in exons 12–16 corresponding to the nucleotide numbers 2200–2838 in the sequence of NM_006342.1 of TACC3. Fig 1 shows a schematic representation of how FGFR3-specific probes and TACC3-specific probes were designed. The probe sets for each gene consisted of around 15 to 20 pairs of probes. One pair consisted of 2 of about 20 base oligonucleotide probes. The 2 probe pairs are designed to hybridize to adjacent segments on the target RNA, allowing further hybridization of a preamplification probe (Affymetrix) for signal amplification by labeled probes. This “double Z” structure assures the specificity to the target mRNA because this construction of a “double Z” structure by 2 adjacent probes is required for signal amplification. A schematic figure explaining how this bDNA-FISH-based assay works is shown in Fig 2.
Fig 1. Schematic representation of how FGFR3-specific probes and TACC3-specific probes were designed.
Fig 2. A schematic figure explaining how bDNA-FISH works.
After fluorescent label probe hybridization, slides were dried and mounted with ProLong® Gold Antifade Reagents (Thermo Fisher Scientific, Waltham, MA, USA). Ten non-overlapping fields of view of fluorescent signal images per slide were obtained for each fluoresce with ×630-fold magnification with a confocal laser microscope (LSM700; Carl Zeiss, Zena, Germany). For FGFR, a Cy5 (Excitation/Emission = 650/670 nm) filter was used, and for TACC3, a Cy3 (Excitation/Emission = 552/570 nm) filter was used. Each field of view was obtained from a different part of the tissue portion in which cancer cells were present. The presence of cancer cells was confirmed by comparing DAPI-stained nucleic images with H&E stained images. These images were analyzed using IN Cell Investigator Developer Toolbox 1.9.2 which is the image analysis software used with IN Cell Analyzer 2000 (GE Healthcare, Amersham, UK) to obtain the number of signals for each probe (FGFR3 and TACC3) and to examine whether each signal dot from each probe overlapped or not. Overlapped/co-localized dots were recognized as “overlapped/co-localized” when 50% of the area from each signal overlapped with another signal. When overlapped/co-localized signals were observed, the number of such overlapped/co-localized dots were counted. These image analyses were performed unbiasedly and automatically by software with a fixed protocol every time. A schematic representation of how co-localized signals were detected by IN Cell Investigator is shown in S1 Fig. The overlapped signals could be detected not only from real fusion mRNA, but also from proximity of the 2 target RNAs simply by chance. Actually, a small number of overlapped signals were detected in the negative control HSC-39. These accidentally overlapped signals could be increased in direct proportion to the total number of FGFR3 signals and TACC3 signals. To overcome this problem, the number of overlapped signals was divided by the number of FGFR3 and TACC3 signals. These processes were repeated for each 10 non-overlapping fields of view per one sample. The co-localization ratios were defined as the ratio of the co-localized count number per total number for each probes, and this co-localization ratio for 10 non-overlapping fields in each slide was plotted as in a scatter diagram and used for detection of the presence of fusion transcripts.
RNA extraction and cDNA synthesis
Total RNA was extracted from frozen tissues using TRIzol (Thermo Fisher Scientific), and from FFPE tissues using an RNeasy FFPE kit (Qiagen, Hilden, Germany). First strand cDNA was synthesized using Superscript Ⅲ Super Mix and oligo dT primers (Thermo Fisher Scientific) according to the manufacturer’s instructions. The quality of the cDNA from FFPE tissue was tested for the presence of the hypoxanthine guanine phosphoribosyltransferase (HPRT) housekeeping gene (152 bps amplified product; forward primer, 5’-GACTTTGCTTTCCTTGGTC-3’ and reverse primer, 5’-AGTCAAGGGCATATCCTAC-3’). The quality of cDNA from frozen tissue was tested for the β-actin housekeeping gene (539 bps amplified product using forward primer 5’-GTGGGGCGCCCCAGGCACCA-3’ and reverse primer 5’-CTCCTTAATGTCACGCACGATTTC-3’).
Identification of FGFR3-TACC3 fusion transcripts by RT-PCR and DNA sequencing
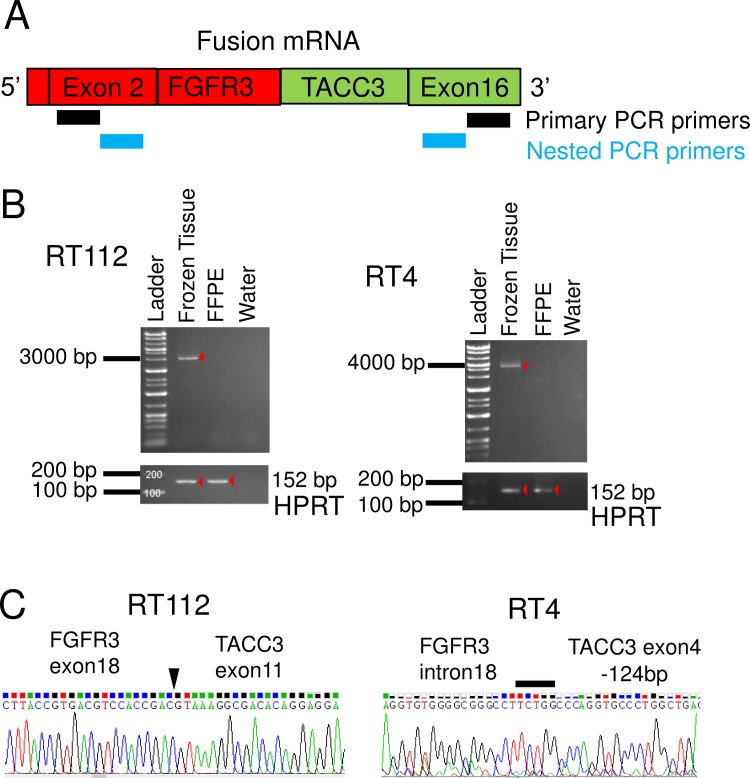
We designed a reverse transcription-PCR (RT-PCR) assay for the detection of all known and possible new variants of FGFR3-TACC3 fusions that retain the mRNA sequences coding for the key FGFR-tyrosine kinase domain and transforming acidic coiled-coil domain required for oncogenic activity of the fusion protein. Previously reported FGFR3-TACC3 fusions were exons 18 or 19 of FGFR3 and exons 4–13 of TACC3, and a short intron was inserted in some cases[27]. To detect FGFR3-TACC3 fusion gene transcripts, we performed RT-PCR using our original primers as follows: the forward primer, FGFR3 exon2-Forward: 5’- CCTGAGGACGCCGCGGCCCCCGCCCCC-3’ and the reverse primer, TACC3 exon16-Reverse: 5’-TGACCTCCACGGAGCCGCTGTCCCCGC-3’; amplification conditions were 94°C for 2 min (98°C for 5 sec/68°C for 3 min) for 40 cycles, then 72°C for 5 min. PCR-amplified products were diluted 1:50 in sterile water, and then used for nested PCR amplifications with internal primers. For the nested PCR, primer pairs were FGFR3 exon 2-Forward: 5’- GCCATGGGCGCCCCTGCCTGCGCCCTC-3’ and TACC3 exon 16-Reverse: 5’- GACCTCATCTCCAAGATGGAGAAGATC-3’. A schematic representation of RT-PCR primer positions is shown in Fig 3A. All designed primers were BLASTed against the human genome to make sure they were not complementary to other regions of the genome[28]. After amplification of the fusion gene specific template by PCR, the finding was confirmed by agarose gel electrophoresis according to the expected length of the amplicon (RT112; 2850 bps and RT4; 4461 bps). The PCR products obtained as described above were purified and sequenced by the Sanger method. Conventional fluorescent dye chemistry sequencing was performed on an ABI Prism 3130xl Genetic Analyzer (Applied Biosystems, Foster City, CA, USA) according to the manufacturer’s instructions.
Fig 3. FGFR3-TACC3 fusion transcript detection by RT-PCR.
(A) Schematic representation of FGFR3-TACC3 fusion mRNA and PCR primers position. (B) Agarose gel separation of the FGFR3-TACC3 fusion specific RT-PCR amplicons. (C) Sanger sequencing chromatogram of FGFR3-TACC3 fusion specific RT-PCR products. The arrowhead and solid bar indicate breakdown point or region of the 2 genes.
Mutation analysis
Genomic DNA was extracted using a QIAamp DNA FFPE Tissue Kit (Qiagen) according to the manufacturer’s instructions. The DNA concentration for each sample was assessed by a Qubit fluorometer (Thermo Fisher Scientific). Genomic DNA with more than 1.5 ng/μL according to the Qubit fluorometer was subjected to further mutation analysis. The presence of mutations in FGFR3 was analyzed by targeted sequencing using Ion AmpliSeq Cancer Hotspot Panel v2 (Thermo Fisher Scientific). The targeted FGFR3 mutations are listed in S1 Table. For data analysis, Torrent Suite 4.0.2 was used, and mutations were detected by the Variant Caller plugin 4.0–6 with somatic/high stringency configuration provided by Ion Torrent (Thermo Fisher Scientific).
Statistical analysis
Differences among groups were analyzed using Fisher’s exact test. P values of <0.05 were considered to be statistically significant. Statistical analyses were performed using Jmp11 software (SAS Institute Inc., Cary, NC, USA).
Results
Identification of FGFR3-TACC3 fusion transcripts by sequencing and RNA-FISH from xenograft FFPE tissue using human bladder cancer cell lines
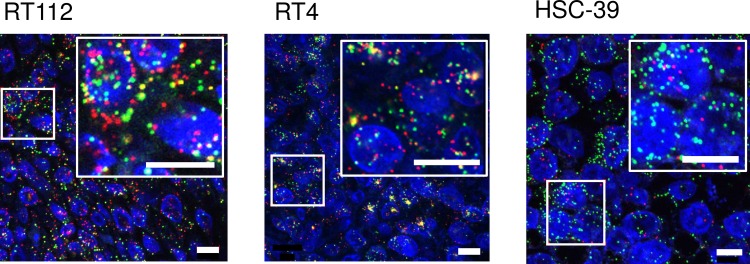
To develop methods to detect FGFR3-TACC3 fusion transcripts, we first tried RT-PCR methods using mouse xenograft models of the human BC cell lines RT112 and RT4. Both cell lines were reported[10] to harbor FGFR3-TACC3 fusion genes. Xenograft tissues were divided into 2 fractions; one was stored frozen, and the other was stored as FFPE tissue. The amplified products of the HPRT housekeeping gene (152 bps) were identified in FFPE samples as well as in frozen tissues. PCR products of FGFR3-TACC3 fusion genes were found at about 2800 bps and 4500 bps in frozen tissues from xenografts of RT112 and RT4, respectively, but not in FFPE samples (Fig 3B). Sequencing of PCR products confirmed that both cell lines harbored the same break-point sequence as previously reported[10] (Fig 3C). Next, we tried RNA-FISH to detect FGFR3 and TACC3 signal using xenograft FFPE tissues of RT112 (fusion-positive control) and RT4 (fusion-positive control) and HSC-39 cells (fusion-negative control). Fluorescent signals for FGFR3 and TACC3 were detected in FFPE samples of all three xenografts. Overlapped/co-localized signals were abundant in xenograft FFPE sections with RT112 and RT4, but barely detected in HSC-39 cells (Fig 4).
Fig 4. FGFR3-TACC3 fusion transcript detection by RNA-FISH.
RNA-FISH image of RT112 and RT4 (fusion-positive controls) and HSC-39 (negative control) xenograft FFPE tissue. mRNAs of FGFR3 and TACC3 were detected by RNA-ISH using fluorescent probes (Alexa 647 for FGFR3 and Alexa 546 for TACC3, respectively), and signals from FGFR3 and TACC3 were shown as red and green, respectively, in the figure. The small boxed areas are enlarged in the adjacent large boxes. Fusion mRNAs appeared in microscope images as yellow, which are merged signals from red and green colors. Cell nuclei was stained with DAPI and shown as blue. Scale bars in the figure are 10 μm. For the detection of fusion signals for each sample, image data from 2 fluorescent probes were analyzed with IN Cell Analyzer 2000 and the number of overlapped/co-localized signals was counted and divided by the total number of FGFR3 signals and TACC3 signals and plotted in a scatter graph.
Detection of FGFR3-TACC3 fusion genes from clinical FFPE samples by RNA-FISH
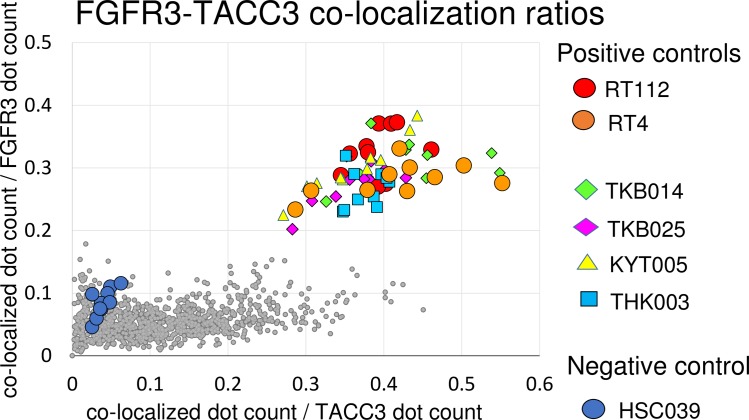
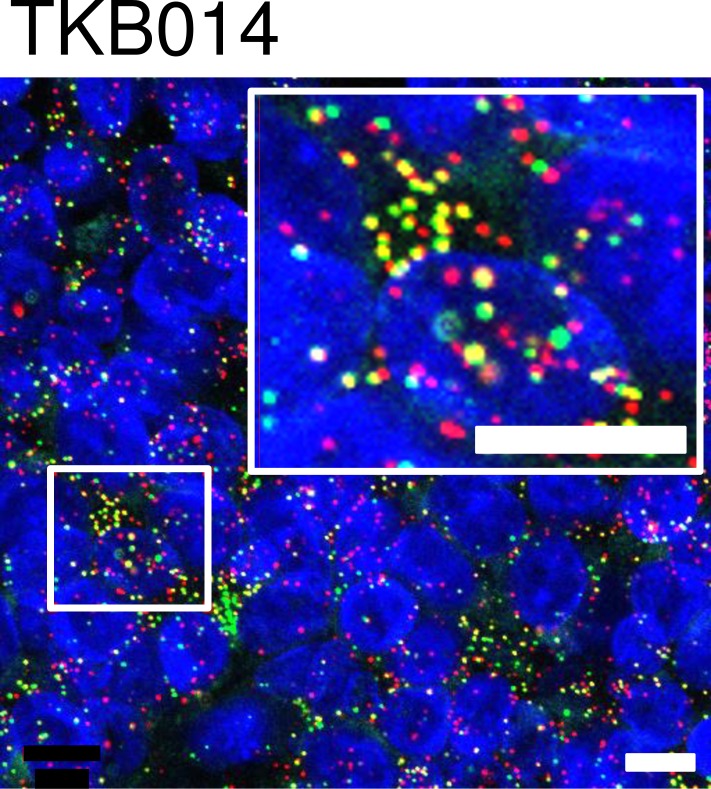
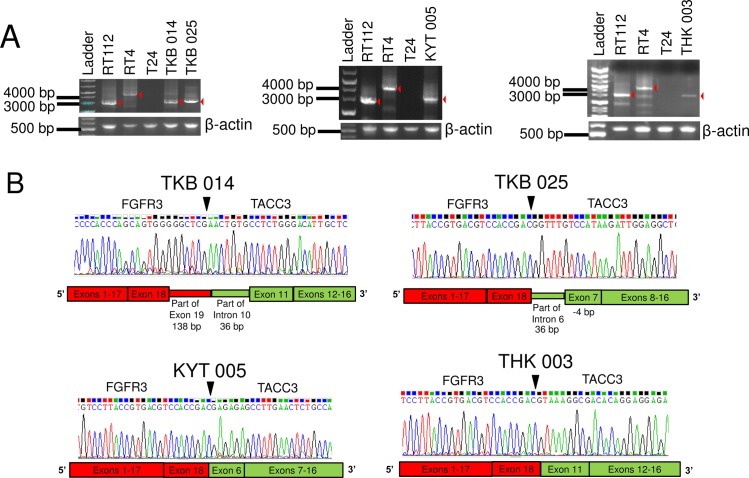
To examine whether RNA-FISH is applicable to human samples, we analyzed 104 BC samples independently by RNA-FISH and Sanger sequencing to detect FGFR3-TACC3 fusions as a prospective cohort study. Tumor samples were freshly collected, and parts of the samples were fixed in 10% formaldehyde for 12–24 hours at room temperature and then embedded in paraffin. For detection of the fusion transcript by RNA-FISH, the number of overlapped/co-localized signals was divided by the number of FGFR3 signals and TACC3 signals, and the quotients were plotted in a scatter graph (Fig 5). The original result of signal count analysis by IN Cell Analyzer 2000 are described in S2 Table. Four of 104 samples and positive controls are plotted in the right upper quadrant (both ratios of co-localized dot count/FGFR3 dot count and co-localized dot count/TACC3 dot count are greater than 0.2). These 4 cases were thought to be fusion positive. A representative photomicrograph of RNA-FISH in the FGFR3-TACC3 fusion-positive sample TKB014 is shown in Fig 6. Small gray dots in Fig 5 represent the cases that were thought to be negative for the fusion gene. Fluorescent signals were very weak in 2 cases (KYT004 and TMC001), so these cases were suspended from fusion analysis by RNA-FISH result. To assess the sensitivity and specificity of RNA-FISH, frozen tissues from all 104 BC were tested using RT-PCR methods. RT-PCR products around 2800–4500 base pairs were identified in all 4 cases with positive signals for fusion genes in RNA-FISH (Fig 7A). Sanger sequencing demonstrated that these 4 cases indeed had FGFR3-TACC3 fusion genes with different break-point sequences (Fig 7B). Two cases were NMIBC, and the remaining 2 cases were MIBC. Positive rates of FGFR3-TACC3 fusion were 2/60 (3%) and 2/44 (5%) in NMIBC and MIBC patients, respectively. The other 98 patients were fusion negative with both PCR and RNA-FISH. The 2 suspended cases of FISH analysis (KYT004 and TMC001) were determined as fusion negative by the RT-PCR result.
Fig 5. Detection of FGFR3-TACC3 fusion genes in FFPE clinical samples by RNA-FISH.
Scatter diagram of FGFR3-TACC3 co-localization ratios of 10 non-overlapping fields for each sample. The number of co-localized signals was divided by the number of FGFR3 signals and TACC3 signals, and the quotients were plotted in Y- and X-axis, respectively. Four samples in the right upper quadrant were thought to be fusion positive by RNA-FISH, and were confirmed as fusion positive by RT-PCR analysis. Small gray dots represent cases that were thought to be negative for the fusion gene.
Fig 6. Representative RNA-FISH images of fusion-positive case TKB014.
The small boxed areas are enlarged in the adjacent large boxes. Scale bars in the figure are 10 μm.
Fig 7. Detection of FGFR3-TACC3 fusion transcripts in clinical samples by RT-PCR.
(A) Agarose gel separation of the FGFR3-TACC3 fusion-specific RT-PCR amplicons. (B) Sanger sequencing chromatogram of FGFR3-TACC3 fusion-specific RT-PCR products. Arrowheads indicate breakdown points of the 2 genes.
Relationship between FGFR3 mutation, FGFR3-TACC3 fusion, and clinical information
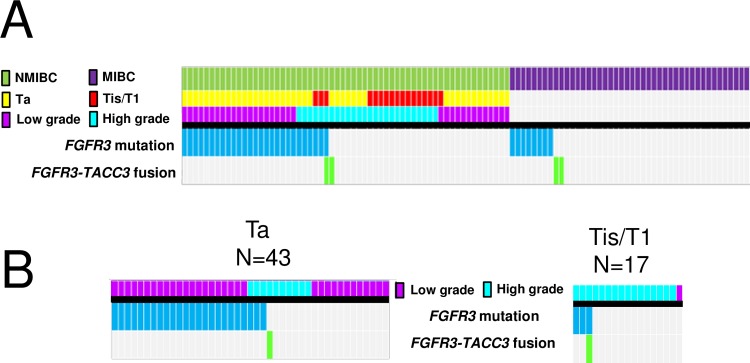
FGFR3 hotspot mutations were detected in 27/60 (45%) and 8/44 (18%) of NMIBC and MIBC cases, respectively (Fig 8A). No mutation was detected in FGFR3 coding regions in 3 of the 4 patients with an FGFR3-TACC3 fusion. One case (TKB025) with an FGFR3-TACC3 fusion gene also had a concomitant mutation in FGFR3 (S249C). In this case, the FGFR3-S249C mutation was detected from tumor FFPE tissue-derived genomic DNA by Ion AmpliSeq Cancer Hotspot Panel v2. However, the corresponding codon in the full-length FGFR3-TACC3 fusion transcript was not altered.
Fig 8. FGFR3 mutation and FGFR3-TACC3 fusion status.
(A) The heatmap shows the distribution of FGFR3 mutations and FGFR3-TACC3 fusions with respect to T stage and pathological grade. (B) Subgroup analysis of NMIBC by T stage.
Among NMIBC cases, FGFR3 mutation/fusion were more frequent (Fig 8A) in low-grade tumors (21/34; 62%) than in high-grade tumors (7/26; 27%) (P = 0.0066). In a subgroup analysis of NMIBC tumors by T stage, FGFR3 mutations/fusions were more frequent in Ta tumors (25/43, 58%) than in T1 tumors (3/16, 19%) (P = 0.034) (Fig 8B). The presence of an FGFR3 mutation/fusion was not associated with tumor size or tumor multiplicity in either NMIBC or MIBC patients.
Discussion
Generally, fusion genes are detected by immunohistochemistry (IHC), FISH, and RT-PCR. IHC assays have demonstrated a wide variation in sensitivity and specificity in FFPE tissues[29]. Specimen processing, antigen retrieval, and immunodetection systems have significant effects on the results of IHC staining[30]. In addition, positive IHC staining does not represent the chimeric fusion protein itself but the expression level of one of the fusion partner genes. In glioblastoma, possible associations between IHC staining of FGFR3 protein and the presence of FGFR3-TACC3 fusion were reported[11][17]. In the present study, 75% of FGFR3-TACC3 fusion-positive tumors showed a high level of FGFR3 protein staining (S1 Appendix). Further studies are needed to confirm this association. In addition, the FGFR3 protein expression level and FGFR3 mutation status were found to be significantly associated[31][32], but 15–26% of FGFR3 mutant tumors showed low levels of FGFR3 expression by IHC. In the present study, 12% of FGFR3 mutant tumors showed a low level of FGFR3 protein staining (S1 Appendix). These cases could be missed if IHC is used as a screening tool for the detection of patients who bear an FGFR3 mutation or FGFR3-TACC3 fusion.
As mentioned in the introduction, genomic DNA-FISH is not a feasible option to detect FGFR3-TACC3 fusion. RNA-FISH is another option to detect fusion transcripts from FFPE tissue. There are several technologies that can be used to detect mRNA transcripts, which include padlock probes/RCA, “smFISH,” and “bDNA-FISH,” as summarized in a previous article[33]. Femino et al. were the first to describe the visualization of single RNA molecules by FISH[34]. Raj et al. improved the original single-molecule RNA FISH (smFISH) using short oligos each labeled with a single fluorophore[35]. “smFISH” was applied by Semrau et al. (FuseFISH)[20] and Markey et al. (Fusion FISH)[19] to detect oncogenic fusion transcripts. In “bDNA-FISH,” multiple pairs of primary probes are required to hybridize in a juxtaposed position (double Z design) in order to proceed with branched DNA hybridization for signal amplification (Fig 2). This contributes increased specificity and reduced background signal. This method is commercially available as a QuantiGene® VeiwRNA kit (Affymetrix) or RNAScope® kit (Advanced Cell Diagnostics). Battich et al. reported that “smFISH” and “bDNA-FISH” demonstrate the same accuracy, but that bDNA-FISH yielded brighter spots with a better signal-to-noise ratio(22).
Here we used this bDNA-FISH-based “QuantiGene® ViewRNA ISH Tissue Assay Kit” to detect fusion mRNA. This assay is suitable for not only fresh tissue, but also archival FFPE tissues. Urdinguio et al. assessed 124 FFPE human colon cancer tissues that had been stored more than 5 years. They confirmed that GM-CSF (granulocyte-macrophage colony-stimulating factor) mRNA was overexpressed in human colorectal cancer using this assay[36]. Weier et al. evaluated the expression level of ETV4 and ETV5 in 83 FFPE human prostate cancer tissue samples that had been stored 8 to 19 years[37]. In this study, we developed an RNA-FISH assay using bDNA probe to detect FGFR3-TACC3 fusion and assessed its sensitivity and specificity using FFPE human samples. The results of RNA-FISH using FFPE sections were identical to those obtained by RT-PCR using frozen tissues, indicating that RNA-FISH is a feasible assay for screening for FGFR3-TACC3 fusion. Our data suggested that an RNA-FISH for fusion genes might be feasible for screening other fusion genes when genomic DNA-FISH lacks utility.
RT-PCR was thought to be another option to detect FGFR3-TACC3 fusion transcripts in FFPE tissue. To detect all known and possibly new variants of FGFR3-TACC3 fusions, the forward primer needs to recognize a sequence upstream of exon 18 of the FGFR3 and the reverse primer downstream of exon 13 of the TACC3. The size of the PCR amplicon using this primer pair varies by case from between 100 to more than 1,000 base pairs. RNA obtained from FFPE tissues is generally highly degraded, making it difficult to detect a PCR amplicon of several hundred base pairs or more. Even if we design a multiplex PCR primer to cover to all known combinations of exons on the FGFR3 and TACC3, the expected length of the PCR amplicon varies by case for the following reasons. First, the genomic break point could be different in each case. Second, introns could be inserted between the genomic break point of the FGFR3 and TACC3 genes in some cases[27]. Actually, 36 bps of intron 10 of the TACC3 gene were inserted into fusion mRNA in TKB014 in our study. Thus, the expected lengths of PCR amplicons of the ready-made multiplex PCR primer for each exon were unequal and predisposed to give a false negative. Recently, targeted sequencing using next-generation sequencing was applied for detection of fusion genes. Ross et al. applied targeted sequencing to FFPE tissues of 35 UC patients, and the FGFR3-TACC3 fusion was detected in one patient[38]. Targeted sequencing might be an option to detect fusion genes when fusion partners are already known.
In previous studies, the frequencies of FGFR3 mutations were 60–80% of the low-grade NMIBC and 5–20% of the invasive tumors[2][39][40][41][42], which is consistent with the results of the present study. As reported in many previous studies[43][44], the proportion of cases having an FGFR3 mutation decreased with increasing stage and grade. In this study, FGFR3-TACC3 fusion genes were present in 2/60 (3%) of NMIBC and 2/44 (5%) of MIBC cases. In previous studies, the fusion was detected in 6% (1/17) of NMIBC cases[45] and 2–4% (3/129[46], 2/46[10], 1/25[45], and 1/35[38]) of MIBC cases. These results are consistent with the present study. Both FGFR3-TACC3 fusion and FGFR3-S249C mutation were positive in case TKB025. The full-length FGFR3-TACC3 fusion transcript in this case did not involve a FGFR3-S249C mutation. This result may indicate the presence of tumor heterogeneity of a wildtype codon 249, fusion-positive clone and codon 249 mutant, fusion negative clone. In another study, 2 different FGFR3 mutations were detected in a single case[47]. The association between the presence of an FGFR3-TACC3 fusion gene and the prognosis of UC is still unclear. We plan to follow the subjects of this prospective study with detailed clinical information for three years. In the future, we hope we can provide additional evidence.
The selection of an optimal drug is determined by the genetic profile of some cancers, including lung cancer, breast cancer, and leukemia. Patient selection by molecular foundation is not yet indicated for metastatic UC. Significant clinical responses were reported in FGFR3-TACC3 fusion-positive cervical cancer patients and glioma patients treated with an FGFR inhibitor[11][14]. However, the FGFR3 mutation is not very frequent among metastatic UC patients, comprising about 6–18% (2/35[38], 2/11[47], and 3/33[48]). The screening of not only the FGFR3 mutation, but also the FGFR3-TACC3 fusion gene makes it possible to find additional responders to FGFR inhibitors.
A limitation of this method is that it cannot detect fusions other than FGFR3-TACC3. BAIAP2L1(BAI1-associated protein 2-like 1) was reported as another fusion partner of FGFR3 in lung cancer patients[49] and BC cell lines[10]. The fusion gene leads to a constitutive activation of the FGFR3 tyrosine kinase domain. An FGFR3-BAIAP2L1 fusion-positive cell line showed sensitivity to an FGFR inhibitor in vitro[50]. In this study, the FGFR3-BAIAP2L1 fusion gene was not examined. The association between the FGFR3-BAIAP2L1 fusion and clinical stages of UC is still unclear. The importance of the detection for this fusion will be determined by further investigation of its frequency in BC. The BAIAP2L1 gene is located on chromosome 7 at position 7q22.1, which is a different chromosome from the location of the FGFR3 gene. The FGFR3-BAIAP2L1 fusion has been detected by DNA-FISH, which is easily applied to clinical cases[10][50].
Conclusions
In this study, we applied an RNA-FISH assay to detect FGFR3-TACC3 fusion transcripts in 104 FFPE BC tissues. We demonstrated that RNA-FISH is a feasible assay to screen for the FGFR3-TACC3 fusion. We also analyzed the association of FGFR3 mutation/fusion status and clinical information in a prospective multicenter cohort of 104 patients with a clinical diagnosis of BC. The efficiency of the bDNA-FISH assay needs to be confirmed in a larger series of cases and possibly compared with the smFISH methodology that has also been reported to be an accurate approach for the detection of fusion transcripts, before it could be considered the technique of choice to identify additional responders to FGFR inhibitors.
Supporting Information
(DOCX)
(TIF)
Scale bar = 5 mm.
(TIF)
(A) Staining pattern 0; (B) staining pattern 1; (C) staining pattern 2; (D) staining pattern 3. Scale bars = 100 μm.
(TIF)
Dark blue bars = High, Light blue bars = Low.
(TIF)
(DOCX)
The original excel file is available at: http://tools.invitrogen.com/downloads/cms_106003.csv
(XLSX)
(XLSX)
(XLSX)
Acknowledgments
We are grateful to Dr. Hiroyuki Tsunemori, Dr Taeko Matsuoka and Dr. Naoto Keino for their valuable contributions to the collection of materials and clinical information. We thank Noriko Kunita, Taeko Asano and Jun Itadani for their excellent technical assistance.
Data Availability
All relevant data are within the paper and its Supporting Information files.
Funding Statement
The study was funded by Astellas (H.N.), and designed and analyzed by the authors in collaboration with Astellas. Astellas had a role in the design and conduct of the study; management, analysis, and interpretation of the data; and preparation, review, and approval of the manuscript. This work was also supported in part by a Grant-in-Aid for Challenging Exploratory Research (H.N.) (grant number 26670696) and a Grant-in-Aid for Scientific Research B (H.N.) (grant number 26293349) from the Japan Society for the Promotion of Science (JSPS) (https://www.jsps.go.jp/english/). The JSPS had no role in study design, data collection and analysis, decision to publish, or preparation of the manuscript.
References
- 1.van Rhijn BW, van Tilborg AA, Lurkin I, Bonaventure J, de Vries A, Thiery JP, et al. Novel fibroblast growth factor receptor 3 (FGFR3) mutations in bladder cancer previously identified in non-lethal skeletal disorders. Eur J Hum Genet 2002;10:819–824. 10.1038/sj.ejhg.5200883 [DOI] [PubMed] [Google Scholar]
- 2.Knowles MA, Hurst CD. Molecular biology of bladder cancer: new insights into pathogenesis and clinical diversity. Nat Rev Cancer 2015; 15:25–41. 10.1038/nrc3817 [DOI] [PubMed] [Google Scholar]
- 3.Tomlinson DC, Baldo O, Harnden P, Knowles MA. FGFR3 protein expression and its relationship to mutation status and prognostic variables in bladder cancer. J Pathol 2007;213:91–98. 10.1002/path.2207 [DOI] [PMC free article] [PubMed] [Google Scholar]
- 4.Adar R, Monsonego-Ornan E, David P, Yayon A. Differential activation of cysteine-substitution mutants of fibroblast growth factor receptor 3 is determined by cysteine localization. J Bone Miner Res 2002;17:860–868. 10.1359/jbmr.2002.17.5.860 [DOI] [PubMed] [Google Scholar]
- 5.d'Avis PY, Robertson SC, Meyer AN, Bardwell WM, Webster MK, Donoghue DJ. Constitutive activation of fibroblast growth factor receptor 3 by mutations responsible for the lethal skeletal dysplasia thanatophoric dysplasia type I. Cell Growth Differ 1998;9:71–78. [PubMed] [Google Scholar]
- 6.Webster MK, D'Avis PY, Robertson SC, Donoghue DJ. Profound ligand-independent kinase activation of fibroblast growth factor receptor 3 by the activation loop mutation responsible for a lethal skeletal dysplasia, thanatophoric dysplasia type II. Mol Cell Biol 1996;16:4081–4087. [DOI] [PMC free article] [PubMed] [Google Scholar]
- 7.Singh D, Chan JM, Zoppoli P, Niola F, Sullivan R, Iavarone A, et al. Transforming fusions of FGFR and TACC genes in human glioblastoma. Science 2012; 337:1231–1235. 10.1126/science.1220834 [DOI] [PMC free article] [PubMed] [Google Scholar]
- 8.Wu YM, Su F, Kalyana-Sundaram S, Khazanov N, Ateeq B, Chinnaiyan AM, et al. Identification of targetable FGFR gene fusions in diverse cancers. Cancer Discov 2013;3:636–647. 10.1158/2159-8290.CD-13-0050 [DOI] [PMC free article] [PubMed] [Google Scholar]
- 9.Majewski IJ, Mittempergher L, Davidson NM, Bosma A, Willems SM, Bernards R, et al. Identification of recurrent FGFR3 fusion genes in lung cancer through kinome-centred RNA sequencing. J Pathol. 2013;230:270–276. 10.1002/path.4209 [DOI] [PubMed] [Google Scholar]
- 10.Williams SV, Hurst CD, Knowles MA. Oncogenic FGFR3 gene fusions in bladder cancer. Hum Mol Genet 2013;22:795–803. 10.1093/hmg/dds486 [DOI] [PMC free article] [PubMed] [Google Scholar]
- 11.Di Stefano AL, Fucci A, Frattini V, Labussiere M, Mokhtari K, Iavarone A, et al. Detection, Characterization, and Inhibition of FGFR-TACC Fusions in IDH Wild-type Glioma. Clin Cancer Res 2015;21:3307–3317. 10.1158/1078-0432.CCR-14-2199 [DOI] [PMC free article] [PubMed] [Google Scholar]
- 12.Tomlinson DC, Hurst CD, Knowles MA. Knockdown by shRNA identifies S249C mutant FGFR3 as a potential therapeutic target in bladder cancer. Oncogene 2007;26:5889–5899. 10.1038/sj.onc.1210399 [DOI] [PMC free article] [PubMed] [Google Scholar]
- 13.Bernard-Pierrot I, Brams A, Dunois-Lardé C, Caillault A, Diez de Medina SG, Radvanyi F, et al. Oncogenic properties of the mutated forms of fibroblast growth factor receptor 3b. Carcinogenesis 2006;27:740–747. 10.1093/carcin/bgi290 [DOI] [PubMed] [Google Scholar]
- 14.Carneiro BA, Elvin JA, Kamath SD, Ali SM, Paintal AS, Johnson ML, et al. FGFR3-TACC3: A novel gene fusion in cervical cancer. Gynecol Oncol Rep 2015;13:53–56. 10.1016/j.gore.2015.06.005 [DOI] [PMC free article] [PubMed] [Google Scholar]
- 15.Tkachuk DC, Westbrook CA, Andreeff M, Donlon TA, Cleary ML, Pinkel D, et al. Detection of bcr-abl fusion in chronic myelogeneous leukemia by in situ hybridization. Science 1990;250:559–562. [DOI] [PubMed] [Google Scholar]
- 16.Perner S, Wagner PL, Demichelis F, Mehra R, Lafargue CJ, Rubin MA, et al. EML4-ALK fusion lung cancer: a rare acquired event. Neoplasia 2008;10:298–302. [DOI] [PMC free article] [PubMed] [Google Scholar]
- 17.Parker BC, Annala MJ, Cogdell DE, Granberg KJ, Sun Y, Zhang W, et al. The tumorigenic FGFR3-TACC3 gene fusion escapes miR-99a regulation in glioblastoma. J Clin Invest 2013;123:855–865. 10.1172/JCI67144 [DOI] [PMC free article] [PubMed] [Google Scholar]
- 18.Kiflemariam S, Mignardi M, Ali MA, Bergh A, Nilsson M, Sjöblom T. In situ sequencing identifies TMPRSS2-ERG fusion transcripts, somatic point mutations and gene expression levels in prostate cancers. J Pathol 2014;234:253–261. 10.1002/path.4392 [DOI] [PubMed] [Google Scholar]
- 19.Markey FB, Ruezinsky W, Tyagi S, Batish M. Fusion FISH imaging: single-molecule detection of gene fusion transcripts in situ. PLoS One 2014;9:e93488 10.1371/journal.pone.0093488 [DOI] [PMC free article] [PubMed] [Google Scholar]
- 20.Semrau S, Crosetto N, Bienko M, Boni M, Bernasconi P, van Oudenaarden A, et al. FuseFISH: robust detection of transcribed gene fusions in single cells. Cell Rep 2014;6:18–23. 10.1016/j.celrep.2013.12.002 [DOI] [PMC free article] [PubMed] [Google Scholar]
- 21.Lu B, Maqsodi B, Yang W, McMaster GK, Perner S, Sanda MG, et al. Detection of TMPRSS2-ERG fusion gene expression in prostate cancer specimens by a novel assay using branched DNA. Urology 2009;74:1156–1161. 10.1016/j.urology.2009.01.087 [DOI] [PMC free article] [PubMed] [Google Scholar]
- 22.Battich N, Stoeger T, Pelkmans L. Image-based transcriptomics in thousands of single human cells at single-molecule resolution. Nat Methods 2013;10:1127–1133. 10.1038/nmeth.2657 [DOI] [PubMed] [Google Scholar]
- 23.Marshall CJ, Franks LM, Carbonell AW. Markers of neoplastic transformation in epithelial cell lines derived from human carcinomas. J Natl Cancer Inst 1977;58:1743–1751. [DOI] [PubMed] [Google Scholar]
- 24.Rigby CC, Franks LM. A human tissue culture cell line from a transitional cell tumour of the urinary bladder: growth, chromosone pattern and ultrastructure. Br J Cancer 1970;24:746–754. [DOI] [PMC free article] [PubMed] [Google Scholar]
- 25.Bubeník J, Baresová M, Viklický V, Jakoubková J, Sainerová H, Donner J, et al. Established cell line of urinary bladder carcinoma (T24) containing tumour-specific antigen. Int J Cancer 1973;11:765–773. [DOI] [PubMed] [Google Scholar]
- 26.Yanagihara K, Seyama T, Tsumuraya M, Kamada N, Yokoro K. Establishment and characterization of human signet ring cell gastric carcinoma cell lines with amplification of the c-myc oncogene. Cancer Res 1991;51:381–386. [PubMed] [Google Scholar]
- 27.COSMIC. Available at: http://cancer.sanger.ac.uk/cosmic/gene/analysis?ln=FGFR3
- 28.Blast the human Genome. Available at: http://www.ncbi.nlm.nih.gov/genome/seq/hsBlast.html
- 29.Elliott K, McQuaid S, Salto-Tellez M, Maxwell P. Immunohistochemistry should undergo robust validation equivalent to that of molecular diagnostics. J Clin Pathol 2015;68:766–770. 10.1136/jclinpath-2015-203178 [DOI] [PubMed] [Google Scholar]
- 30.Hayat M A. Handbook of Immunohistochemistry and in situ Hybridization of Human Carcinomas, volume 1, p8, Academic Press; 2006. [Google Scholar]
- 31.Poyet C, Hermanns T, Zhong Q, Drescher E, Eberli D, Wild PJ, et al. Positive fibroblast growth factor receptor 3 immunoreactivity is associated with low-grade non-invasive urothelial bladder cancer. Oncol Lett 2015;10:2753–2760. 10.3892/ol.2015.3691 [DOI] [PMC free article] [PubMed] [Google Scholar]
- 32.Tomlinson DC, Baldo O, Harnden P, Knowles MA. FGFR3 protein expression and its relationship to mutation status and prognostic variables in bladder cancer. J Pathol 2007;213:91–98. 10.1002/path.2207 [DOI] [PMC free article] [PubMed] [Google Scholar]
- 33.Kwon S, Single-molecule fluorescence in situ hybridization: quantitative imaging of single RNA molecules. BMB Rep 2013;46:65–72. 10.5483/BMBRep.2013.46.2.016 [DOI] [PMC free article] [PubMed] [Google Scholar]
- 34.Femino AM, Fay FS, Fogarty K, Singer RH. Visualization of single RNA transcripts in situ. Science 1998;280:585–590. [DOI] [PubMed] [Google Scholar]
- 35.Raj A, van den Bogaard P, Rifkin SA, van Oudenaarden A, Tyagi S. Imaging individual mRNA molecules using multiple singly labeled probes. Nat Methods 2008;5:877–879. 10.1038/nmeth.1253 [DOI] [PMC free article] [PubMed] [Google Scholar]
- 36.Urdinguio RG, Fernandez AF, Moncada-Pazos A, Huidobro C, Rodriguez RM, Fraga MF, et al. Immune-dependent and independent antitumor activity of GM-CSF aberrantly expressed by mouse and human colorectal tumors. Cancer Res 2013;73:395–405. 10.1158/0008-5472.CAN-12-0806 [DOI] [PubMed] [Google Scholar]
- 37.Weier C, Haffner MC, Mosbruger T, Esopi DM, Hicks J, Yegnasubramanian S, et al. Nucleotide resolution analysis of TMPRSS2 and ERG rearrangements in prostate cancer. J Pathol 2013;230:174–183. 10.1002/path.4186 [DOI] [PMC free article] [PubMed] [Google Scholar]
- 38.Ross JS, Wang K, Al-Rohil RN, Nazeer T, Sheehan CE, Stephens PJ, et al. Advanced urothelial carcinoma: next-generation sequencing reveals diverse genomic alterations and targets of therapy. Mod Pathol 2014;27:271–280. 10.1038/modpathol.2013.135 [DOI] [PubMed] [Google Scholar]
- 39.Rieger-Christ KM, Mourtzinos A, Lee PJ, Zagha RM, Cain J, Summerhayes IC, et al. Identification of fibroblast growth factor receptor 3 mutations in urine sediment DNA samples complements cytology in bladder tumor detection. Cancer 2003;98:737–744. 10.1002/cncr.11536 [DOI] [PubMed] [Google Scholar]
- 40.van Rhijn BW, van der Kwast TH, Vis AN, Kirkels WJ, Boevé ER, Zwarthoff EC, et al. FGFR3 and P53 characterize alternative genetic pathways in the pathogenesis of urothelial cell carcinoma. Cancer Res 2004;64:1911–1914. [DOI] [PubMed] [Google Scholar]
- 41.Bakkar AA, Wallerand H, Radvanyi F, Lahaye JB, Pissard S, de Medina SG, et al. FGFR3 and TP53 gene mutations define two distinct pathways in urothelial cell carcinoma of the bladder. Cancer Res 2003;63:8108–8112. [PubMed] [Google Scholar]
- 42.Al-Ahmadie HA, Iyer G, Janakiraman M, Lin O, Heguy A, Tickoo SK, et al. Somatic mutation of fibroblast growth factor receptor-3 (FGFR3) defines a distinct morphological subtype of high-grade urothelial carcinoma. J Pathol 2011;224:270–279. 10.1002/path.2892 [DOI] [PMC free article] [PubMed] [Google Scholar]
- 43.Billerey C, Chopin D, Aubriot-Lorton MH, Ricol D, Gil Diez de Medina S, Van Rhijn B, Bralet MP, et al. Frequent FGFR3 mutations in papillary non-invasive bladder (pTa) tumors. Am J Pathol 2001;158:1955–1959. 10.1016/S0002-9440(10)64665-2 [DOI] [PMC free article] [PubMed] [Google Scholar]
- 44.Kimura T, Suzuki H, Ohashi T, Asano K, Kiyota H, Eto Y, et al. The incidence of thanatophoric dysplasia mutations in FGFR3 gene is higher in low-grade or superficial bladder carcinomas. Cancer 2001;92:2555–2561. [DOI] [PubMed] [Google Scholar]
- 45.Guo G, Sun X, Chen C, Wu S, Huang P, Li Z, et al. Whole-genome and whole-exome sequencing of bladder cancer identifies frequent alterations in genes involved in sister chromatid cohesion and segregation. Nat Genet 2013;45:1459–1463. 10.1038/ng.2798 [DOI] [PMC free article] [PubMed] [Google Scholar]
- 46.Cancer Genome Atlas Research Network. Comprehensive molecular characterization of urothelial bladder carcinoma. Nature 2014;507:315–322. 10.1038/nature12965 [DOI] [PMC free article] [PubMed] [Google Scholar]
- 47.Smal MP, Rolevich AI, Polyakov SL, Krasny SA, Goncharova RI. FGFR3 and TP53 mutations in a prospective cohort of Belarusian bladder cancer patients. Exp Oncol 2014;36:246–251. [PubMed] [Google Scholar]
- 48.Guancial EA, Werner L, Bellmunt J, Bamias A, Choueiri TK, Ross R, et al. FGFR3 expression in primary and metastatic urothelial carcinoma of the bladder. Cancer Med 2014;3:835–844. 10.1002/cam4.262 [DOI] [PMC free article] [PubMed] [Google Scholar]
- 49.Shinmura K, Kato H, Matsuura S, Inoue Y, Igarashi H, Nagura K, et al. A novel somatic FGFR3 mutation in primary lung cancer. Oncol Rep 2014;31:1219–1224. 10.3892/or.2014.2984 [DOI] [PubMed] [Google Scholar]
- 50.Nakanishi Y, Akiyama N, Tsukaguchi T, Fujii T, Satoh Y, Ishii N, et al. Mechanism of Oncogenic Signal Activation by the Novel Fusion Kinase FGFR3-BAIAP2L1. Mol Cancer Ther 2015;14:704–712. 10.1158/1535-7163.MCT-14-0927-T [DOI] [PubMed] [Google Scholar]
Associated Data
This section collects any data citations, data availability statements, or supplementary materials included in this article.
Supplementary Materials
(DOCX)
(TIF)
Scale bar = 5 mm.
(TIF)
(A) Staining pattern 0; (B) staining pattern 1; (C) staining pattern 2; (D) staining pattern 3. Scale bars = 100 μm.
(TIF)
Dark blue bars = High, Light blue bars = Low.
(TIF)
(DOCX)
The original excel file is available at: http://tools.invitrogen.com/downloads/cms_106003.csv
(XLSX)
(XLSX)
(XLSX)
Data Availability Statement
All relevant data are within the paper and its Supporting Information files.


