Abstract
Objective
The aim of this study was to systematically investigate the course of magnetic resonance (MR) signal intensity (SI) changes that occur in noncirrhotic livers after irreversible electroporation (IRE) of liver metastases.
Methods
This study is an institutional review board–approved prospective longitudinal follow-up study on 27 patients with 37 liver metastases who underwent computed tomography–guided percutaneous IRE and a standardized follow-up protocol by serial hepatic MR imaging studies that consisted of a gadobutrol-enhanced dynamic series, axial T2-weighted (T2w) turbo spin echo, and diffusion-weighted imaging (b = 0/50/800), acquired before, within 2, and at 24 hours after IRE; at 1, 2, 4, 6, 8, and 12 weeks after IRE; and every 3 months thereafter for a follow-up of at least 12 months.
Results
The ablated target lesion remained visible within the ablation zone in 23 (62%) of 37 of cases for a mean time of 21 ± 20 weeks (median, 12 weeks). The ablation zone appeared homogeneously hyperintense on T2w turbo spin echo images on the day of IRE in 37 of 37 cases. By 24 hours after IRE, the ablation zone inverted its SI in 35 of 37 cases to intermediately hypointense, with a rim of T2w bright SI that exhibited arterial phase enhancement; this persisted for 7 ± 5 weeks (median, 4 weeks). The rim resolved in 35 (95%) of 37 cases within 3 months. The ablation zone increased slightly over the first 48 hours, then shrank progressively. Complete healing of the ablation zone was observed in 57% (21/37) after an average of 14 ± 15 (median, 8 weeks).
Average apparent diffusion coefficient values of the ablation zone decreased from 0.74 ± 0.36 × 10⁻³ mm2/s pre-IRE to 0.63 ± 0.27 × 10⁻³ mm2/s within the first 24 hours (P < 0.05), followed by a progressive normalization to 0.91 ± 0.30 × 10⁻³ mm2/s at 2 months.
Conclusions
Knowledge of the broad spectrum of MR imaging findings after IRE is important to avoid diagnostic errors in the follow-up of patients after IRE.
Key Words: electroporation, ablation techniques, magnetic resonance imaging, treatment outcome
Irreversible electroporation (IRE) is a new local ablative technique that works by imposing high-magnitude electric pulses across the target tissue volume. The electric pulses induce cell membrane nanopores that allow a transmembrane movement of molecules, which, in turn, will lead to a reduced gradient of the transmembrane electric potential. If sufficient levels of energy are delivered, these nanopores become permanent, and the cell enters apoptosis.1–4 The local ablative effect induced by IRE is therefore considered completely or at least mainly5 nonthermal. Thus, IRE should offer specific advantages compared with thermal ablation methods such as microwave ablation (MWA) and radiofrequency ablation (RFA)6 in that its efficacy is not impaired by heat sink effects and should preserve the extracellular matrix of tissues such as blood vessels or bile ducts.7 Because the extracellular matrix is preserved, IRE ablation zones in the liver will typically undergo progressive “healing,” that is, the ablation zone will be repopulated by normal hepatocytes. Therefore, the imaging appearance of the IRE ablation zone, where controlled apoptosis is the main therapy-induced effect, differs significantly from the imaging sequel after RFA or MWA, where coagulation necrosis and scar formation is the predominant effect.
Several studies have described the imaging effects, seen on (contrast enhanced) ultrasound as well as computed tomography (CT) and magnetic resonance imaging (MRI), during or immediately after IRE therapy.8–12 However, imaging studies regarding intermediate-term and long-term follow-up are scarce and, except 1 study describing the imaging effects after IRE of hepatocellular carcinoma (HCC) in cirrhotic liver, stem from small animal models.13,14
We therefore conducted a systematic longitudinal MRI follow-up study in noncirrhotic patients, treated by hepatic IRE for secondary liver cancer. The aim was to investigate the typical course of healing of the ablation zone after percutaneous hepatic IRE of liver metastases, to establish the normal course of signal intensity (SI) changes that occurs in the immediate postinterventional period, as well as during short-, intermediate-, and long-term follow-up in a noncirrhotic liver. Long-term goal is to identify criteria that are useful to identify incomplete ablation and/or local recurrences.
MATERIALS AND METHODS
This institutional review board–approved prospective longitudinal observational diagnostic study was performed at an academic comprehensive cancer center.
Inclusion Criteria and Study Protocol
We included consecutive patients who underwent percutaneous CT-guided IRE for ablation of liver malignancies over a 3-year period (2012 through 2015). Our institution has an established clinical service for several ablative methods, including RFA, MWA, and IRE. The decision to perform hepatic tumor ablation was made for each patient by a multidisciplinary tumor board attended by hepatobiliary surgeons, gastroenterologists, oncologists, radiation therapists, and radiologists, with inclusion criteria that correspond to international practice guidelines as follows:
no surgical candidate,
without prognostically relevant extrahepatic tumor burden, and
with preserved liver function, normal coagulation status (quick >50%), and Eastern Cooperative Oncology Group 0/1 status.
The choice between the different ablative techniques is at the discretion of the interventional radiologist and follows internal standard operating procedures set up within the Department of Diagnostic and Interventional Radiology. This SOP defines that hepatic IRE should be used in patients with primary or secondary liver malignancies that:
deem not suitable for RFA or MWA due to a close proximity (<0.5 cm) to major hepatic or portal vein branches or bile duct structures,
occur in patients with no more than 3 malignant liver lesions, each less than 4 cm in size, and
IRE is also the preferred ablative technique in patients with local recurrencies after major liver surgery (hepatectomy or trisectorectomy); that is, patients with limited residual venous or biliary drainage or portal vein supply pathways.
Patients underwent gadobutrol-enhanced liver MRI (Gadovist; Bayer Schering Pharma AG, Berlin, Germany) according to a standardized follow-up protocol within 4 weeks before treatment, then within 2 hours after IRE, at 24 hours after IRE, at 1 week after IRE, then at 2, 4, 6, 8, and 12 weeks after IRE, and every 3 months thereafter.
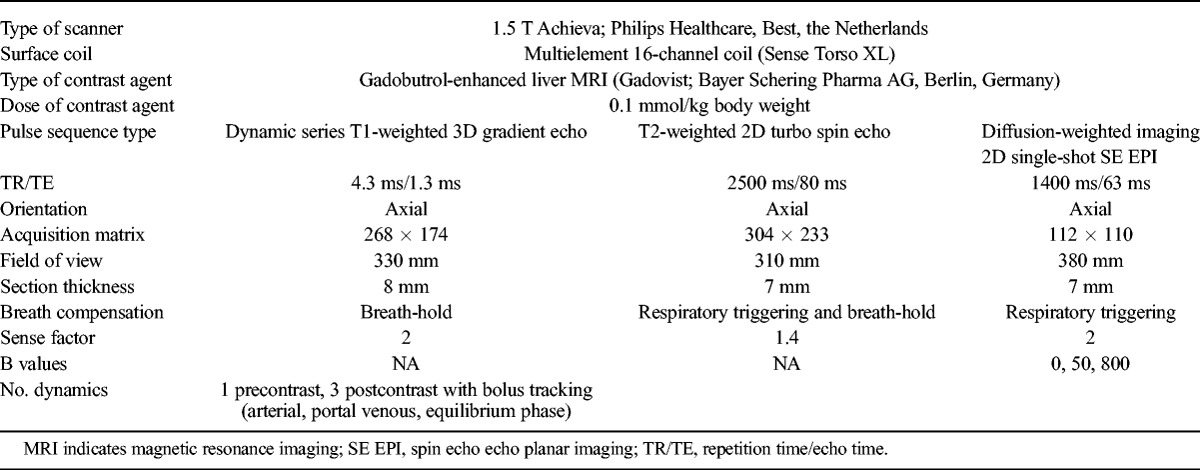
All MRI examinations were performed on a 1.5 T system (Achieva; Philips Healthcare, Best, the Netherlands). The standardized pulse sequence protocol is given in Table 1.
TABLE 1.
MRI Pulse Sequences
IRE Procedure
Irreversible electroporation was performed in close accordance with recommended practice standards under general anesthesia and deep relaxation. Depending on lesion size and shape, between two and five 19-gauge, unipolar IRE probes (NanoKnife; AngioDynamics, Amsterdam, the Netherlands) with an active tip length of 1.5 to 2.5 cm were placed strictly parallel under CT guidance. Before pulse application, a CT scan covering the target lesion was acquired to validate correct electrode positioning. Irreversible electroporation was performed with 70 pulses per electrode pair, a pulse length of 70 to 90 μs, and a maximum voltage of 3000 V with electrocardiographic gating.
Image Analysis
All MRI scans of each patient were systematically analyzed by 5 readers with 20, 11, 10, 9, and 5 years of experience in local ablation techniques and liver MRI. Parameters assessed were:
Qualitative (visual) metrics:
Visibility of the ablation zone on T2-weighted (T2w) MRI
Visibility of the target lesion within the ablation zone
Internal architecture of the ablation zone, that is, its SI pattern on T2w MRI
Presence or absence of contrast enhancement of the ablation zone
Quantitative metrics:
Volume of the IRE ablation zone on T2w MRI scans
Apparent diffusion coefficient (ADC) values of the target lesion before IRE and of the ablation zone (which includes the target lesion) after IRE
Because we aimed to establish normal values for post-IRE ADC, data sets of patients with incomplete ablation were not included in the analysis.
All image analyses and measurements were done on a dedicated workstation (Imalytics; Philips Medical Imaging, Best, the Netherlands). In accordance with current guidelines,15 the initial tumor volume as well as the ablation zone volume was measured by manual rendering, so that volumes of interest were generated. Care was taken to avoid partial volume averaging due to inclusion of adjacent normal liver tissue.
Histopathological analysis performed in small animal models showed early inflammatory reaction within the first 7 days after IRE. This period is followed by scar formation and enhanced local immune response or regeneration, which could be found until 4 weeks after IRE, at least.14,17 Therefore, we decided to categorize MRI findings into early (findings in the MRI studies on the day of IRE, 24 hours after IRE, and 1 week after IRE), intermediate (findings in the MRI examinations done at 2, 4, 6, and 8 weeks after IRE), and late changes (findings in MRI studies acquired at 3, 6, 12 months and beyond after IRE).
Statistical Analysis
Continuous variables (tumor and ablation zone volumes and ADC values) are expressed as mean values ± standard deviation. For comparison of target lesion sizes, the unpaired Wilcoxon test was used. For comparison of ADC values at different time points, the paired Wilcoxon test was used. All test results were analyzed in an explorative way; thus, P values of P ≤ 0.05 were regarded as statistically significant. All statistical analyses were conducted using the Statistical Analysis System (SAS Version 9.2; SAS Institute, Cary, NC) and R (R Version 2.11.1. Copyright 2010 The R Foundation for Statistical Computing).
RESULTS
Patient and Target Lesion Characteristics
Twenty-seven patients with a total of 37 secondary liver malignancies were included (Table 2). The mean age was 62 ± 11 years (range, 46–68; median age, 64 years). The primary tumors were colorectal cancer in 15 patients; breast in 4; pancreatic and esophageal cancer in 2 each; and gastrointestinal stromal tumor, malignant melanoma, mesothelioma, and renal cell cancer in 1 patient each. Mean follow-up time is 23 ± 11 months.
TABLE 2.
Characteristics of the Study Cohort
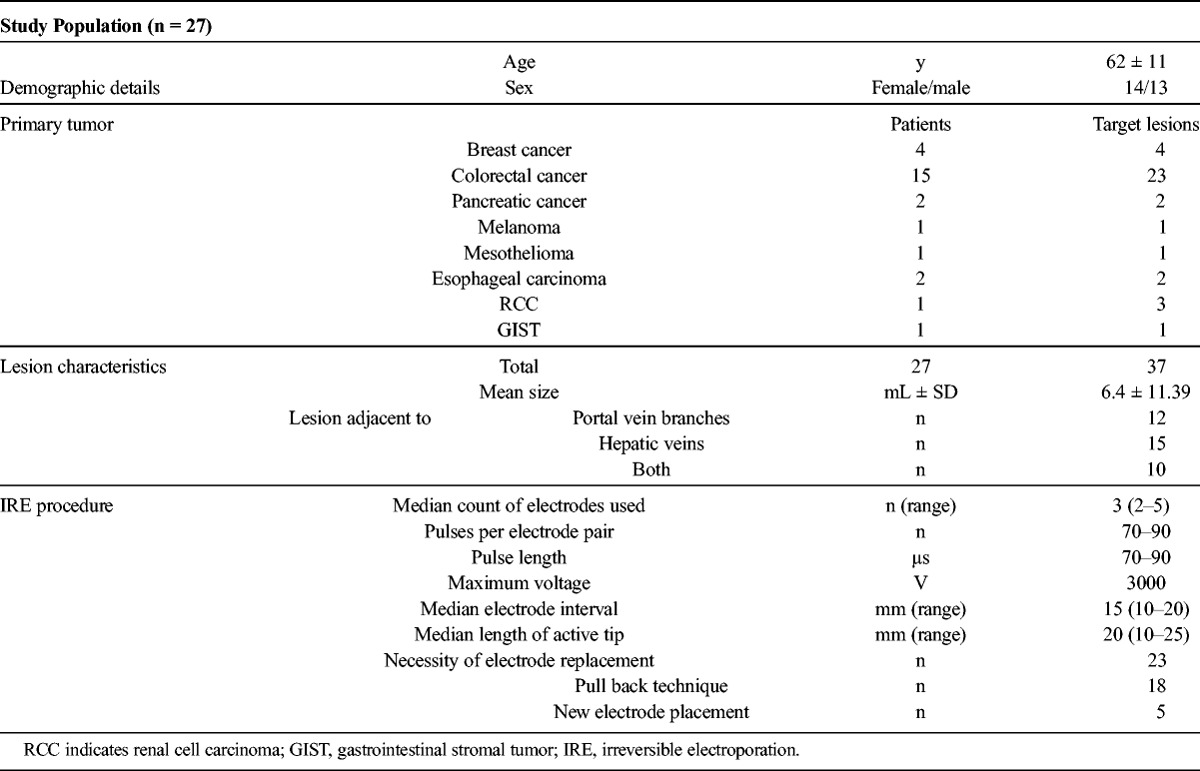
Mean target lesion volume measured on preinterventional T2w turbo spin echo (TSE) images was 6.4 ± 11.4 mL (range, 0.1–45.0 mL; median, 1.5 mL). Target lesions were located immediately adjacent to major hepatic veins (n = 15), portal vein branches (n = 12), both (n = 10), and therefore were regarded not suitable for RFA or MWA.
MRI Patterns After IRE
Typical patterns of the temporal evolution of T2w-TSE and T1w-DCE imaging findings after IRE are provided in Figures 1, 2, and 3. Results of the temporal evolution of changes of the ablation zone size and of the ablation zone average ADC values are depicted in Figures 4 and 5.
FIGURE 1.
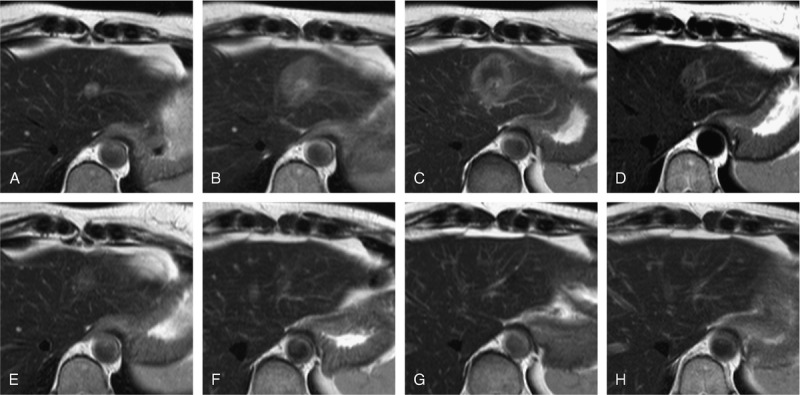
MRI patterns after IRE—T2w TSE. A 52-year-old female patient with metastatic breast cancer with a solitary metastasis in the left liver lobe located immediately adjacent to the main portal vein branch. Appearance of the target lesion and the IRE ablation zone on axial T2w TSE sequences at different time points: before ablation (A), 2 hours after IRE (B), and 24 hours after IRE (C), 1 week after IRE (D), 4 weeks after IRE (E), 8 weeks after IRE (F), 6 months after IRE (G), and 12 months after IRE (H). The target lesion was visible as a T2w hyperintense lesion (A). Immediately after IRE (2 hours) the ablation zone was visible as homogenously intermediately hyperintense area (B). One day after IRE, the SI of the ablation zone on T2w imaging inverted to become intermediately hypointense compared with normal liver parenchyma and exhibited a hyperintense rim that was observable around the entirety of the ablation zone (C). The ablation zone remained intermediately hypointense on T2w images, with a hyperintense rim 1 week (D) until 4 weeks (E) after ablation. The ablation area decreased continuously in size starting as early as 1 week after IRE (C) and finally disappeared completely (G and H).
FIGURE 2.

MRI patterns after IRE—arterial contrast enhancement. Same patients as shown in Figure 1. Appearance of the IRE ablation zone on axial contrast-enhanced T1-weighted gradient echo sequences in arterial phase at different time points: pre-IRE (A), 2 hours after IRE (B), 24 hours after IRE (C), and 1 week after IRE (D). Within 2 hours after IRE, we observe a homogenous arterial enhancement of the entirety of the ablation zone (B). This changed at 24 hours to a rim enhancement (C), which persisted in this case until 1 week after IRE.
FIGURE 3.
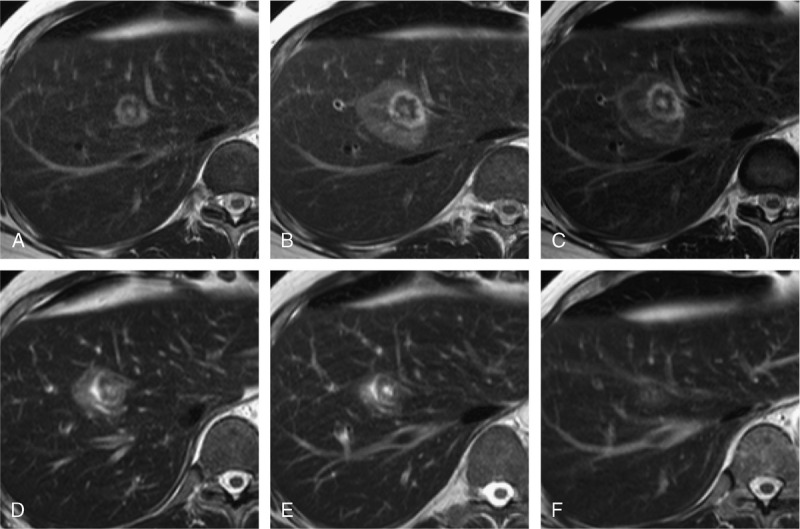
Visibility of the target lesion within the ablation zone. A 55-year-old male patient with metastatic peritoneal mesothelioma with a solitary liver metastasis located immediately adjacent to the middle hepatic vein. Appearance of the target lesion and the IRE ablation zone on axial T2w TSE sequences at different time points: before ablation (A), 2 hours after IRE (B), and 24 hours after IRE (C), 1 week after IRE (D), 2 weeks after IRE (E), and 4 weeks after IRE (F). The target lesion remains visible within the ablation zone after IRE until 2 weeks after IRE (C–E). Thereafter, the target lesion is no longer distinguishable (F).
FIGURE 4.
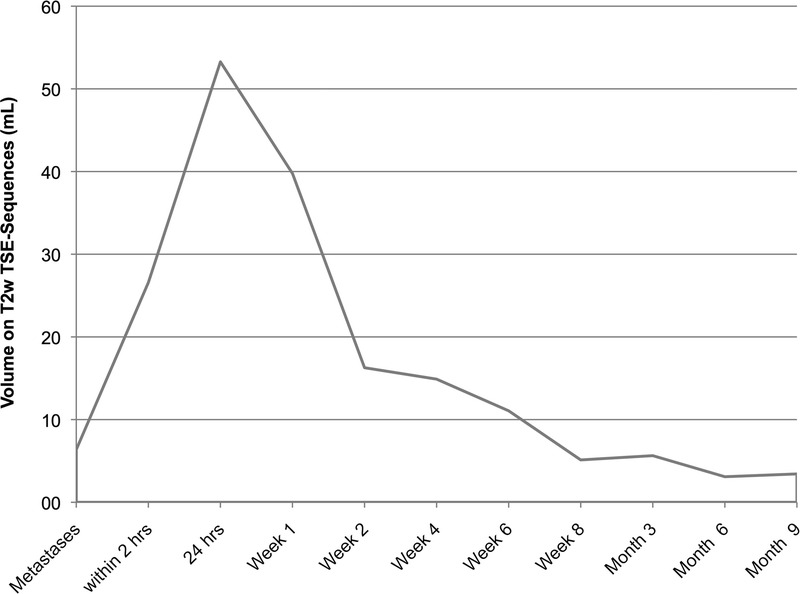
Volume on T2w TSE sequences. Average volumes of the target lesions and ablation zones at marked time points. Note that the first data point is the average volume of the target lesions treated by IRE. A steep increase was observed until 24 hours after the procedure, thereafter the mean ablation zone volumes showed a severe decrease in size until 2 weeks after IRE. In the long course hereafter, a moderate decrease in size was observed.
FIGURE 5.
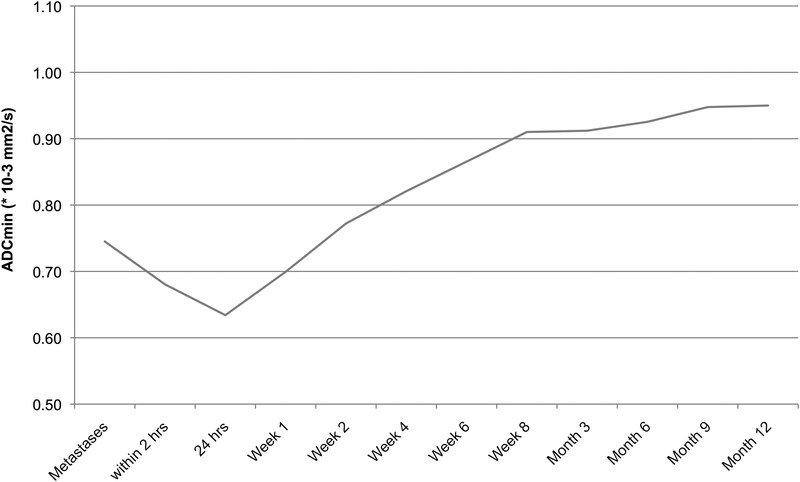
Temporal course of ablation volume ADC. Average ADC values of the ablation zones over time. Note that the first data point is the average ADC of the target lesions treated by IRE. A moderate decrease was observed until 24 hours after the procedure, thereafter the mean ADC of the ablation zone volumes showed a moderate increase until 8 weeks after IRE. In the long course hereafter, still a slight increase was observed.
Early Postinterventional Period (Day of IRE Until 1 Week After IRE)
On the day of the IRE, the ablation zone was visible as an intermediately and homogeneously hyperintense area compared with normal liver parenchyma on T2w TSE images in all 37 of 37 cases.
In 3 (8%) of 37 ablations on the day of IRE, the hyperintense rim of the ablation zone did not cover the entire target lesion.
One day after IRE, in 35 of 37 cases, the SI of the ablation zone on T2w imaging inverted to become intermediately hypointense compared with normal parenchyma and exhibited a hyperintense rim that was visible around the ablation zone. This hyperintense rim exhibited strong enhancement on arterial phase imaging.
In this early post-IRE period, the ablated tumor (target lesion) remained visible within the ablation zone, with unchanged SI compared with the preinterventional MRI, in 62% of ablation zones (23/37). In the remaining 38% (14/37), the target lesion was not visible within the ablation zone. Target lesions that were still visible after IRE tended to be larger than those that were not visible (8.5 ± 9.3 mL vs 2.2 ± 1.3 mL; P < 0.05).
On the day of IRE, the mean size of the ablation zone measured 26.6 ± 11.3 mL; referenced to the size of the respective target lesion, the ablation volume was 417% larger than the volume of the target lesion.
One day after IRE, the size of the ablation zone volume increased to measure 53.3 ± 33.5 mL on average, that is, 836% of the volume of the respective target lesion.
One week after the ablation, the ablation zones showed a slight decrease in size measuring 39.8 ± 37.0 mL.
For the analysis of the temporal evolution of ADC values, data sets of 3 patients needed to be discarded due to inconsistent diffusion-weighted imaging image quality, and in another 3 patients due to signs of incomplete ablation on the MRI performed immediately after IRE.
For the remaining 31 of 37 patients, the average ADC of the ablation volume decreased from 0.74 ± 0.36 × 10⁻³ mm2/s pre-IRE to 0.68 ± 0.18 × 10⁻³ mm2/s immediately after IRE, reaching an average minimum of 0.63 ± 0.27 × 10⁻³ mm2/s 24 hours after IRE (P < 0.05). Thereafter, ADC values showed a slight increase 1 week after IRE (0.70 ± 0.30 × 10⁻³ mm2/s).
Intermediate Post-IRE Changes (Week 2–8 Post-IRE)
The ablation zone remained intermediately hypointense with a hyperintense rim that exhibited arterial enhancement. This hyperintense rim exhibited a continuous SI decrease and disappeared within 1 week in 2 of 37, within 2 weeks in 7 of 37, within 4 weeks in 10 of 37, within 6 weeks in 2 of 37, and within 8 weeks in 9 of 37 cases. In the remaining 7 of 37 cases, the hyperintense rim persisted for more than 8 weeks, that is, persisted until the late post-IRE phase.
Of the 23 target lesions that were still visible within the ablation zone immediately after IRE, this persisted for a variable period. In detail, the lesion remained visible for 1 week in 1, for 2 weeks in 1, for 4 weeks in 2, for 6 weeks in 1, and or for 8 weeks in 3 cases, respectively. In the remaining 15 cases, the ablated target lesion remained visible for more than 8 weeks, but exhibited lower SI on T2w imaging compared with preinterventional baseline.
The average volume of the ablation zone decreased continuously from 39.8 ± 37.0 mL to 5.1 ± 5.2 mL.
The ablation zone disappeared completely within the first 8 weeks after IRE in 13 (35%) of 37 cases and persisted in 24 (65%) of 37. Such complete resolution was observed within 2 weeks in 1, within 4 weeks in 4, and within 8 weeks in 8 of 37 cases.
Average ADC of the ablation zone increased continuously during this period for the evaluable 31 cases from 0.77 ± 0.25 × 10⁻³ mm2/s 1 week after IRE to 0.91 ± 0.30 × 10⁻³ mm2/s 8 weeks after IRE (P < 0.05).
Late Post-IRE Changes (12 Weeks to 12 Months)
In 24 cases, the ablation zone was still visible 8 weeks after IRE. Of these, 8 resolved completely—4 by 3 months, 2 by 6 months, and 2 by 12 months.
A hyperintense rim with arterial contrast enhancement was visible in 7 cases around the 24 ablation zones and persisted for 3 months in 5 and for 6 months in 2 of the 7 cases.
In 15 cases (15/37), the ablated target lesion was still visible within the ablation zone 8 weeks after IRE; this persisted for a quite variable time interval, that is, for 3 months after IRE in 6, for 6 months in another 6, for 9 months in 2, and for over 15 months in 1 case.
In the 24 ablation zones that were still visible beyond 8 weeks, the average volume decreased continuously from 5.6 ± 11.0 mL to 2.1 ± 4.9 mL after 12 months.
The average ADC of the ablation volume increased further from 0.91 ± 0.33 × 10⁻³ mm2/s at 3 months after IRE to 0.96 ± 0.24 × 10⁻³ mm2/s 12 months after IRE (P > 0.05).
DISCUSSION
Although recent studies have shown that tumor destructive effects induced by IRE are not exclusively nonthermal, it is true to state that the main principle of cell destruction by IRE is induction of controlled apoptosis.7 Therefore, whereas after successful radiofrequency or MWA, a clear-cut scar is visible on CT or MRI, and the detection of local recurrence is quite straightforward,16 the situation is more complex, and apparently more difficult after hepatic IRE. In accordance with the quite distinct mode of action of IRE compared with thermal local ablative techniques, the normal course of the ablation zone after IRE differs considerably from the normal course after thermal methods. We believe that knowledge of typical MRI appearance of the IRE ablation zone and its changes over time is important to avoid diagnostic errors in the follow-up of patients after IRE.
This study on 27 patients with 37 hepatic metastases from solid tumors demonstrates that hepatic IRE of noncirrhotic livers induces a broad spectrum of complex SI changes on MRI, with quite variable course over time. However, compared with MRI effects observed after IRE of HCC in cirrhotic livers,13 we were able to identify a somewhat more homogeneous pattern of imaging findings. In most cases, the following pattern was observed:
The ablation zone appeared homogeneously hyperintense on T2w images on the day of IRE, then reversed its SI within the first 24 hours after IRE to become intermediately hypointense, with a circular peripheral rim of T2w bright SI that exhibited arterial enhancement. This appearance persisted for a median 4 of weeks after IRE. The hyperintense rim and its enhancement resolved within 3 months after IRE in 95% of cases (35/37). After IRE for HCC in patients with cirrhotic livers, the hyperintense rim as well as the increased contrast enhancement in the arterial phase persisted for a longer period.13 We propose that the faster resolution of the hyperintense rim and the increased arterial contrast enhancement observed in our cohort is explainable by the superior regenerative capacity of the noncirrhotic liver parenchyma. However, the reason for the described changes on T2w images may be local cytotoxic edema due to the ion leakage caused by the irreversible membrane defects. Furthermore, a local vascular dilation and congestion as well as an inflammatory reaction as described in animal studies14 occurring at 7 to 15 days after IRE may also contribute to this imaging finding.
The peripheral hyperemia around the ablation zone is probably more problematic for the diagnosis of residual or recurrent tumor in patients with HCC but may also cause diagnostic difficulties in patients treated for hypervascular metastases.
It is likely that the T2w hyperintense, hypervascular rim represents an area of incomplete, that is, reversible electroporation. In principle, it is conceivable to exploit these therapy-induced changes to boost the efficacy of local transarterial treatment strategies such as transarterial chemoembolization after IRE. For the design of possible future combined IRE plus transarterial treatment approaches, the quite variable normal time course of the hypervascular rim after IRE in patients with cirrhotic versus noncirrhotic livers needs to be taken into account.
The ablation zones resolved completely in just over half of the cases (57%, 21/37), by an average of 14 weeks after IRE. In the other half (43%, 16/37), the ablation zone did not resolve for over 15 months of follow-up. We can only speculate why ablation zones do or do not disappear, in other words, why some patients exhibit a complete healing, whereas others do not. Confounding factors may be variable vascular supply and/or vascular or biliary drainage of the treated liver area, and/or variations of the regenerative capacity of livers that may exist after courses of systemic chemotherapy.
However, in all 34 cases with complete ablation, the ablation zone exhibited a progressive shrinkage over time. After a small temporary volume increase within the first 24 hours after IRE, the ablation zones shrank progressively over the follow-up period, although with different pace: The shrinkage was steeper in the first 2 weeks after IRE, followed by a moderate shrinkage in the following months. Since this was observed in all 34 cases with complete ablation, any increase in size of the ablation zone should rise the suspicion of local recurrence.
Probably due to the absence of coagulation necrosis, the ablated target lesion remained visible within the ablation zone, with unchanged SI compared with its preinterventional MRI appearance, in 62% of the cases (23/37); this was observed for a median of 3 months and could persist for 15 months after the ablation. Persistent visibility of the treated target lesion was more likely to be seen with larger targets than with smaller ones.
Average ADC values of the ablation volume decreased within the first 2 days after IRE, followed by a progressive normalization of ADC that was on average reached within 2 months after IRE in all cases with successful ablation.
In 3 patients, in whom the hyperintense rim depicted on the MRI study performed within 24 hours after was incomplete and did not include the full volume of the target lesions, follow-up imaging confirmed that the ablation had been incomplete. Accordingly, if doubt exist with regards to the local completeness of the procedure after CT-guided IRE, MRI on the day after IRE is useful. For the long-term follow-up, we suggest to start at 3 months after the procedure because by that time, signs of inflammation (hyperintense rim and strong contrast enhancement), at least in noncirrhotic liver,13 have subsided.
Our study has a number of limitations. We dealt with a relatively small group of patients who have various tumor types with different histological aspects in their appearance and may have been treated with different types of systemic therapy before, which may influence the “treatment response,” and may, in principle, influence the MRI appearance of the liver. However, none of our patients exhibited signs of chemotherapy-associated steatohepatitis clinically or at MRI. Moreover, we did not investigate the effects of IRE on other imaging methods such as CT or (contrast enhanced) ultrasound. Further studies are needed to establish the process of post-IRE healing in these imaging methods.
We can conclude that IRE treatment of secondary liver tumors induces quite variable effects. Knowledge of the expectable SI changes and their time course induced by IRE is essential to avoid diagnostic errors, especially misdiagnosing signs of local recurrence, and to design further local treatment approaches.
Footnotes
Conflicts of interest and sources of funding: none declared.
REFERENCES
- 1.Rubinsky B. Irreversible electroporation in medicine. Technol Cancer Res Treat. 2007;6:255–260. [DOI] [PubMed] [Google Scholar]
- 2.Davalos RV, Mir IL, Rubinsky B. Tissue ablation with irreversible electroporation. Ann Biomed Eng. 2005;33:223–231. [DOI] [PubMed] [Google Scholar]
- 3.Edd JF, Horowitz L, Davalos RV, et al. In vivo results of a new focal tissue ablation technique: Irreversible electroporation. IEEE Trans Biomed Eng. 2006;53:1409–1415. [DOI] [PubMed] [Google Scholar]
- 4.Miller L, Leor J, Rubinsky B. Cancer cells ablation with irreversible electroporation. Technol Cancer Res Treat. 2005;4:699–705. [DOI] [PubMed] [Google Scholar]
- 5.Faroja M, Ahmed M, Appelbaum L, et al. Irreversible electroporation ablation: is all the damage nonthermal? Radiology. 2013;266:462–470. [DOI] [PubMed] [Google Scholar]
- 6.Ahmed M, Brace CL, Lee FT, Jr, et al. Principles of and advances in percutaneous ablation. Radiology. 2011;258:351–369. [DOI] [PMC free article] [PubMed] [Google Scholar]
- 7.Lee EW, Thai S, Kee ST. Irreversible electroporation: a novel image-guided cancer therapy. Gut Liver. 2010;4(suppl 1):S99–S104. [DOI] [PMC free article] [PubMed] [Google Scholar]
- 8.Lee EW, Chen C, Prieto VE, et al. Advanced hepatic ablation technique for creating complete cell death: irreversible electroporation. Radiology. 2010;255:426–433. [DOI] [PubMed] [Google Scholar]
- 9.Zhang Y, White SB, Nicolai JR, et al. Multimodality imaging to assess immediate response to irreversible electroporation in a rat liver tumor model. Radiology. 2014;271:721–729. [DOI] [PMC free article] [PubMed] [Google Scholar]
- 10.Zhang Y, Guo Y, Ragin AB, et al. MR imaging to assess immediate response to irreversible electroporation for targeted ablation of liver tissues: preclinical feasibility studies in a rodent model. Radiology. 2010;256:424–432. [DOI] [PMC free article] [PubMed] [Google Scholar]
- 11.Appelbaum L, Ben-David E, Sosna J, et al. US findings after irreversible electroporation ablation: radiologic-pathologic correlation. Radiology. 2012;262:117–125. [DOI] [PubMed] [Google Scholar]
- 12.Guo Y, Zhang Y, Nijm GM, et al. Irreversible electroporation in the liver: contrast-enhanced inversion-recovery MR imaging approaches to differentiate reversibly electroporated penumbra from irreversibly electroporated ablation zones. Radiology. 2011;258:461–468. [DOI] [PMC free article] [PubMed] [Google Scholar]
- 13.Padia SA, Johnson GE, Yeung RS, et al. Irreversible electroporation in patients with hepatocellular carcinoma: immediate versus delayed findings at MR imaging. Radiology. 2016;278:285–294. [DOI] [PubMed] [Google Scholar]
- 14.Guo Y, Zhang Y, Klein R, et al. Irreversible electroporation therapy in the liver: longitudinal efficacy studies in a rat model of hepatocellular carcinoma. Cancer Res. 2010;70:1555–1563. [DOI] [PMC free article] [PubMed] [Google Scholar]
- 15.Ahmed M, Solbiati L, Brace CL, et al. Image-guided tumor ablation: standardization of terminology and reporting criteria—a 10-year update. Radiology. 2014;273:241–260. [DOI] [PMC free article] [PubMed] [Google Scholar]
- 16.Kim YS, Rhim H, Lim HK, et al. Coagulation necrosis induced by radiofrequency ablation in the liver: histopathologic and radiologic review of usual to extremely rare changes. Radiographics. 2011;31:377–390. [DOI] [PubMed] [Google Scholar]
- 17.Lee EW, Wong D, Tafti BA, et al. Irreversible electroporation in eradication of rabbit VX2 liver tumor. J Vasc Interv Radiol. 2012;23:833–840. [DOI] [PubMed] [Google Scholar]


