

Abstract
Antonio-Santos, J, Ferreira, DJS, Gomes Costa, GL, Matos, RJB, Toscano, AE, Manhães-de-Castro, R, and Leandro, CG. Resistance training alters the proportion of skeletal muscle fibers but not brain neurotrophic factors in young adult rats. J Strength Cond Res 30(12): 3531–3538, 2016—Resistance training (RT) is related to improved muscular strength and power output. Different programs of RT for rats have been developed, but peripheral and central response has not been evaluated directly in the same animal. To test the hypothesis that RT induces central and peripheral adaptations, this study evaluated the effects of a RT on the performance of a weekly maximum overload test, fiber-type typology, and brain neurotrophic factors in young adult rats. Thirty-one male Wistar rats (65 ± 5 days) were divided in 2 groups: nontrained (NT, n = 13) and trained (T, n = 18). Trained group was submitted to a program of RT ladder climbing, gradually added mass, 5 days per week during 8 weeks at 80% of individual maximum overload. This test was weekly performed to adjust the individual load throughout the weeks for both groups. After 48 hours from the last session of exercise, soleus and extensor digital longus (EDL) muscles were removed for myofibrillar ATPase staining analysis. Spinal cord, motor cortex, and cerebellum were removed for RT-PCR analysis of BDNF and insulin-like growth factor-1 (IGF-1) gene expression. In EDL muscle, T animals showed an increase in the proportion of type IIb fibers and a reduction of type IIa fibers. Insulin-like growth factor-1 gene expression was reduced in the cerebellum of T animals (NT: 1.025 ± 0.12; T: 0.57 ± 0.11). Our data showed that 8 weeks of RT were enough to increase maximum overload capacity and the proportion of glycolytic muscle fibers, but there were no associations with the expression of growth neurotrophic factors.
Key Words: physical training, strength, BDNF, IGF-1, experimental models
Introduction
Resistance training is characterized by the movement of body segments with application of an overload increased progressively (15,19). During a program of resistance training, the adjustment of the intensity can be done in the number of repetitions (complete movement of an exercise including concentric and eccentric contractions of the skeletal muscle), velocity of execution (amount of repetitions in an interval of time), interval between the series (group of repetitions developed continuously without interruption), and the maximum overload used (maximum amount of weight applied to the body segments) (15,19).
Different programs of resistance training for rats have used distinctive protocols based on the number of sessions per week (3–4 times a week) with intervals of 48 hours between the sessions (13,14,16). Previous studies used the model of climbing a vertical ladder during 8 weeks, with 48 hours interval between sessions and the maximum overload tests performed in each session (24 maximum overload tests during the program) (16). In human, the control of these variables is well established but, in experimental models, it is still difficult to establish a suitable apparatus of training, sets of exercise, and the time of rest between the exercise bouts. Thus, improved muscle strength and power are observed in response to resistance exercise using several distinct apparatuses and protocols of training. However, the effect of a protocol of resistance exercise based on the performance of a weekly maximum overload test and individually adjusted for each rat has not been evaluated in previous models.
Resistance physical exercise is associated with gain in muscular strength, bone mineral density, anaerobic endurance, and fatigue resistance (14,16,28). In the process of aging, resistance training programs are often used to combat the substantial declines in muscular strength, sarcopenia, motor coordination, and disabilities by improving or maintaining functional capabilities (2). In rats, exercise by ladder climbing activity is associated with muscle hypertrophy, changes in muscle fiber phenotype, and neuromuscular adaptations (4,9,16). More recent literature has reported that resistance exercise may be a promising intervention for some chronic diseases (13).
Physical training can enhance brain function by improving neurogenesis, angiogenesis, and synaptogenesis and increase the growth factors such as brain-derived neurotrophic factor (BDNF) and insulin-like growth factor-1 (IGF-1) (22). Brain-derived neurotrophic factor is a member of the neurotrophin family, and it is largely expressed in the developing and adult mammalian brain and peripheral tissues, such as the muscle and adipose tissue (17). Animal and human studies have verified that physical exercise increases the concentration of BDNF mRNA and protein in the hippocampus and other brain regions (17,18). Insulin-like growth factor-1 is peripherally produced by liver and muscle, but IGF-1 plays pleiotropic roles in the nervous system and has been shown to affect development/growth of the brain (26). For instance, resistance training (8 weeks of progressive resistance exercise in a vertical ladder apparatus) improved several aspects of cognition by improving the performance in a hippocampus-dependent memory task with a concomitant increase of IGF-1 level in the rat model (11). Less is known about the effects of resistance training on the expression of IGF-1 and BDNF on motor cortex, spinal cord and cerebellum, brain structures related to movement control and coordination.
In the present study, we tested the hypothesis that resistance training increases the percentage of glycolytic muscle fiber type and the expression of neurotrophic factors (BDNF and IGF-1) on brain structures related to movement control and coordination (motor cortex, spinal cord, and cerebellum). Thus, the main goal of the present study was to present a model for resistance exercise for rats, capable to improve the performance during exercise sessions, to induce typological adaptation in muscle fiber, and changes in the expression of neurotrophic factors, such as BDNF and IGF-1.
Methods
Experimental Approach to the Problem
We hypothesized that resistance training increases the percentage of glycolytic fiber type in soleus and EDL muscles and the gene expression of BDNF and IGF-1 motor cortex, spinal cord and cerebellum, brain structures related to movement control and coordination. To precisely investigate the peripheral and central effects of physical resistance training, the protocol of resistance exercise was based on the performance of a weekly maximum overload test and individually adjusted for each rat. In this study, we used a ladder climbing apparatus and gradually added mass to the tails of rats over time to evaluate peripheral and central adaptations. Control animals were caged during the protocol of physical training, but they weekly performed the maximal overload test. Trained animals climbed a vertical ladder while carrying a progressive load in the tail (resistance training, 5 days per week, during 8 weeks). Body weight was weekly recorded during the protocol of physical training. Forty-eight hours after the last session of training, rats were killed by decapitation in a guillotine. Decapitation appears to induce rapid loss of consciousness and it does not chemically contaminate tissues (1). Soleus and EDL muscles were removed and analyzed. Spinal cord, motor cortex, and cerebellum were removed for RNA extraction. Total RNA was extracted using the Trizol reagent (Invitrogen, Carlsbad, CA, USA) and treated with DNAse (RNase free) for 30 minutes at 37° C. Afterward, 2 μg of purified RNA was used for reverse transcription. Brain-derived neurotrophic factor and IGF-1 gene expression analysis were performed.
Subjects
Animals
Male Wistar rats (Rattus novergicus 60 days old) were obtained from the Department of Nutrition, Federal University of Pernambuco, Brazil. Rats were maintained at room temperature, 23 ± 1° C and in a light–dark cycle (dark 6:00 am–6:00 pm). The animals were housed in their respective groups in a collective cage and received water and standard laboratory chow (52% carbohydrate, 21% protein, and 4% lipids) ad libitum. The animals were randomly assigned in 2 groups: nontrained (NT, n = 13) and trained (T, n = 18). Nontrained animals remained in their cage during the protocol of training. Trained animals climbed a vertical ladder while carrying a progressive load in the tail (resistance training, 5 days per week, during 8 weeks). The experimental protocol was approved by the Ethics Committee on Animal Experimentation of the Federal University of Pernambuco (Protocol number: 23076.005155/2009-09) and followed the Guidelines for the Care and Use of Laboratory Animals (3).
Program of Resistance Training
The apparatus consisted of a vertical ladder (height = 129 cm; breadth = 20 cm; size = 132 cm; 87 steps; 70° incline and 1 cm between the steps) (Figure 1). Rats climbed up the ladder with a progressive mass in their tails. The support for fixing the load consisted of a semielastic tape with a hook on the tip and a cylindrical container with different weight steel loads. The period of adaptation consisted of 5 days of exercise before the training protocol. From the first to the third day, rats climbed up 10 times the vertical ladder without load. At the fourth day, rats climbed up the ladder with an empty container fixed in the tail. At the fifth day, rats climbed the ladder with a load of 5% of their body mass. The interval between the sets of climb during adaptation period was fixed in 30 seconds.
Figure 1.
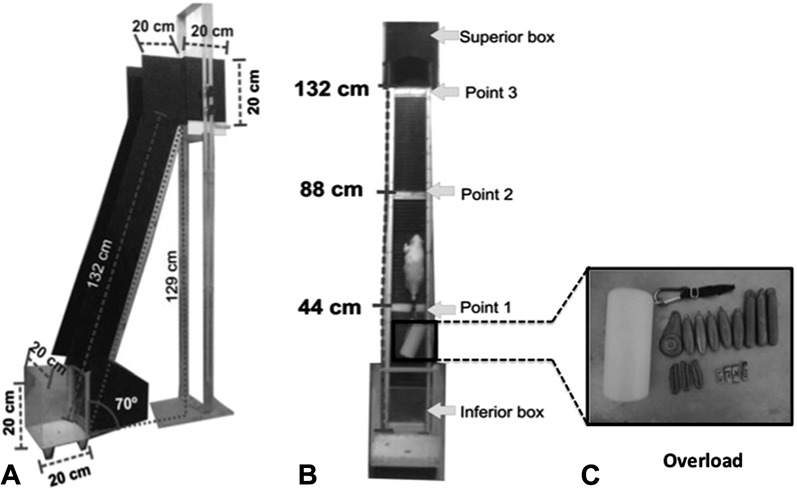
A) Lateral view of the apparatus of training (height: 129 cm; breadth: 20 cm; size: 132 cm; with 87 steps and 1 cm between the steps). B) Frontal view of the apparatus of training, points for place the rats (transparent inferior box, point 1–44 cm from the base, point 2–88 cm from the base, point 3–132 cm from the base and dark superior box). C) The support to attach the overload and the different loads.
Forty-eight hours after the period of adaptation, all animals of both groups were submitted to a maximum overload test. This test was repeated at the end of each week to adjust the overload of the subsequent week. At the first maximum overload test, rats had to climb up initially with a load of 75% of their body weight according to previous study (16). It was considered a “successful climb” when the animal climbed the entire length of the ladder taking a time shorter than 40 seconds. After each climb, it was added 30 g in the overload until the animal not to be able to perform the task (13). These units of 30 g were considered as units of overload. Failure was determined when the animal could not climb up the ladder after 3 successive attempts. Then, the last successful climb was recorded and considered the maximum carrying capacity for that week of training (or maximum overload). For the subsequent weeks of maximal overload test, the first climbs were performed with 80–100% of the maximum load measured in the beginning of the program and added 30 g in each climb as previously described. The intervals between the climbs during the tests were fixed in 120 seconds.
The program of resistance training consisted of 10 climbs per day, 5 days per week, during 8 weeks with a gradually added mass to the tails of rats over time. The length of the ladder allowed performing 10–16 alternated movements in each climb. Each session of training started with a load corresponding to 30% (first climb), 50% (second climb), and 80% (from third to 10th climb) of the individual maximum overload (measured at the week before). The time for rest among climbs during the program of training was fixed in 90 seconds. The protocol of physical training is shown in Figure 2.
Figure 2.
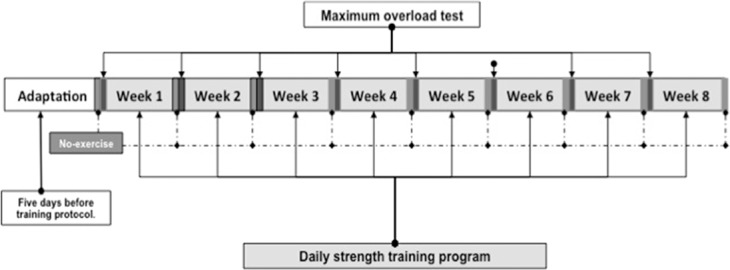
Description of resistance training program.
Histochemical Analysis
The soleus and EDL muscles were dissected and immersed in n-hexane (C6H14) at a low temperature and were frozen in liquid nitrogen. Serial cross-sections (10 μm) were cut with a cryostat (Jung Frigocut CM1100-Leica; Leica Microsystems Gmbh, Wetzlar, Germany) maintained at −20° C and stained for myofibrillar ATPase (23). The sections were left at room temperature and were incubated for 10 minutes in 400 ml preincubation solution (containing 280 ml of 0.2 M acetic acid and 120 ml of 0.2 M sodium acetate) in pH 4.3 or 4.55. The sections were then washed in distilled water and incubated at 37° C in a solution containing ATP (pH 9.4) for 40 minutes. Next, sections were washed in distilled water, rinsed for 5 minutes in a 2% CoCl2 solution, and rinsed 4 times in distilled water. The sections were then dehydrated in crescent ethanol baths (70–100°) and immersed in toluene solution. After drying, the sections were mounted using a Entellan-New (Merck, Darmstadt, Germany) (23).
The sections were analyzed with a light microscope (10× objective lens, U-CMAD-2; Olympus Optical, Tokyo, Japan) connected to a computer (TV TUNER APPLICATION; TelSignal Company Limited, Taiwan). The images of the histological cross-sections of the soleus and the EDL were captured for further analysis. Muscle fibers were labeled with respect to the 3 major types (I, IIa, and IIb) of fibers on the basis of differences in the staining intensity for ATPase after acid preincubation (pH 4.3 and 4.55) (5). According to the different staining intensities, the following classification was used for EDL: pH 4.3 (type I, darkest and type II, lightest) and pH 4.55 (type I, darkest; type IIa, lightest and type IIb, grey). The classification of fiber type in soleus was: pH 4.3 (type I, darkest and type II, lightest) and pH 4.55 (type I, darkest; type IIa, lightest and IIb, grey) (5). Histochemical analysis was performed using computerized image analysis from Mesurim PRO 3.2 software (developed by Jean-François Madre-Amiens, France). The muscle fiber-type composition was determined by counting approximately 1,500 fibers in fields that were equally distributed over the sample.
RT-PCR
To avoid RNA degradation by RNases, surgical instruments were treated with a 1% SDS solution before autoclaving. Samples were collected in RNase-free 1.5-ml microtubes and snap-forzen before homogenization and RNA extraction. The total RNA of the spinal cord, motor cortex, and cerebellum was extracted using 1 ml of Trizol (Invitrogen) reagent according to the manufacturer's instructions. RNA concentration was determined from the absorbance measure at 260 nm. Its purity was determined by the 260 nm/280 nm absorbance ratio and the absence of solvent contamination was verified by assessing the lack of absorbance at 230 nm.
Complimentary DNA (cDNA) synthesis was done using a QuantiTect Reverse Transcription (Qiagen, Hilden, Germany) kit. To eliminate genomic DNA, a reaction was prepared using 2 μl g DNA wipeout buffer, ×7; RNA samples; and the amount of RNase-free water necessary to reach a final volume of 14 μl. The reverse transcription QuantiTect reaction mix was prepared using 1 μl Quantiscript Reverse Transcriptase; 4 μl Quantiscript RT Buffer, ×5; 1 μl RT Primer Mix; and 14 μl of the elimination reaction, which contains the sample RNA. Then, an aliquot of each reverse transcription reaction, which contains a cDNA mix, was stored at −20°.
The PCR was done using the SYBR Green PCR Master Mix (Qiagen) Kit and was analyzed in real time through an automated system of sequence detection called the Rotor-Gene TM RG 3000 (Corbett Life Science, Australia) to determine the mRNA expression of the samples. The total volume of the reaction was 25 μl and included 12.5 μl of the fluorescent compound SYBR Green PCR Master Mix (Qiagen), 2 μl of cDNA (used as a mold to the reaction, 2 ng cDNA·μl−1), 2.5 μl of the sense and antisense primers, and 5.5 μl of RNase-free water. The reactions were incubated at 95° C for 5 minutes to activate the DNA polymerase enzyme, followed by 40 cycles of 5 seconds at 95° C for denaturation and 10 seconds at 60° C, extension and collection of the fluorescent signal. The sequence of primers used for amplification were as follows: β-actin-forward, 5′-ACT ATC GGC AAT GAG CGG TTC C-3′ and reverse, 5′-CGT AAA GAC CTC TAT GCC AAC ACA G-3′; BDNF-forward, 5′-TTG CTG GTC TTG GGC TTC TGG-3′ and reverse, 5′-GGA ACC TAA CAG CAT TGA CCC AGA-3′; IGF-1-forward, 5′-GCC GCT TCC TTC ACA GAA TCT AAT AAT C-3′ and reverse, 5′-CGA AAG CAA TAG CAA CTG GGT GG-3′. The primers were synthesized and purified by IDT—Integrated DNA Technologies (EUA). The relative expression levels of mRNA BDNF and IGF-1 in the spinal cord, cerebellum, and motor cortex were calculated using the Ct (threshold cycle) comparative method (Livak and Schmittgen, 2001), with β-actin as a normalizing gene.
Statistical Analyses
The values are presented as mean and standard error means (SEM). To compare groups, an unpaired Student's t-test was used. To analyze the body weight and maximum overload throughout 8 weeks, ANOVA 2-way test with resistance training and time as factors. Bonferroni's post hoc test was used. To analyze the proportion of fiber type in skeletal muscle, paired Student's t-test was used. The significance level was maintained at 5%. For statistical analyze, it was used GraphPad Prism 5 program for Windows (GraphPad Software, Inc., La Jolla, CA, USA).
Results
After 8 weeks of resistance training, both groups presented the same gain of body weight (in grams) (NT initial = 280.1 ± 9.3 and final = 355.5 ± 8.9, T initial = 266.3 ± 10.1 and final = 365.3 ± 10.7, ≈33% initial vs. final; F = 0.061 and P = 0.999). For T animals, there was a progressive increase in the maximum force (determined by the maximum overload test) throughout the weeks of training, whereas NT animals remained in a constant maximum overload (F = 21.0 and P < 0.0001) (Figure 3A). After the weeks of training, T animals showed an increased percentage change in maximum overload from pretraining to post-training (NT: 101.1 ± 13.6; T: 232.1 ± 14.3, p < 0.001) (Figure 3B). T animals presented a constant capacity to carry the units of overload (units of 30 g) until the third week. There was a reduction of 1 unit followed by a constant of 3 units of overload. Nontrained animals presented a progressive decline throughout the weeks with stabilization in the last 3 weeks of training (Figure 3C).
Figure 3.
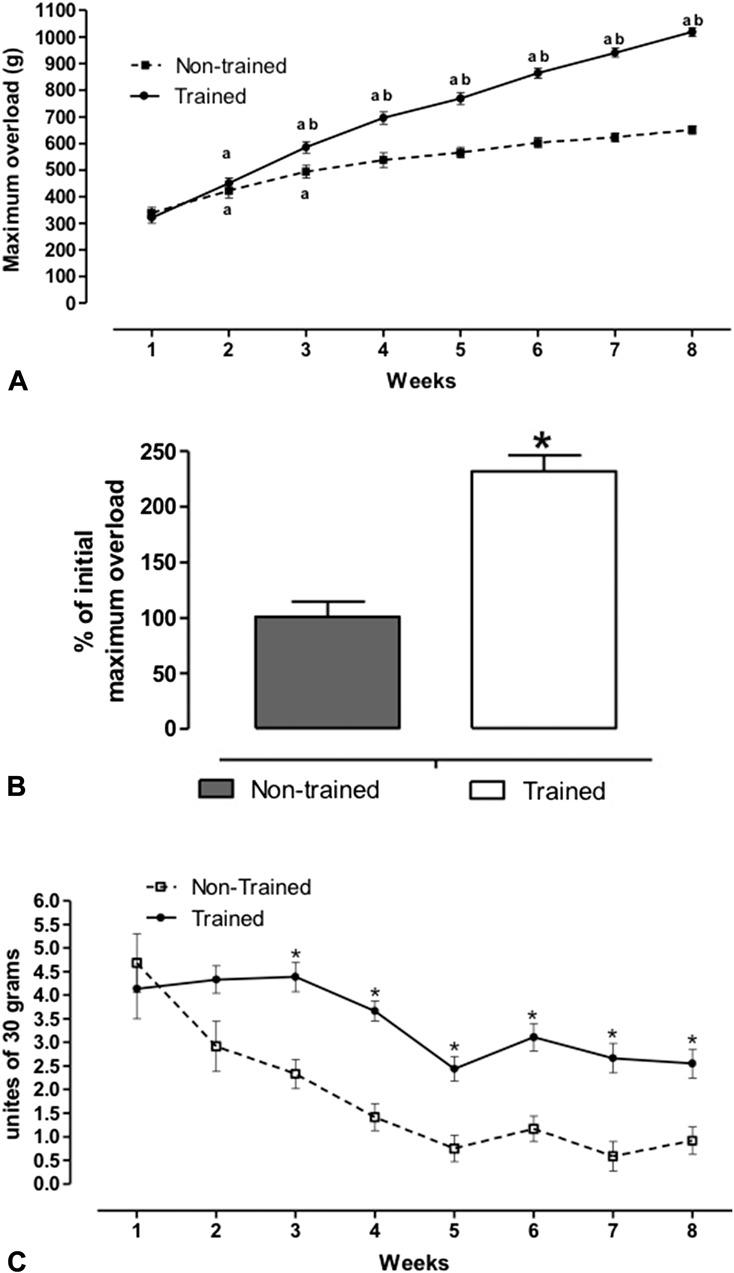
A) Maximum overload, (B) percentage of the increase in maximum overload carried relative to the pretraining values in each group, and (C) units of overload (30 g) carried by animals during the maximal overload test. Animals were submitted to 8 weeks of resistance training. Groups are: trained (T, n = 18) and nontrained (NT, n = 13). Data are presented as mean ± SEM. ap ≤ 0.05 vs. previous week in same group using ANOVA 2-way. bp ≤ 0.05 vs. NT using ANOVA 2-way. *p ≤ 0.05 vs. NT using t-test for comparing of the groups.
In soleus muscle, the resistance training did not alter the proportion of type I fiber (NT: 85.5% ± 2.7; T: 84.7% ± 2.2) and type II (NT: 14.5% ± 2.7; T: 15.2% ± 2.1). Similarly, there was no difference in the percentage of fibers in the EDL muscle: type I (NT: 3.4% ± 0.47; T: 5.4% ± 0.82) and type II (NT: 96.6% ± 0.47; T: 94.6% ± 0.82). With preincubation at 4.55 pH, it was possible to evaluate the subtype of fibers (purely oxidative, type I; purely glycolytic, type IIb; and oxidative-glycolytic type IIa) from soleus and EDL muscles. The resistance training did not alter the proportion of subtype of fibers in soleus muscle: type I (NT: 84.9% ± 2.06; T: 83.6% ± 2.68); type IIa (NT: 10.9% ± 1.32; T: 13.4% ± 2.53); and type IIb (NT: 4.1% ± 0.82; T: 2.9% ± 0.47) (Figure 4A). In EDL muscle, the resistance training increased the proportion of type IIb fibers (NT: 19.8% ± 2.14; T: 35.7% ± 2.1) and decreased the proportions of type IIa (NT: 77.5% ± 2.4; T: 59.6% ± 2.2) (Figure 4B).
Figure 4.
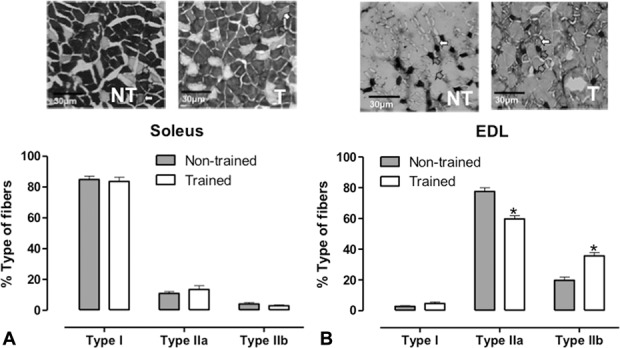
Images of the transverse sections (4× objective) soleus (A) and EDL (B) preincubated at pH 4.55. Red arrows indicate type I fibers, green arrows indicate type IIa fibers, and white arrows indicate type IIb fibers. The charts indicate the proportion of muscle fiber type I, type IIa, and type IIb of animals submitted to a resistance training during 8 weeks (trained: T, n = 6) or submitted only to test the maximum overload capacity (nontrained: NT, n = 6). Tissue was collected 48 hours after the last training session. Data are presented as mean ± SEM. *p ≤ 0.05 vs. NT using Student's t-test for statistical analyses.
There were no differences in the gene expression of the BDNF in the spinal cord, cerebellum, and motor cortex. For the gene expression of IGF-1, T animals presented a reduction in the cerebellum (NT: 1.025 ± 0.12; T: 0.57 ± 0.11) (Figure 5).
Figure 5.
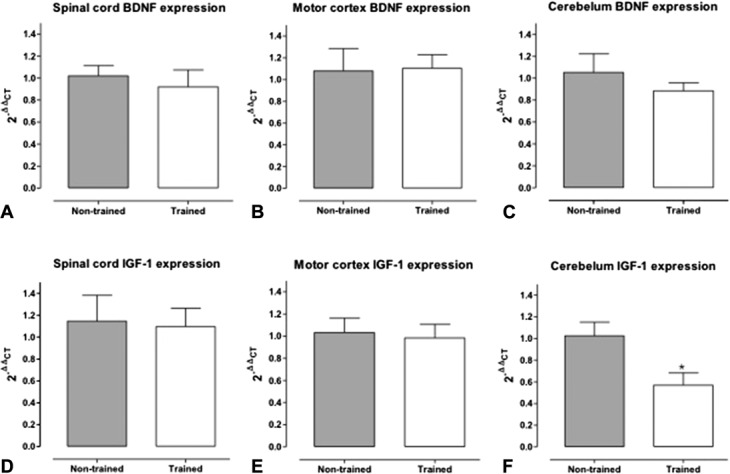
Relative expression of mRNA of BDNF in the spinal cord (A), motor cortex (B), and cerebellum (C) and relative expression of mRNA of IGF-1 in the spinal cord (D), motor cortex (E), and cerebellum (F). Animals were submitted to a resistance training during 8 weeks (trained: T, n = 5) or submitted only to test the maximum overload capacity (nontrained: NT, n = 5). Tissues were collected 48 hours after the last training session. Data are presented as mean ± SEM. The level of expression was obtained by real-time PCR (RT-PCR) and the results normalized by NT group (2−ΔΔCT where ΔΔCT = [CTB1 − CTB2] − [CTA1 − CTA2]). *p ≤ 0.05 compared with the nontrained group using Student's t-test student for statistical analyses.
Discussion
Resistance training is related to adaptations according to the amount of work performed during the exercise sessions and the interval between the exercises bouts (16). The sum of these responses produces increases in the performance capacity (20). In the present study, rats were submitted to a resistance exercise with an interval of 24 hours between the sessions of training. This seemed to induce a suitable adaptation in the maximum overload capacity of rats. A previous study submitted rats to physical training in the ladder, 4 days per week, with interval of 24 and 48 hours between the sessions (14). It was observed an augment of the maximum overload (140% of body weight) only after 24 weeks (14). Our data showed that 8 weeks of resistance training were enough to increase 238 ± 8.6% in maximum overload capacity. In addition, there were changes in glycolytic muscle typology. Indeed, it has been shown that resistance exercise is associated with high gains in performance, muscle strength, and muscle fiber cross-sectional area (14,16,24). However, molecular changes in the expression of BDNF and IGF-1 in the central structures related to the movement (spinal cord, cerebellum, and motor cortex) were not pronounced except for the reduced expression of IGF-1 in the cerebellum of trained rats.
Animal models allow the evaluation of training effects according to the load and intensity of effort with high accuracy, especially in the context of resistance exercise on a climbing ladder (24). Likewise, it is possible a more precise physiological evaluation and biological information related to adaptive processes during physical training (20). In the present study, resistance exercises were performed between 70 and 80% of the maximum load weekly adjusted according to the maximal overload test performed at the day before the week of training. Trained animals maintained the capacity to carry the units of overload (units of 30 g) among 3 or 4 units throughout the weeks of training. The reduction of the units of overload can be related to the increased synchronization in the firing of motor units, which is likely to decrease the ability to steadily produce force (27).
Skeletal muscle has intrinsic ability to adapt to different kind of effort by changing its mass and fibers type (6). In the present study, it was observed an increase in the performance (gain of muscular strength) and in fiber type IIb in glycolytic muscle (EDL) but not in soleus muscle. Aligned with our finding, there were an increase in the percentage of type IIb fibers and no changes in type I fibers in the deep region of the rectus femoris of young rats trained to lift progressively heavy weights in a ladder (20 times per day, 5 days per week during 8 weeks) (28). On the other hand, a previous study analyzed the composition of myosin heavy chain (MHC) in muscle flexor hallux longus (FHL, predominantly glycolytic) of rats submitted to resistance training in ladder (3 sessions per week, during 8 weeks with 50, 75, 90, and 100% of maximum overload), and observed an increase in the proportion of MHCIIa (21). A hypertrophy of 48% of fiber IIx in flexor digitorum profundus (FDP) muscle was seen in rats submitted to a protocol of resistance training (climb 1 m while carrying 150% of their body mass during 4 weeks) (4). The apparent divergence in these findings is indicative of the varied existence of protocols for resistance training (interval between exercise bouts, high of the stairway, and percentage of maximum overload). However, the development of a protocol of resistance exercise that increase the type IIb muscle fibers is important for special population that present poor muscle strength and reduced balancing ability related to muscle atrophy, undernutrition, aging, insulin resistance, and cancer-induced cachexia. A recent study showed that resistance exercise training (rats climbed a vertical ladder with an extra load attached to the tail, representing 75–90% of total body mass, 3 times per week, for 8 weeks) prevented the symptoms of cancer cachexia, such as anorexia, sarcopenia, and chronic systemic inflammation (13). This kind of intervention can be considered as a nonpharmacological therapy in the management of this syndrome.
Resistance training can alter the manner by which trained muscles are recruited by the central nervous system such that a greater degree of muscle activation is generated by the same amount of cortical input (8). In the present study using real-time quantitative PCR technique, there were no changes in the expression of BDNF and IGF-1 genes in the spinal cord and motor cortex. It can be suggested that there is an adaptive mechanism induced by resistance training that minimize cortical input necessary to elicit a given level of force. In addition, this adaptation can also produce an increase in the coordinated movements by reducing the level of central drive and the functional interference provided by the motor cortex and spinal cord (8,10). In addition, the increased levels of gain of muscular strength can be associated with a decrease in activation of some central areas of the nervous system related to the movement (8). On the other hand, our findings showed a reduction in the expression IGF-1 in the cerebellum. Indeed, only small amounts of IGF-1 mRNA have been detected in the adult cerebral cortex and in the striatum (25), and the main origin of IGF-1 in the brain is peripheral (liver and skeletal muscle) (25). Approximately 95% of the IGF-I that acts on the brain is derived from the liver (7). Physical exercise is known to increase brain uptake of IGF-1 at least by increasing the level of megalin, a transporter involved in IGF-1 transport into the brain (7). It is possible that the high level of plasmatic concentration of IGF-1 induced by resistance training (12) derived from periphery induced a negative feedback consequently reduced the production of IGF-1 by the cerebellum.
Our data showed that only 8 weeks of resistance training were enough to increase maximum overload capacity and the proportion of glycolytic muscle fiber. However, there were no changes in the expression of BDNF and IGF-1 genes in the spinal cord and motor cortex. A peripheral adaptive mechanism can produce an increase in the coordinated movements and reduce the level of central drive for the functional interference provided by the motor cortex and spinal cord. Also, it is possible that the resistance training increases the peripheral production of IGF-1 and consequently reduced the production of IGF-1 by the cerebellum.
Practical Applications
In the present study, a protocol of resistance training was developed to improve the performance and muscle strength of male young Wistar rats. The protocol of resistance exercise was based on the performance in a weekly maximum overload test. Our data showed that 8 weeks of resistance training were enough to increase the maximum overload capacity, glycolytic muscle fibers, and force. In addition, there was a reduced expression of IGF-1 in the cerebellum of trained rats. Because in human beings, muscle protein synthesis remains elevated after a bout of resistance training; this kind of intervention can be considered as a nonpharmacological therapy in the management of aging-induced sarcopenia, cancer-induced cachexia, muscular atrophy, and protein-restricted diet.
Acknowledgments
This study was supported by National Council for Scientific and Technological Development (CNPq, Brazil), Coordination for the Improvement of Higher Education Personnel (CAPES, Brazil), and State of Pernambuco Science and Technology Support Foundation (FACEPE, Brazil).
References
- 1.Association AVM. AVMA Guidelines for the Euthanasia of Animals: 2013 Edition. Schaumburg, IL: Creative Commons Attribution-NonCommercial-NoDerivs 3.0 Unported License, 2013. Available at: http://creativecommons.org/licenses/by-nc-nd/3.0/. Accessed March 21, 2016. [Google Scholar]
- 2.Barry BK, Carson RG. The consequences of resistance training for movement control in older adults. J Gerontol A Biol Sci Med Sci 59: 730–754, 2004. [DOI] [PubMed] [Google Scholar]
- 3.Bayne CG. American Academy of Home Care Physicians. Are you ready for this?. Home Care Provid 1: 162–163, 1996. [DOI] [PubMed] [Google Scholar]
- 4.Begue G, Douillard A, Galbes O, Rossano B, Vernus B, Candau R, Py G. Early activation of rat skeletal muscle IL-6/STAT1/STAT3 dependent gene expression in resistance exercise linked to hypertrophy. PLoS One 8: e57141, 2013. [DOI] [PMC free article] [PubMed] [Google Scholar]
- 5.Brooke MH, Kaiser KK. Muscle fiber types: How many and what kind? Arch Neurol 23: 369–379, 1970. [DOI] [PubMed] [Google Scholar]
- 6.Campos GE, Luecke TJ, Wendeln HK, Toma K, Hagerman FC, Murray TF, Ragg KE, Ratamess NA, Kraemer WJ, Staron RS. Muscular adaptations in response to three different resistance-training regimens: Specificity of repetition maximum training zones. Eur J Appl Physiol 88: 50–60, 2002. [DOI] [PubMed] [Google Scholar]
- 7.Carro E, Nunez A, Busiguina S, Torres-Aleman I. Circulating insulin-like growth factor I mediates effects of exercise on the brain. J Neurosci 20: 2926–2933, 2000. [DOI] [PMC free article] [PubMed] [Google Scholar]
- 8.Carroll TJ, Barry B, Riek S, Carson RG. Resistance training enhances the stability of sensorimotor coordination. Proc Biol Sci 268: 221–227, 2001. [DOI] [PMC free article] [PubMed] [Google Scholar]
- 9.Carroll TJ, Riek S, Carson RG. Neural adaptations to resistance training: Implications for movement control. Sports Med 31: 829–840, 2001. [DOI] [PubMed] [Google Scholar]
- 10.Carroll TJ, Riek S, Carson RG. The sites of neural adaptation induced by resistance training in humans. J Physiol 544: 641–652, 2001. [DOI] [PMC free article] [PubMed] [Google Scholar]
- 11.Cassilhas RC, Lee KS, Venancio DP, Oliveira MG, Tufik S, de Mello MT. Resistance exercise improves hippocampus-dependent memory. Braz J Med Biol Res 45: 1215–1220, 2012. [DOI] [PMC free article] [PubMed] [Google Scholar]
- 12.Cotman CW, Berchtold NC, Christie LA. Exercise builds brain health: Key roles of growth factor cascades and inflammation. Trends Neurosci 30: 464–472, 2007. [DOI] [PubMed] [Google Scholar]
- 13.Donatto FF, Neves RX, Rosa FO, Camargo RG, Ribeiro H, Matos-Neto EM, Seelaender M. Resistance exercise modulates lipid plasma profile and cytokine content in the adipose tissue of tumour-bearing rats. Cytokine 61: 426–432, 2007. [DOI] [PubMed] [Google Scholar]
- 14.Duncan ND, Williams DA, Lynch GS. Adaptations in rat skeletal muscle following long-term resistance exercise training. Eur J Appl Physiol Occup Physiol 77: 372–378, 1998. [DOI] [PubMed] [Google Scholar]
- 15.Holm L, Reitelseder S, Pedersen TG, Doessing S, Petersen SG, Flyvbjerg A, Andersen JL, Aagaard P, Kjaer M. Changes in muscle size and MHC composition in response to resistance exercise with heavy and light loading intensity. J Appl Physiol 105: 1454–1461, 2008. [DOI] [PubMed] [Google Scholar]
- 16.Hornberger TA, Jr, Farrar RP. Physiological hypertrophy of the FHL muscle following 8 weeks of progressive resistance exercise in the rat. Can J Appl Physiol 29: 16–31, 2004. [DOI] [PubMed] [Google Scholar]
- 17.Huang T, Larsen KT, Ried-Larsen M, Moller NC, Andersen LB. The effects of physical activity and exercise on brain-derived neurotrophic factor in healthy humans: A review. Scand J Med Sci Sports 24: 1–10, 2014. [DOI] [PubMed] [Google Scholar]
- 18.Knaepen K, Goekint M, Heyman EM, Meeusen R. Neuroplasticity - Exercise-induced response of peripheral brain-derived neurotrophic factor: A systematic review of experimental studies in human subjects. Sports Med 40: 765–801, 2010. [DOI] [PubMed] [Google Scholar]
- 19.Kraemer WJ, Hatfield DL, Spiering BA, Vingren JL, Fragala MS, Ho JY, Volek JS, Anderson JM, Maresh CM. Effects of a multi-nutrient supplement on exercise performance and hormonal responses to resistance exercise. Eur J Appl Physiol 101: 637–646, 2007. [DOI] [PubMed] [Google Scholar]
- 20.Leandro CG, Levada AC, Hirabara SM, Manhaes-de-Castro R, De-Castro CB, Curi R, Pithon-Curi TC. A program of moderate physical training for Wistar rats based on maximal oxygen consumption. J Strength Cond Res 21: 751–756, 2007. [DOI] [PubMed] [Google Scholar]
- 21.Lee S, Barton ER, Sweeney HL, Farrar RP. Viral expression of insulin-like growth factor-I enhances muscle hypertrophy in resistance-trained rats. J Appl Physiol (1985) 96: 1097–1104, 2004. [DOI] [PubMed] [Google Scholar]
- 22.Llorens-Martin M, Torres-Aleman I, Trejo JL. Growth factors as mediators of exercise actions on the brain. Neuromolecular Med 10: 99–107, 2008. [DOI] [PubMed] [Google Scholar]
- 23.Pestronk GJ, Kaiser KK, Brooke MH. ATPase stain in muscle histochemistry. Muscle Nerve 15: 258, 1992. [PubMed] [Google Scholar]
- 24.Philippe AG, Py G, Favier FB, Sanchez AM, Bonnieu A, Busso T, Candau R. Modeling the responses to resistance training in an animal experiment study. Biomed Res Int 2015: 914860, 2015. [DOI] [PMC free article] [PubMed] [Google Scholar]
- 25.Rotwein P, Burgess SK, Milbrandt JD, Krause JE. Differential expression of insulin-like growth factor genes in rat central nervous system. Proc Natl Acad Sci U S A 85: 265–269, 1988. [DOI] [PMC free article] [PubMed] [Google Scholar]
- 26.Vardatsikos G, Sahu A, Srivastava AK. The insulin-like growth factor family: Molecular mechanisms, redox regulation, and clinical implications. Antioxid Redox Signal 11: 1165–1190, 2009. [DOI] [PubMed] [Google Scholar]
- 27.Yao W, Fuglevand RJ, Enoka RM. Motor-unit synchronization increases EMG amplitude and decreases force steadiness of simulated contractions. J Neurophysiol 83: 441–452, 2000. [DOI] [PubMed] [Google Scholar]
- 28.Yarasheski KE, Lemon PW, Gilloteaux J. Effect of heavy-resistance exercise training on muscle fiber composition in young rats. J Appl Physiol (1985) 69: 434–437, 1990. [DOI] [PubMed] [Google Scholar]