Abstract
Background
I have postulated that arachidonic acid release from rat liver cells is associated with cancer chemoprevention. Since it has been reported that inhibition of proteasome activities may prevent cancer, the effects of proteasome inhibitors on arachidonic acid release from cells and on prostaglandin I2 production in rat liver cells were studied.
Results
The proteasome inhibitors, epoxomicin, lactacystin and carbobenzoxy-leucyl-leucyl-leucinal, stimulate the release of arachidonic acid from rat glial, human colon carcinoma, human breast carcinoma and the rat liver cells. They also stimulate basal and induced prostacycin production in the rat liver cells. The stimulated arachidonic acid release and basal prostaglandin I2 production in rat liver cells is inhibited by actinomycin D.
Conclusions
Stimulation of arachidonic acid release and arachidonic acid metabolism may be associated with some of the biologic effects observed after proteasome inhibition, e.g. prevention of tumor growth, induction of apoptosis, stimulation of bone formation.
Background
The proteasome degrades many cellular proteins, several with regulatory functions. It is not surprising that proteasome inhibitors affect many biologic processes [1] including prevention of cancer [2]. The effect of proteasome inhibition on cell growth and possible cancer chemoprevention has been reviewed by Adams [3].
Epoxomicin, an α'-β'-epoxyketone, appears to be the most selective proteasome inhibitor. Based on its anti-tumor activity, this product was originally isolated from an actinomycetes strain C-996-17 [4]. It inhibits the chymotrypsin-like activity (cleavage after large hydrophobic residues), trypsin-like activity (cleavage after basic residues) and peptidyl-glutamyl peptide hydrolyzing (PGPH) activity (cleavage after acidic residues) of proteasomes. Activities of the Ca++-dependent proteases, calpain, papain, chymotrypsin, trypsin and cathepsin are not affected by epoxomicin even at a 50 μM concentration [5].
The β-lactone, lactacystin, is relatively selective but can inhibit cathepsin A [6]. Peptide aldehydes, in addition to inhibiting proteasome activity, can also inhibit lysosomal and Ca++-activated proteases [7]. The peptides containing the carboxyvinylsulfone moiety inhibit cysteine proteases [8,9].
I have shown that inhibition of proteolysis by phenylmethylsulphonyl fluoride, the peptide aldehydes carbobenzoxy-leucyl-leucyl-norvalinal and carbobenzoxy-leucyl-leucyl-leucinal (ZLLL) and lactacystin stimulate induced prostaglandin (PGI2) production in rat liver cells [10,11]. Lactacystin stimulates arachidonic acid (AA) release from these cells [11]. Others have reported that proteasome inhibition up-regulates cyclooxygenase-2 (COX-2) and stimulates PGE2 production in neuronal cells [12].
In this report, evidence is presented that proteasome inhibitors stimulate PGI2 production by rat liver cells as well as the release of AA from rat liver, rat glial, human colon carcinoma and human breast carcinoma cells in culture. The stimulation of AA release from rat liver cells is partially inhibited by preincubation of the cells with actinomycin D.
Results and Discussion
Of the cells examined (C-9 rat liver, C-6 rat glial, HT-29 human colon carcinoma and BT-20 human breast carcinoma) the prostanoid metabolic profile has been described only for C-9 rat liver cells (95% is PGI2 and less than 5% is PGE2 and PGF2α) [13]. At the low cell densities used in this study, only PGI2, the main product of COX-mediated synthesis, can be quantitatively estimated. The rat liver cells express COX-2 both constitutively and after induction [14]. The effect of time on basal and 12-0-tetradecanoylphorbol-13-acetate (TPA) induced PGI2 synthesis during incubation of cells with epoxomicin is shown in Fig. 1.
Figure 1.
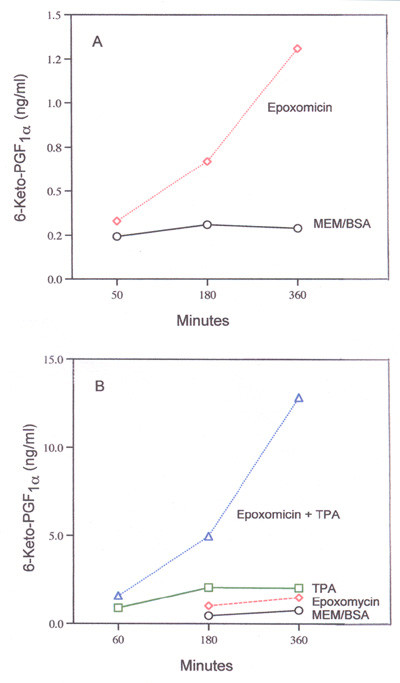
Time-course of (A) basal and (B) TPA-induced 6-keto-PGF1α production during incubation with 1.2 μM epoxomicin. In (B) 16.7 nM TPA was used. Analyses were performed with duplicate and triplicate dishes. Mean values are shown.
The stimulation of basal PGI2 production by epoxomicin and TPA-induced PGI2 production by epoxomicin and lactacystin as a function of dose is shown in Fig. 2. As little as 0.3 μM epoxomicin stimulates TPA-induced PGI2 production significantly (Fig. 2-B). It is 10 to 15 times more effective than lactacystin (compare Fig. 2-B and 2-C). Using purified bovine erythrocyte proteasomes, epoxomicin inhibits the chymotrypsin-like activity, about 4 to 5 times more effectively than does clasto-lactacystin β-lactone, the derivative of lactacystin [5]. They are almost equally effective on inhibiting the trypsin-like and PGPH-like activities [5]. Assuming that epoxomicin and lactacystin have equal access to the proteasome and that proteasome activity is regulating COX-2 in rat liver cells similarly to neuronal cells [12] then COX-2 may be degraded in the proteasome by cleavage after large hydrophobic residues.
Figure 2.
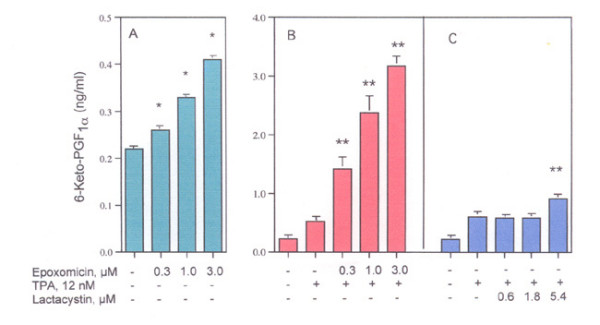
Effect of epoxomicin on (A) basal and (B) TPA-induced 6-ketoPGF1α production and (C) effect of lactacystin on TPA-induced 6-ketoPGF1α production. Cells were incubated with the reagents for 6 hours. The analyses were performed with triplicate dishes *- statistically significant vs MEM/BSA. **- Statistically significant vs TPA.
The amplification of PGI2 production (Figs. 1 and 2) after inhibition by epoxomicin could reflect not only stabilization of COX-2 but also an intracellular increase in the concentration of the substrate i.e. the AA that is produced during hydrolysis of the membrane phopholipids by PLase activity [15]. Extracellular and/or intracellular release of AA will depend, in part, on the localization of the phospholipids in the membrane, e.g. in its inner or outer leaflet [16]. Release of AA in response to several agonists has been described [17-20].
The effect of a 2, 4 or 6-h incubation on AA release from rat liver and rat glial cells by 1.0 μM epoxomicin was determined. Only after the 6-h incubation were the differences significant statistically. Regulation of PLase activity by the proteasome pathway appears to be a relatively slow process. After a 6-h incubation, epoxomicin, lactacystin and ZLLL stimulate the release of extracellular AA from rat liver cells (Fig. 3) and AA release after TPA-induction (3.7% vs 13.5% in the presence of 1.0 μM epoxomicin). Epoxomicin also stimulates the release of AA from rat glial, human colon carcinoma and human breast carcinoma cells (Table 1). The stimulation of AA release from the rat liver cells after incubation with epoxomicin is partially inhibited by pre-incubation of the cells for 2-h with actinomycin (Fig. 4) suggesting that a fraction of the PLase is induced. As expected, the inhibition of TPA-induced PGI2 production by actinomycin D is complete (Fig. 5). Thus, some mechanisms leading to maximum AA release appear to be genomic. The induced PLase activity, probably PLA2, could reflect expression of either a secretory or cytosolic PLA2 or some combination of both enzymes [21].
Figure 3.
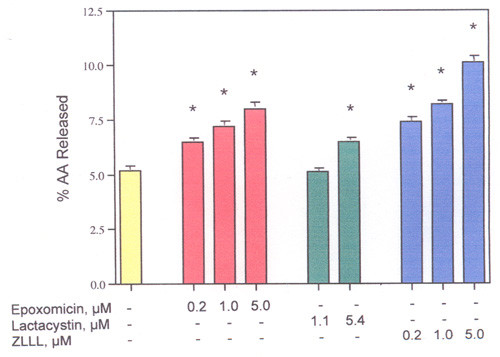
Dose-response of epoxomicin, lactacystin and ZLLL on AA release from rat liver cells. After incubation for 6 hours. The analyses were performed with triplicate dishes. *- Statistically significant vs MEM/BSA.
Table 1.
Effect of Epoxomicin on AA Release from Rat Glial, Human Colon Carcinoma and Human Breast Carcinoma Cells.
| Cell Type | % AA Release | |
| MEM/BSA control | With epoxomicin | |
| Rat glial (C-6) | 9.0 ± 0.07 | 11.4 ± 0.28 |
| Human Colon Carcinoma (HT-29) | 7.8 ± 0.05 | 9.4 ± 0.33 |
| Human Breast Carcinoma (BT-20) | 12.1 ± 0.35 | 14.2 ± 0.31 |
Cells were incubated in the presence and absence of 4.5 μM epoxomicin for 6-h, 12-h or 9-h (C-6, HT-29, BT-20 respectively). Analyses were performed with quadruplicate (C-6 and HT-29) or quintuplicate (BT-20) dishes. All values are expressed as Mean ± SE (n = 4 or n = 5). All data with epoxomicin are statistically significant vs MEM/BSA.
Figure 4.
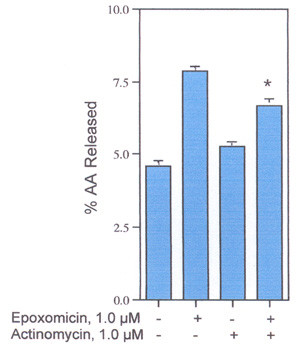
Effect of Actinomycin D on AA release from rat liver cells. Cells were preincubated with and without 1.0 μM actinomycin D for 2-h, then incubated in the presence and absence of epoxomicin and actinomycin D for another 6-h. The analyses were performed with triplicate or quadruplicate dishes. *- Statistically significant vs epoxomicin in the presence of actinomycin D.
Figure 5.
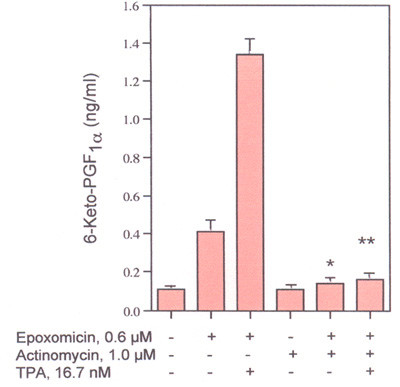
Effects of actinomycin D on TPA-induced 6-Keto-PGF1α production. Cells were preincubated with 1.0 μM actinomycin D for 2-h and then incubated in the presence and absence of 0.6 μM epoxomicin and/or 16.7 μM TPA for another 6-h. The analyses were performed with triplicate dishes. *- Statistically significant vs TPA in the absence of actinomycin D. **- Statistically significant vs epoxomicin plus TPA in the absence of actinomycin D.
The release of AA from rat liver cells, most likely resulting from PLase activation, is associated with cancer chemoprevention [14,17-19], [22-24]. In addition to its intrinsic biologic activities, AA regulates production of lipoxygenase, cytochrome P-450, and epoxygenase products as well as COX activities. Prostanoid profiles differ with cell type and individual AA metabolites have different pharmacological properties [15]. COX-2 activity, as measured by PGI2 production, is stimulated by proteasome inhibition (Fig. 1 and 2). Thus, some biologic effects of proteasome inhibition, e.g. stimulation of bone formation [25], may reflect the metabolism of the intracellular AA.
Inhibition of COX-2 activity is one possible mechanism that has been proposed to prevent colon cancer [26]. However, rather than inhibiting, tamoxifen and raloxifene, statins and epoxomicin stimulate COX-2 activity and AA release from rat liver cells [14,17-19]. As shown in Table 1, epoxomicin stimulates AA release from human colon carcinoma, breast carcinoma and rat glial cells. Tamoxifen and simvastatin also stimulate AA release from the human colon carcinoma and human breast carcinoma cells (unpublished data). These drugs have been reported to prevent cancer [27,28]. At least as measured by the COX activity of rat liver cells, tamoxifen, raloxifene, statins and proteasome inhibitors could be preventing cancer by a COX independent mechanism.
AA resulting from proteasome inhibition has many intrinsic biologic properties [reviewed in [29]]. Some of these activities may trigger PLase activity. The causal relationship of AA to cancer prevention (if any) is unclear. Production of AA by the tumor-suppressive type-II phospholipase A2 (PLA2G2A) may be related to the cancer prevention [22-24]. It is not surprising that control of PLase activities present an attractive area for cancer prevention studies [30].
Methods
The rat liver (C-9 cell line) and human breast carcinoma (the BT-20 cell line) were purchased from the American Type Culture Collection (Manassas, VA, USA). The rat liver glial cells (C-6 cell line) was obtained from Dr. Elaine Lai of the Department of Biology, Brandeis University and the human colon carcinoma (the HT-29 cell line) was obtained from Dr. Basil Rigas, American Health Foundation, Valhalla, NY, USA. They were maintained in Eagle's minimum essential medium (MEM) supplemented with 10% fetal bovine serum. [3H] AA (91.8 Ci/mmol) was obtained from NEN Life Science Products, Inc. (Boston, MA, USA). Epoxomicin, lactacystin and ZLLL were purchased from Biomol (Plymouth Meeting, PA, USA). All other reagents were from Sigma Chemical Co. (St. Louis, MO, USA). Rat liver cells incubating with lactacystin (5.4 μM) or ZLLL (1.0 μM) for 6-h have been tested for viability by a tetrazolium-based assay and found not to be toxic [31].
Two days prior to experiments, the rat liver cells were treated with 0.25% trypsin-EDTA and, after addition of minimal essential media (MEM) containing 10% fetal calf serum, the floating cells were seeded onto 35 mm culture dishes. The plating densities varied from 0.1 to 0.5 × 10⁵ cells/35 mm dish. The freshly seeded cultures were incubated for 24-h to allow for cell attachment. After decantation of MEM containing the fetal bovine serum, 1.0 ml fresh MEM containing 10% fetal bovine serum and [3H] AA (0.2 μCi/ml) were added and the cells incubated for another 24-h. The cells were washed 4 times with MEM and incubated for various periods of time with 1.0 ml of MEM containing 1.0 mg BSA/ml (MEM/BSA) and different concentrations of each compound. The culture fluids were then decanted, centrifuged at 2000 × g for 10 min, and 200 μl of the supernate counted for radioactivity. Radioactivity recovered in the washes before the incubation was compared to input radioactivity to calculate the % radioactivity incorporated into the cells [31]. For PGI2 production, 1.0 ml of MEM supplemented with 10% fetal bovine serum, void of [3H]AA, was added after the first 24-h incubation. The cells were incubated for another 24-h, washed three times with MEM, then incubated with the compounds in MEM/BSA for various periods of time. The culture fluids were decanted and analyzed for 6-keto-PGF1α, the stable hydrolytic product of PGI2, by radioimmunoassay [32].
The [3H] AA release is presented as a percentage of the radioactivity incorporated by the cells. Except for the time-course experiments which used duplicate dishes, three to five culture dishes were used for each experimental point. The data are expressed as mean values ± SEM. The data were evaluated statistically by the unpaired Student's t-test. A P value < 0.05 was considered significant.
Acknowledgments
Acknowledgements
My thanks to Hilda B. Gjika for preparation of the manuscript and to Dr. Armen H. Tashjian, Jr., Department of Genetic and Complex Diseases, Harvard School of Public Health, for his continuing interest in these studies.
References
- Kisselev AF, Goldberg AL. Proteasome inhibitors: from research tools to drug candidates. Chem Biol. 2001;8:739–758. doi: 10.1016/S1074-5521(01)00056-4. [DOI] [PubMed] [Google Scholar]
- Mitchell BS. The proteasome – an emerging therapeutic target in cancer. N Engl J Med. 2003;348:2597–2598. doi: 10.1056/NEJMp030092. [DOI] [PubMed] [Google Scholar]
- Adams J. Potential for proteasome inhibition in the treatment of cancer. Drug Discov Today. 2003;8:307–315. doi: 10.1016/S1359-6446(03)02647-3. [DOI] [PubMed] [Google Scholar]
- Hanada M, Sugawara K, Kaneta K, Toda S, Nishiyama Y, Tomita K, Yamamoto H, Konishi M, Oki T. Epoxomicin, a new antitumor agent of microbial origin. J Antibiot (Tokyo. 1992;45:1746–1752. doi: 10.7164/antibiotics.45.1746. [DOI] [PubMed] [Google Scholar]
- Meng L, Mohan R, Kwok BH, Elofsson M, Sin N, Crews CM. Epoxomicin, a potent and selective proteasome inhibitor, exhibits in vivo antiinflammatory activity. Proc Natl Acad Sci U S A. 1999;96:10403–10408. doi: 10.1073/pnas.96.18.10403. [DOI] [PMC free article] [PubMed] [Google Scholar]
- Ostrowska H, Wojcik C, Omura S, Worowski K. Lactacystin, a specific inhibitor of the proteasome, inhibits human platelet lysosomal cathepsin A-like enzyme. Biochem Biophys Res Commun. 1997;234:729–732. doi: 10.1006/bbrc.1997.6434. [DOI] [PubMed] [Google Scholar]
- Mellgren RL. Specificities of cell permeant peptidyl inhibitors for the proteinase activities of mu-calpain and the 20 S proteasome. J Biol Chem. 1997;272:29899–29903. doi: 10.1074/jbc.272.47.29899. [DOI] [PubMed] [Google Scholar]
- Bogyo M, McMaster JS, Gaczynska M, Tortorella D, Goldberg AL, Ploegh H. Covalent modification of the active site threonine of proteasomal beta subunits and the Escherichia coli homolog HslV by a new class of inhibitors. Proc Natl Acad Sci U S A. 1997;94:6629–6634. doi: 10.1073/pnas.94.13.6629. [DOI] [PMC free article] [PubMed] [Google Scholar]
- Bromme D, Klaus JL, Okamoto K, Rasnick D, Palmer JT. Peptidyl vinyl sulphones: a new class of potent and selective cysteine protease inhibitors: S2P2 specificity of human cathepsin O2 in comparison with cathepsins S and L. Biochem J. 1996;315:85–89. doi: 10.1042/bj3150085. [DOI] [PMC free article] [PubMed] [Google Scholar]
- Levine L. Proteolysis negatively regulates agonist-stimulated arachidonic acid metabolism. Cell Signal. 1998;10:653–659. doi: 10.1016/S0898-6568(98)00008-4. [DOI] [PubMed] [Google Scholar]
- Levine L. Lactacystin stimulates arachidonic acid metabolism in rat liver cells: effects of cell density on arachidonic acid release, PGI2 production and cyclooxygenase activity. Prostaglandins Leukot Essent Fatty Acids. 2000;63:371–375. doi: 10.1054/plef.2000.0230. [DOI] [PubMed] [Google Scholar]
- Rockwell P, Yuan H, Magnusson R, Figueiredo-Pereira ME. Proteasome inhibition in neuronal cells induces a proinflammatory response manifested by upregulation of cyclooxygenase-2, its accumulation as ubiquitin conjugates, and production of the prostaglandin PGE(2) Arch Biochem Biophys. 2000;374:325–333. doi: 10.1006/abbi.1999.1646. [DOI] [PubMed] [Google Scholar]
- Rigas A, Levine L. Arachidonic acid metabolism by rat liver cells (the C-9 cell line) J Pharmacol Exp Ther. 1984;231:230–235. [PubMed] [Google Scholar]
- Levine L. Tamoxifen and the raloxifene analog LY117018: their effects on arachidonic acid release from cell in culture and on prostaglandin I2 production by rat liver cells. BMC Cancer. 2004. [DOI] [PMC free article] [PubMed]
- Smith WL. The eicosanoids and their biochemical mechanisms of action. Biochem J. 1989;259:315–324. doi: 10.1042/bj2590315. [DOI] [PMC free article] [PubMed] [Google Scholar]
- Edidin M. The state of lipid rafts: from model membranes to cells. Annu Rev Biophys Biomol Struct. 2003;32:257–279. doi: 10.1146/annurev.biophys.32.110601.142439. [DOI] [PubMed] [Google Scholar]
- Levine L. Does the release of arachidonic acid from cells play a role in cancer chemoprevention? FASEB J. 2003;17:800–802. doi: 10.1096/fj.02-0906hyp. [DOI] [PubMed] [Google Scholar]
- Levine L. Tamoxifen stimulates arachidonic acid release from rat liver cells by an estrogen receptor-independent, non-genomic mechanism. BMC Cancer. 2003;3:24. doi: 10.1186/1471-2407-3-24. [DOI] [PMC free article] [PubMed] [Google Scholar]
- Levine L. Statins stimulate arachidonic acid release and prostaglandin I2 production in rat liver cells. Lipids Health Dis. 2003;2:1. doi: 10.1186/1476-511X-2-1. [DOI] [PMC free article] [PubMed] [Google Scholar]
- Levine L. Nuclear receptor agonists stimulate release of arachidonic acid from rat liver cells. Prostaglandins Leukot Essent Fatty Acids. 2002;67:453–459. doi: 10.1054/plef.2002.0456. [DOI] [PubMed] [Google Scholar]
- Diaz BL, Arm JP. Phospholipase A(2) Prostaglandins Leukot Essent Fatty Acids. 2003;69:87–97. doi: 10.1016/S0952-3278(03)00069-3. [DOI] [PubMed] [Google Scholar]
- Praml C, Amler LC, Dihlmann S, Finke LH, Schlag P, Schwab M. Secretory type II phospholipase A2 (PLA2G2A) expression status in colorectal carcinoma derived cell lines and in normal colonic mucosa. Oncogene. 1998;17:2009–2012. doi: 10.1038/sj.onc.1202121. [DOI] [PubMed] [Google Scholar]
- Cormier RT, Hong KH, Halberg RB, Hawkins TL, Richardson P, Mulherkar R, Dove WF, Lander ES. Secretory phospholipase Pla2g2a confers resistance to intestinal tumorigenesis. Nature Genetics. 1997;17:88–91. doi: 10.1038/ng0997-88. [DOI] [PubMed] [Google Scholar]
- MacPhee M, Chepenik KP, Liddell RA, Nelson KK, Siracusa LD, Buchberg AM. The secretory phospholipase A2 gene is a candidate for the Mom1 locus, a major modifier of ApcMin-induced intestinal neoplasia. Cell. 1995;81:957–966. doi: 10.1016/0092-8674(95)90015-2. [DOI] [PubMed] [Google Scholar]
- Garrett IR, Chen D, Gutierrez G, Zhao M, Escobedo A, Rossini G, Harris SE, Gallwitz W, Kim KB, Hu S, Crews CM, Mundy GR. Selective inhibitors of the osteoblast proteasome stimulate bone formation in vivo and in vitro. J Clin Invest. 2003;111:1771–1782. doi: 10.1172/JCI200316198. [DOI] [PMC free article] [PubMed] [Google Scholar]
- Subbaramaiah K, Dannenberg AJ. Cyclooxygenase 2: a molecular target for cancer prevention and treatment. Trends Pharmacol Sci. 2003;24:96–102. doi: 10.1016/S0165-6147(02)00043-3. [DOI] [PubMed] [Google Scholar]
- Jordan VC, Morrow M. Tamoxifen, raloxifene, and the prevention of breast cancer. Endocr Rev. 1999;20:253–278. doi: 10.1210/er.20.3.253. [DOI] [PubMed] [Google Scholar]
- Brower V. Of cancer and cholesterol: studies elucidate anticancer mechanisms of statins. J Natl Cancer Inst. 2003;95:844–846. doi: 10.1093/jnci/95.12.844. [DOI] [PubMed] [Google Scholar]
- Brash AR. Arachidonic acid as a bioactive molecule. J Clin Invest. 2001;107:1339–1345. doi: 10.1172/JCI13210. [DOI] [PMC free article] [PubMed] [Google Scholar]
- Laye JP, Gill JH. Phospholipase A2 expression in tumours: a target for therapeutic intervention? Drug Discov Today. 2003;8:710–716. doi: 10.1016/S1359-6446(03)02754-5. [DOI] [PubMed] [Google Scholar]
- Levine L. Stimulated release of arachidonic acid from rat liver cells by celecoxib and indomethacin. Prostaglandins Leukot Essent Fatty Acids. 2001;65:31–35. doi: 10.1054/plef.2001.0284. [DOI] [PubMed] [Google Scholar]
- Levine L. In: Measurement of arachidonic acid metabolites by radioimmunoassay. Manual of Clinical Laboratory Immunology. 3. Rose NR, Friedman H, Fahey JL, editor. Washington DC: American Society for Microbiology; 1986. pp. 685–691. [Google Scholar]


