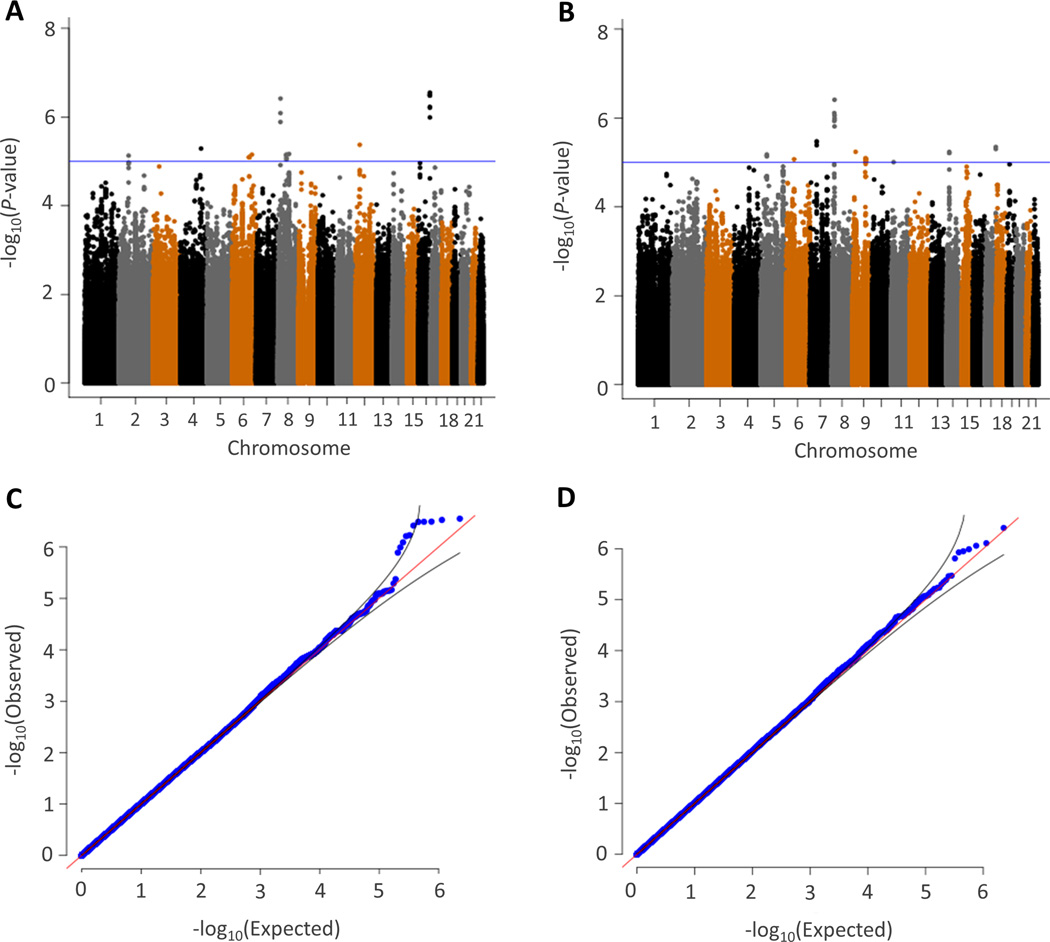
Figure 1.
Manhattan (a, b) and quantile-quantile (c, d) plots from meta-analysis of genome-wide association for systolic (a, c) and diastolic (b, d) blood pressure response to hydrochlorothiazide. Each dot signifies a SNP. In the Manhattan plots, genomic coordinates are displayed along the X-axis with the negative logarithm of the association P-value displayed on the Y-axis. The blue line refers to −log10(P)=5. The quantile-quantile plots compare the observed results (−log10(P), X axis) versus the theoretically expected values (Y axis).

