

Abstract
The development of immunologic interventions that can target the viral reservoir in HIV-1-infected individuals is a major goal of the HIV-1 cure field1,2. However, little evidence exists that the viral reservoir can be sufficiently targeted to improve virologic control following discontinuation of antiretroviral therapy (ART). Here we show that Ad26/MVA3,4 therapeutic vaccination with toll-like receptor 7 (TLR7) stimulation improves virologic control and delays viral rebound following ART discontinuation in SIV-infected rhesus monkeys that initiated ART during acute infection. Ad26/MVA therapeutic vaccination resulted in a dramatic increase in the magnitude and breadth of SIV-specific cellular immune responses in virologically suppressed, SIV-infected monkeys. TLR7 agonist administration led to innate immune stimulation and cellular immune activation. The combination of Ad26/MVA vaccination and TLR7 stimulation resulted in decreased levels of viral DNA in lymph nodes and peripheral blood, as well as improved virologic control and delayed viral rebound following ART discontinuation. Cellular immune breadth correlated inversely with setpoint viral loads and correlated directly with time to viral rebound. These data demonstrate the potential of therapeutic vaccination with innate immune stimulation as a strategy aimed at an HIV-1 functional cure.
The critical barrier to HIV-1 cure is the viral reservoir in latently infected CD4+ T lymphocytes5–8, which leads to viral rebound in the vast majority of HIV-1-infected individuals following discontinuation of ART9,10. Enhancing antiviral immune responses, potentially together with activation of the viral reservoir, might be able to eliminate these cells1,2,11. However, it is currently unknown whether immunologic interventions can impact the viral reservoir in vivo. In particular, it is unclear if a therapeutic vaccine will be able to induce cellular immune responses with sufficient potency and breadth to control viral rebound following ART discontinuation12. We therefore evaluated a strategy consisting of Ad26/MVA therapeutic vaccination3,4 and TLR7 agonist GS-986 administration in ART suppressed, SIV-infected rhesus monkeys.
We infected 36 Indian origin rhesus monkeys (Macaca mulatta) with SIVmac2514,13 by a single intrarectal exposure and initiated daily subcutaneous administration of a pre-formulated ART cocktail (tenofovir disoproxil fumarate, emtricitabine, dolutegravir)14 on day 7 of acute infection. Animals had median plasma SIV RNA levels of 7.10 log copies/ml (range 6.04–7.88 log copies/ml) on the day of ART initiation (Fig. 1a). SIV RNA levels were controlled in the majority of animals by day 56 and in all animals by day 224 (Fig. 1a). SIV RNA levels were comparable among the different groups, and the animals that took longer to control virus had higher starting plasma viral loads on day 7 (P=0.04; data not shown).
Figure 1. SIV RNA and vaccine immunogenicity prior to ART discontinuation.

(a) Rhesus monkeys were infected with SIVmac251 on day 0 and initiated ART on day 7 (N=9 animals/group). Ad26 and MVA vaccination timepoints are shown with the vertical arrows. The timeframe for TLR7 agonist administration (10 doses every 2 weeks) is shown by the horizontal bar. Log SIV RNA copies/ml are shown (limit of detection 2.3 log RNA copies/ml). (b) IFN-γ ELISPOT responses in response to Gag, Pol, and Env peptide pools from SIVmac239 and SIVsmE543. Group numbers and timepoints are denoted on the x-axis. Group 1 received the Ad26/MVA vaccine alone, and Group 2 received the Ad26/MVA vaccine + TLR7 agonist. P values indicate 2-sided Wilcoxon rank-sum tests compared with week 24 (pre-vaccination). (c) Cellular immune breadth in the vaccinated animals as measured by subpools of 10 peptides spanning the SIVmac239 Gag, Pol, and Env proteins at week 0 (naïve), week 20 (pre-vaccination), week 29 (Ad26), and week 50 (MVA). The numbers of positive subpools are indicated in red. P values indicate 2-sided Wilcoxon rank-sum tests.
Following 24 weeks of suppressive ART, groups of monkeys received the following interventions: (1) Ad26/MVA vaccines alone, (2) Ad26/MVA vaccines + TLR7 agonist GS-986, (3) TLR7 agonist GS-986 alone, or (4) sham (N=9 animals/group). In Groups 1–2, animals were vaccinated by the intramuscular route with 3×10¹⁰ viral particles (vp) Ad26 vectors4,15 expressing SIVsmE543 Gag/Pol/Env at weeks 24 and 36, and were boosted with 108 plaque-forming units (pfu) MVA vectors4 expressing SIVsmE543 Gag/Pol/Env at weeks 48 and 60. In Groups 2–3, animals received 10 administrations of 0.3 mg/kg GS-986 (Gilead Sciences, Foster City, CA) by oral gavage every 2 weeks from weeks 50–70. In the combination intervention group, animals initiated GS-986 at peak immunity 2 weeks after the first MVA boost immunization. TLR7 triggering is known to activate dendritic cells and lymphocytes and to lead to innate immune activation, including secretion of cytokines and chemokines16,17. We observed nonspecific activation of CD8+ and CD4+ T cells as measured by CD69 expression 1–2 days following each GS-986 administration (Extended Data Figs. 1–2) as well as increased plasma levels of IFN-α (Extended Data Fig. 3), thus confirming the immunostimulatory activity of GS-986. Other proinflammatory cytokines and chemokines were also induced by GS-986, including IL-1RA, IL-6, IL-23, CXCL9 (MIG), CXCL11 (I-TAC), CCL4 (MIP-1β), and CCL11 (Eotaxin) (data not shown).
We next evaluated the immunogenicity of the Ad26/MVA vaccine. The groups that received the vaccine demonstrated a robust >100-fold increase in the magnitude of Gag/Pol/Env-specific cellular immune responses as compared with pre-vaccination responses by IFN-γ ELISPOT assays (Fig. 1b). Cellular immune responses increased substantially at week 28 after Ad26 priming and further increased at week 50 after MVA boosting against both vaccine-matched SIVsmE543 peptides and virus-matched SIVmac239 peptides. We also observed induction of robust Gag/Pol/Env-specific CD8+ and CD4+ T cell responses as measured by multiparameter intracellular cytokine staining assays (Extended Data Figs. 4–5). These responses were higher magnitude than those elicited with this same vaccine in SIV-uninfected rhesus monkeys4.
Ad26/MVA vaccination also expanded cellular immune breadth by at least 9.2-fold, as measured by IFN-γ ELISPOT assays using subpools of 10 peptides spanning Gag, Pol, and Env (Fig. 1c; Extended Data Fig. 6). Total breadth was defined as the number of Gag+Pol+Env positive subpools. We were unable to fine map individual epitopes due to insufficient availability of cells given the number of positive subpools. Prior to vaccination at week 24, we observed an average of 1.9 positive subpools/animal (1.0 Gag, 0.4 Pol, 0.6 Env). Following Ad26 priming, cellular immune breadth markedly expanded to an average of 10.1 positive subpools/animal (4.4 Gag, 3.0 Pol, 3.1 Env). Following MVA boosting, cellular immune breadth further expanded to an average of 17.5 positive subpools/animal (5.4 Gag, 5.9 Pol, 6.2 Env) (Fig. 1c), which likely represents an underestimate of breadth, since some positive subpools may have contained more than one epitope. Several animals developed Gag/Pol/Env-specific T cells that targeted >50 epitopes. The expanded cellular immune breadth involved induction of a large number of new epitopes and did not simply reflect expansion of previously established responses, since the vast majority of the epitopes following vaccination were not observed prior to vaccination in conventional IFN-γ ELISPOT assays as well as in assays using PBMC stimulated in vitro with these peptides for enhanced sensitivity (data not shown). We speculate that early initiation of ART induced preserved CD4+ T cell help (Extended Data Fig. 5), which likely contributed to vaccine immunogenicity. Consistent with this hypothesis is the observation that cellular immune breadth correlated inversely with pre-ART day 7 SIV RNA (Extended Data Fig. 7), which may be a surrogate marker for immunologic damage. In contrast with robust cellular immune responses, only modest humoral immune responses were observed following vaccination, including binding antibody responses by ELISA as well as functional antibody-dependent cellular phagocytosis, neutrophil phagocytosis, and NK cell activation (data not shown).
We next assessed viral DNA in lymph nodes and PBMC using an RT-PCR assay14 with a sensitivity of 3 DNA copies/106 CD4+ T cells (Fig. 2a–b). In sham controls, viral DNA declined slightly between weeks 20 and 48, presumably reflecting the impact of suppressive ART, but no further decline was observed at week 70. In contrast, the two groups that received the Ad26/MVA vaccine demonstrated marked reductions of viral DNA to undetectable levels in the majority of animals by week 70 in both lymph nodes (Fig. 2a) and PBMC (Fig. 2b), suggesting that vaccination led to substantial reductions in SIV-infected CD4+ T cells in these tissue compartments. It is possible that a larger fraction of proviruses might be transcriptionally active following early ART initiation as compared with ART initiation during chronic infection, although this remains to be determined8. Viral outgrowth assays using 20 million PBMC were negative in all animals including controls at week 70 (data not shown), presumably as a result of early initiation of ART.
Figure 2. SIV DNA prior to ART discontinuation.

Log SIV DNA copies/106 CD4+ T cells are shown (limit of detection 3 DNA copies/106 cells) in (a) inguinal lymph node mononuclear cells and (b) peripheral blood mononuclear cells (PBMC). Week 48 reflects post-Ad26 priming, and week 70 reflects post-MVA boosting. P values indicate 2-sided Wilcoxon rank-sum tests.
To evaluate the therapeutic efficacy of the interventions, we discontinued ART at week 72. Viral rebound was observed in all animals (Fig. 3a). All sham controls rebounded by day 10–14 following ART discontinuation in a stereotypical fashion and exhibited median setpoint plasma SIV RNA levels of 4.89 log copies/ml (range 4.27–5.57 log copies/ml) on day 168 following ART discontinuation. The monkeys that received GS-986 alone did not demonstrate any discernable delay or control of viral rebound, indicating that TLR7 stimulation alone exerted no detectable antiviral effect in this study. Animals that received the Ad26/MVA vaccine alone exhibited a 0.66 log reduction of median setpoint plasma SIV RNA levels to 4.23 log copies/ml (range 2.70–4.91 log copies/ml) (P=0.002, Wilcoxon rank-sum test) but only a marginal delay of viral rebound (P=0.01, Wilcoxon rank-sum test) as compared with controls (Fig. 3b–c). In contrast, monkeys that received both the Ad26/MVA vaccine and GS-986 showed a striking 1.74 log reduction of median setpoint plasma SIV RNA levels to 3.15 log copies/ml (range <2.30–4.09 log copies/ml) (P<0.0001) and a 2.5-fold delay of viral rebound from a median of 10 to 25 days as compared with controls (P=0.003) (Fig. 3b–c). Moreover, 33% (3 of 9) of the monkeys in the combination intervention group showed effective virologic control to undetectable setpoint viral loads (<2.30 log copies/ml) following ART discontinuation. These data demonstrate that the combination of Ad26/MVA vaccination and TLR7 stimulation improved virologic control and delayed viral rebound following ART discontinuation.
Figure 3. SIV RNA following ART discontinuation.

(a) Log SIV RNA copies/ml are shown (limit of detection 2.3 log RNA copies/ml) following ART discontinuation at study week 72. Days following ART discontinuation are shown on the x-axis. (b) Median log SIV RNA in each group. (c) Statistical analysis of setpoint levels of SIV RNA and time to viral rebound in each group. P values indicate 2-sided Wilcoxon rank-sum tests.
We next evaluated the immunologic and virologic correlates of virologic control. Cellular immune breadth immediately prior to ART discontinuation (Fig. 4a) as well as at peak immunity (Extended Data Fig. 8) correlated inversely with setpoint viral loads following ART discontinuation, particularly the breadth of Gag, Env, and total responses (P<0.0001, Spearman rank-correlation tests). Gag, Env, and total cellular immune breadth also correlated directly with the time to viral rebound (Fig. 4b, Extended Data Fig. 9; P=0.0001 to P=0.001). Consistent with the correlates analyses, mathematical modeling of viral dynamics further suggested that the combination of changes in the reservoir exit rate and the early viral growth rate accounted for the differences in the time to viral rebound, whereas the virus-specific immune proliferation rate was likely responsible for virologic control (Extended Data Fig. 10).
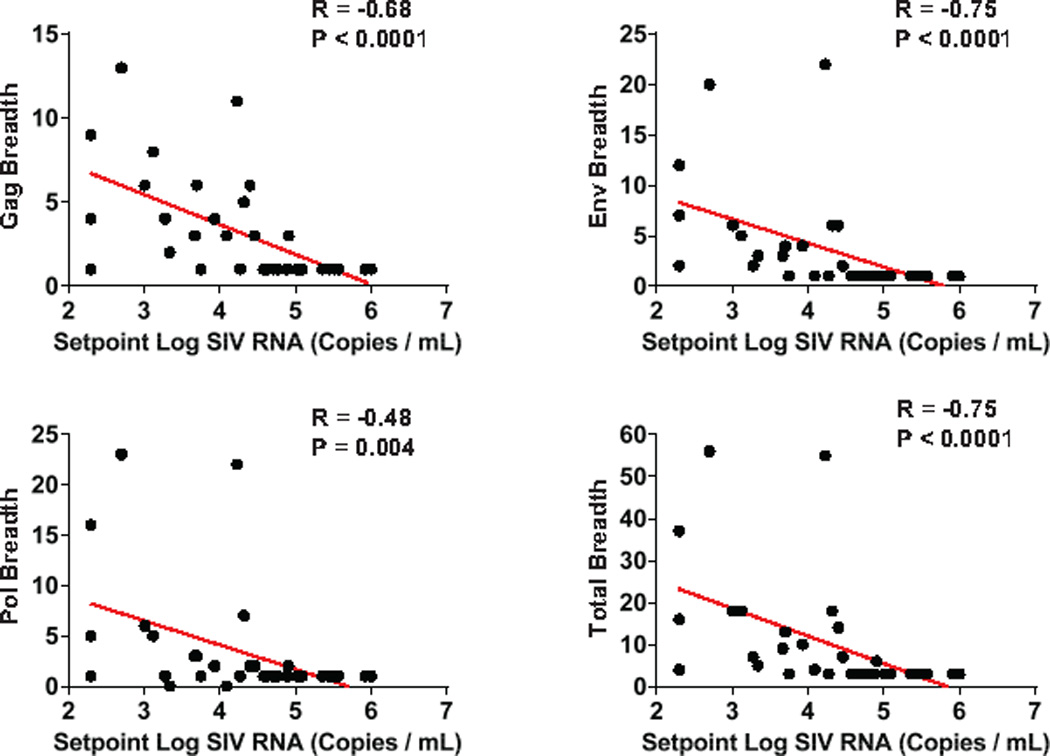
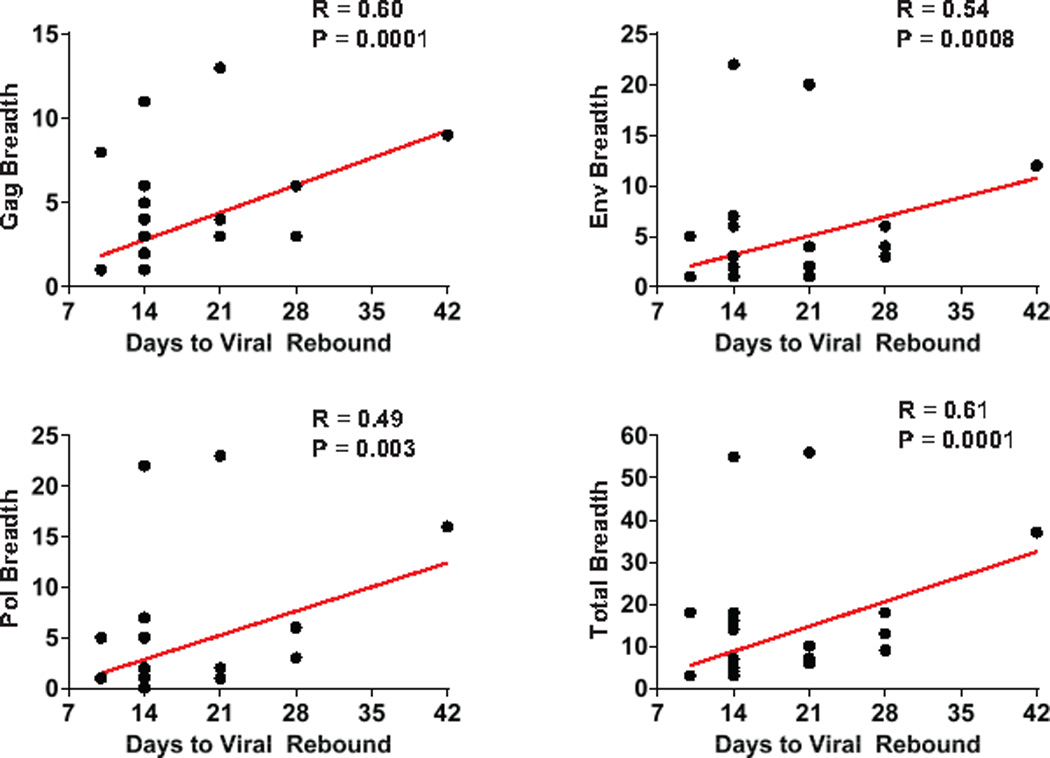
Figure 4. Correlations of cellular immune breadth with setpoint viral loads and time to viral rebound.

Correlations are shown for the breadth of Gag, Pol, Env, and total (Gag+Pol+Env) cellular immune responses as defined as the number of positive subpools at the time of ART discontinuation at week 72 and (a) setpoint log SIV RNA or (b) time to viral rebound following ART discontinuation. P values indicate 2-sided Spearman rank-correlation tests.
Viral DNA in lymph nodes and PBMC correlated poorly with virologic control following ART discontinuation and time to viral rebound (P=0.03, data not shown), presumably because all animals with undetectable viral DNA still rebounded. These findings suggest that these viral DNA assays are not sufficiently sensitive to predict functional cure, consistent with recent clinical observations18,19. Moreover, there was no correlation between day 7 pre-ART SIV RNA or time to initial virologic suppression on ART and virologic control following ART discontinuation (P=NS).
In this study, we demonstrate that Ad26/MVA therapeutic vaccination robustly augmented cellular immune magnitude and breadth in ART-suppressed, SIV-infected rhesus monkeys and that the TLR7 agonist GS-986 led to innate immune stimulation and cellular activation. The combination of Ad26/MVA vaccination and GS-986 resulted in a significant 1.74 log reduction in median setpoint viral loads and a 2.5-fold delay in the time to viral rebound following ART discontinuation as compared with sham controls. Moreover, 3 of 9 animals in this group demonstrated virologic control to undetectable levels in the absence of ART. These three animals were characterized by high cellular immune magnitude and breadth and negative viral DNA prior to ART discontinuation. Taken together, these data demonstrate the proof-of-concept that the combination of therapeutic vaccination and innate immune stimulation can impact viral rebound following ART discontinuation.
The Ad26/MVA vaccine induced remarkably potent IFN-γ ELISPOT responses in the ART-suppressed, SIV-infected monkeys in the present study, consistent with a previous prophylactic vaccine study in uninfected monkeys4. We speculate that preserved CD4+ T cell help, primed by short-term viral replication following SIV infection prior to ART initiation on day 7, likely enhanced vaccine immunogenicity. The Ad26/MVA vaccine also expanded cellular immune breadth by nearly 10-fold, including induction of responses to a large number of epitopes that were not detectable following SIV infection. This may be critical for a therapeutic vaccine, because the viral reservoir typically contains viruses with T cell epitope escape mutations12. We did not detect evidence for viral “blipping” on day 1 or day 2 following TLR7 agonist administration (J. Whitney, unpublished data), which may reflect the early initiation of ART on day 7 of infection and thus the limited size of the viral reservoirs in this study14. We were therefore unable to determine whether the beneficial effect of the TLR7 agonist reflected its potential role as a vaccine adjuvant, a latency reversing agent, or both. Future studies should be performed in SIV-infected monkeys that initiate ART during chronic infection, which would be more representative of the majority of HIV-1-infected individuals. Moreover, future studies could explore longer periods of ART suppression, potentially to reduce residual viral replication, although the majority of animals appear to have a stable reservoir after 24–72 weeks of ART14. The capacity of immunologic interventions to target follicular helper CD4+ T cells in lymph nodes should also be explored20.
Previous studies of poxvirus-, adenovirus-, and DNA-based therapeutic vaccines have typically shown only a modest impact on viral rebound following ART discontinuation in both rhesus monkeys21 and humans22,23. The present study extends these prior observations by combining therapeutic vaccination with innate immune stimulation. Of note, the combination of Ad26/MVA vaccination and TLR7 stimulation proved more potent than either component alone. This finding is consistent with a prior in vitro study that showed that robust CD8+ T cells may be able to facilitate elimination of the viral reservoir following reactivation11. The present study also demonstrates that the breadth of Gag/Pol/Env-specific T cell responses correlated inversely with setpoint viral loads following ART discontinuation, suggesting that the mechanism underlying the therapeutic efficacy of the vaccine involved expansion of cellular immune breadth and immunologic control of virus rebounding from the reservoir.
In summary, our data suggest the potential of combining therapeutic vaccination with innate immune stimulation as an HIV-1 cure strategy. Our findings show that these interventions can improve virologic control and delay viral rebound following ART discontinuation in SIV-infected rhesus monkeys that initiated ART during acute infection. Additional preclinical and clinical studies with Ad26/MVA vaccination and TLR7 stimulation should be performed to explore this strategy in greater detail.
Methods
Animals
32 outbred Indian-origin, young adult male and female rhesus monkeys (Macaca mulatta) were genotyped and selected as negative for the protective MHC class I alleles Mamu-A*01, Mamu-B*08, and Mamu-B*17. Animals expressing susceptible and resistant TRIM5α alleles were distributed amongst the groups. Animals were otherwise randomly allocated to groups. All monkeys were housed at Bioqual, Rockville, MD. Animals were infected with 500 TCID50 of our SIVmac251 challenge stock4,13,24 by the intrarectal route. Monkeys were bled up to two times per week for viral load determinations. Immunologic and virologic assays were performed blinded. All animal studies were approved by the appropriate Institutional Animal Care and Use Committee (IACUC).
ART regimen
The preformulated antiretroviral therapy (ART) cocktail contained 5.1 mg/mL tenofovir disoproxil fumarate (TDF), 40 mg/mL emtricitabine (FTC), and 2.5 mg/mL dolutegravir (DTG) in a solvent containing 15% (v/v) kleptose adjusted to pH 4.2. This ART cocktail was administered once daily at 1 mL/kg body weight via the subcutaneous route.
Ad26/MVA vaccination and TLR7 agonist GS-986 administration
In Groups 1–2, monkeys were primed by the intramuscular route with 3×10¹⁰ viral particles (vp) Ad26 vectors4,15 expressing SIVsmE543 Gag/Pol/Env at weeks 24 and 36, and were boosted with 108 plaque-forming units (pfu) MVA vectors4 expressing SIVsmE543 Gag/Pol/Env at weeks 48 and 60. In Groups 2–3, animals received 10 administrations of 0.3 mg/kg GS-986 (Gilead Sciences, Foster City, CA) by oral gavage every 2 weeks from weeks 50–70.
Cellular immune assays
SIV-specific cellular immune responses were assessed by IFN-γ ELISPOT assays and multiparameter ICS assays essentially as described4. Estimates of cellular immune breadth involved IFN-γ ELISPOT assays using subpools of 10 peptides across the Gag, Pol, and Env proteins. 12-color ICS assays were performed with the Aqua green-fluorescent reactive dye (Invitrogen, L23101) and predetermined titers of mAbs (Becton-Dickinson) against CD3 (SP34; Alexa Fluor 700), CD4 (OKT4; BV711, Biolegend), CD8 (SK1; allophycocyanin-cyanine 7 [APC-Cy7]), CD28 (L293; BV610), CD95 (DX2; allophycocyanin [APC]), CD69 (TP1.55.3; phycoerythrin-Texas red [energy-coupled dye; ECD]; Beckman Coulter), gamma interferon (IFN-γ) (B27; phycoerythrin-cyanine 7 [PE-Cy7]), Ki67 (B56; fluorescein isothiocyanate [FITC]), CCR5 (3A9; phycoerythrin [PE]), CCR7(3D12; Pacific Blue), and PD-1(EH21.1; peridinin chlorophyll-A-cyanine 5.5 [PerCP-Cy5.5]). IFN-γ backgrounds were consistently <0.01% in PBMC.
Viral RNA assays
Viral RNA was isolated from cell-free plasma using a viral RNA extraction kit (Qiagen) and was quantitated essentially as described14.
Viral DNA assays
Levels of proviral DNA were quantitated as previously described14. Total cellular DNA was isolated from 5×10⁶ cells using a QIAamp DNA Blood Mini kit (Qiagen). The absolute quantification of viral DNA in each sample was determined by qPCR using primers specific to a conserved region SIVmac239. All samples were directly compared to a linear virus standard and the simultaneous amplification of a fragment of human GAPDH gene. PCR assays were performed with 100–200 ng sample DNA.
Statistical analyses
Analysis of virologic and immunologic data was performed using GraphPad Prism v6.03 (GraphPad Software, CA, USA). Comparisons of groups was performed using 2-sided Wilcoxon rank-sum tests without Bonferroni adjustments. Correlations were assessed by 2-sided Spearman rank-correlation tests without Bonferroni adjustments.
Viral dynamics modeling
We employed viral dynamics modeling to better characterize the kinetics of viral rebound and to gain insight into the mechanism behind the improved control of rebound in certain groups of treated animals. We were particularly interested in whether the effect of the vaccine and TLR7 agonist on rebound could be explained by a reduction in the latent reservoir size, or an antiviral immune response, or both.
Most existing viral dynamics models for HIV-1/SIV or other infections are not able to explain the diversity of kinetics seen in different animals in this study – such as rebound to a high setpoint, rebound to a high peak and lower setpoint, and rebound to a medium or high peak followed by control to undetectable levels – with mechanisms that are realistic for HIV-1/SIV. Specifically, for HIV-1 and SIV infection, exhaustion of target cells cannot alone explain the decline from peak viremia, which instead requires an immune response that can dramatically reduce the viral load set-point without significant changes in the death rate of virus-producing infected cells25. Inspired by other modeling work26–29, we developed a new model that was able to explain all these observations.
The model we used is described by a system of ordinary differential equations that track changes in the levels of uninfected (T) and infected (I) target cells, free virus (V), and precursor (P) and effector (E) immune responses over time (Extended Data Figure 10):
All variables are expressed as concentrations per mL of plasma. Parameter λ is the rate of production of susceptible uninfected cells (cells/mL/day), β is the viral infectivity ((copies/mL)−1 day−1), dI is the death rate of infected cells (day−1), dT is the death rate of death of uninfected cells (day−1), a is the rate at which latent cells reactivate to become productively infected (cells/day), k is the viral burst size (virions/cell/)(day−1) and c is the viral clearance rate (day−1). Our model of the immune response is general enough to describe either humoral or cellular effects. Precursor immune cells (naïve + memory) are produced at a baseline rate m (cells/mL/day), proliferate at an antigen-dependent rate, and die at a rate dP (day−1). The maximum proliferate rate is p (day−1) and half-maximal proliferation occurs at viral load NP (copies/mL). A fraction f of all proliferating cells differentiate into effectors, which die at a rate dE (day−1). Effectors reduce the rate at which actively infected cells are produced (either by inactivating free virus or killing early-stage infected cells29,30), with half-maximal inhibition occurring at a concentration NE (cell/mL).
During ART, β = 0, and virus and cells reach steady states at values T0 = λ/dT, I0 = (a/dI), V0 = (a/dI)(k/c), P0 ≈ (m/dP), and E0 ≈ 0 (since V0 ≪ NP) which we take as the initial conditions at the time of ART interruption.
Since we only have longitudinal observations of viral load, we cannot uniquely identify all the parameters of this model. We conducted extensive analytic and numeric investigation of the model to determine which parameters were most important for the dynamics and which could be estimated from the available data. Based on this knowledge and our previous work14, we fixed the parameter dI = 0.4 (day−1)14, dT = 0.05 (day−1), dP = 0.001 (day−1), dE = 1 (day−1), f = 0.9. Since only the ratio m/NE can be identified from the viral load data, we fixed NE =104. The ratio (k/c) was fixed to 2,000 virus/cell based on a burst size of k = 5×10⁴ (virions/cell)(day−1) and c = 23 day−1 for SIV32–34. The other parameters (λ, β, a, m, p, NP) were fit. We also fit results to a simpler model with no antigen-dependent immune response (P, E = 0) to ensure that the fits were improved by adding in the extra terms. We modeled the effect of antiretroviral drug decay by including a 3-day washout period during which virus could not productively reproduce. Varying this period between 0 and 6 days did not change conclusions from the model.
Models were fit to each animal individually using a Bayesian framework. Briefly, a joint posterior distribution was estimated for the fitted parameters using a likelihood function for the viral load at each time point and very weakly-informative priors on the fitted parameters (see below). We parameterized the model using log-transformed parameters to account for the possibility of large parameter variations between monkeys. The likelihood assumes that the observed viral load is log-normally distributed around the true viral load, and that measurements include an error with variance σ2 (which we fixed at 0.1 based on previous work). The estimated posterior distribution was sampled using the Metropolis-Hastings algorithm implemented in R using the package MHadaptive35 and the differential equations were numerically integrated using deSolve36. After a burn-in of 104 iterations, 105 updates were run and 1 in 10 samples were collected. The resulting fits were visually inspected to make sure they were consistent with the observed viral load. We specified the prior for each parameter independently according to:
with the means for each parameter log10(λ) = 1.3, log10(β) = −6, log10(a) = −4.5, log10(m) = 0, log10(p) = −4, and log10(NP) = 4.
Beyond the individual parameters, we also calculated a composite parameter describing the exponential growth rate of the virus immediately following rebound, r, as
We also calculated the time of rebound (τr) as the time at which viral load was expected to be exactly equal to the detection limit of vd = 200c/ml, by numerically integrating the differential equations until V(t) = vd.
In Extended Data Figure 10, we show results of the fits. Values shown represent the median and 95% credible intervals of the posterior of the mean of the group. The posterior mean was constructed by repeatedly sampling one value from the posterior of each animal in the group, and then taking the mean. P values reported for an increase in the posterior mean represent the probability that a random sample from the posterior mean in one group is smaller than a sample from the posterior mean in the other.
Extended Data
Extended Data Figure 1. Activation of CD8+ T cells following GS-986 administration.
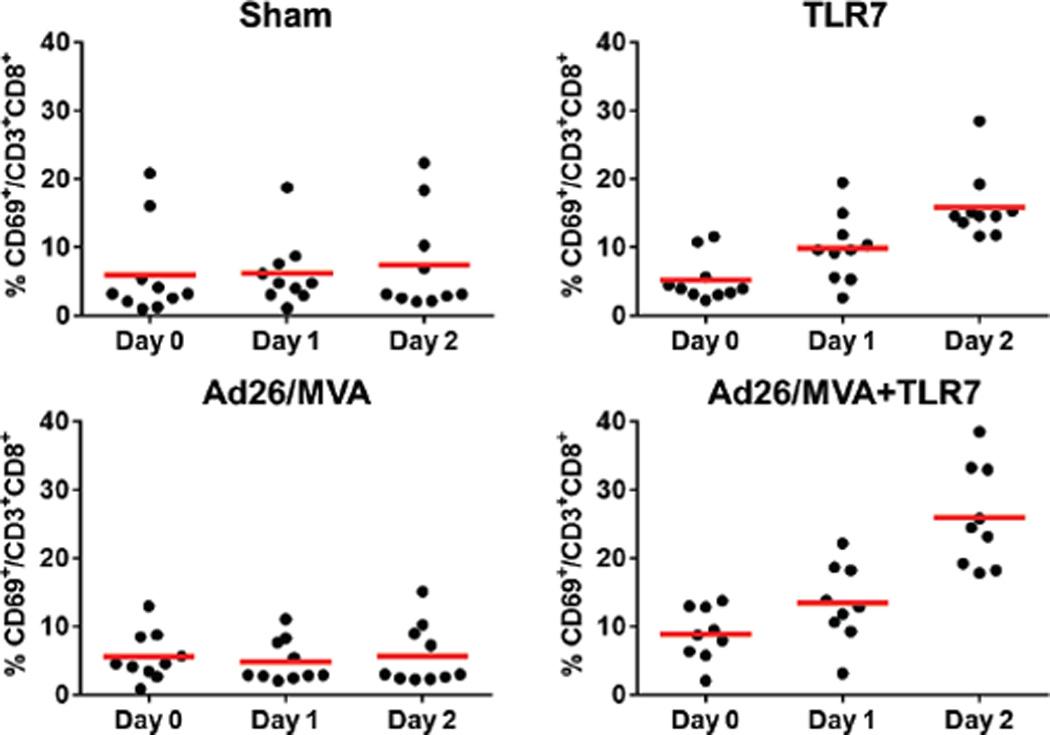
Representative data on days 0, 1, and 2 following GS-986 administration. Activation was assessed by CD69 expression on CD3+CD8+ T cells.
Extended Data Figure 2. Activation of CD4+ T cells following GS-986 administration.
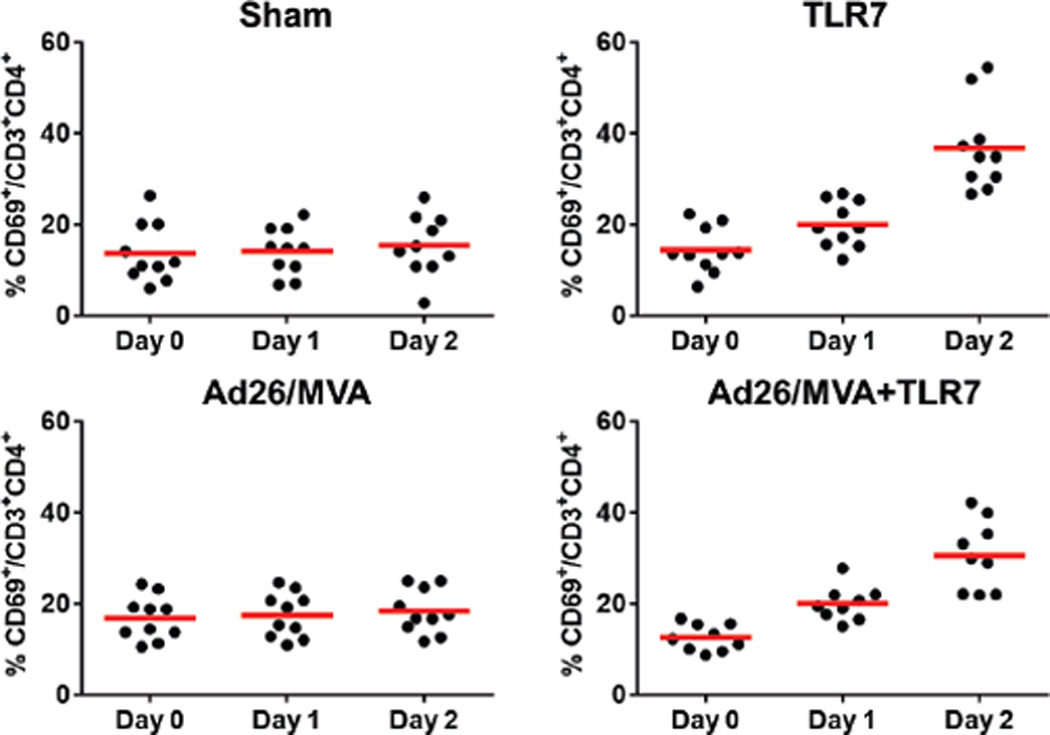
Representative data on days 0, 1, and 2 following GS-986 administration. Activation was assessed by CD69 expression on CD3+CD4+ T cells.
Extended Data Figure 3. Innate immune stimulation following GS-986 administration.
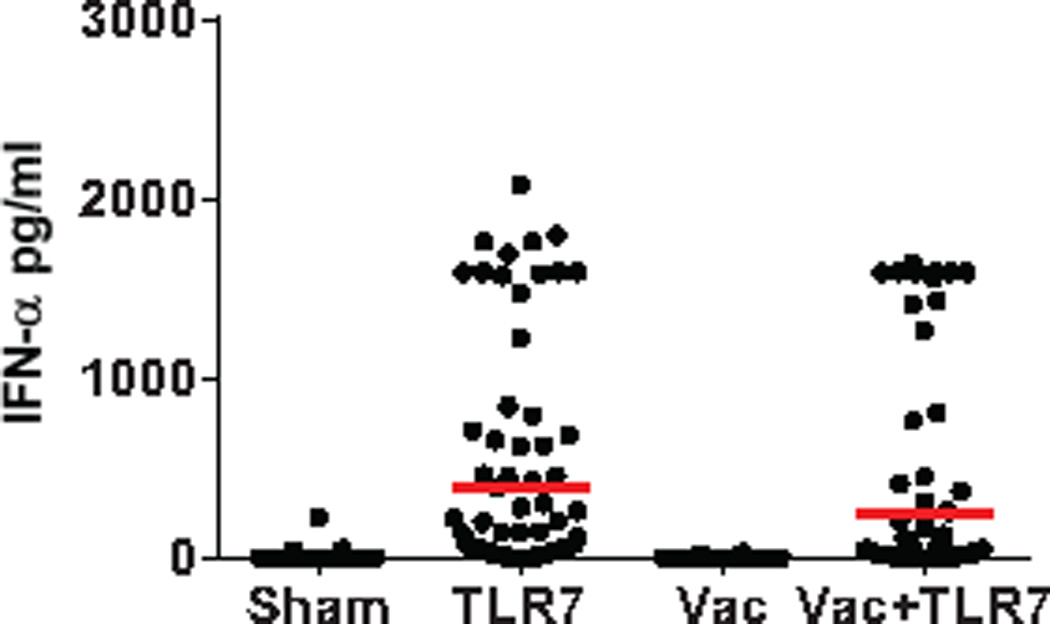
Plasma IFN-α (pg/ml) levels are shown on day 1 following GS-986 administration. Red bars represent mean values for each group. Data points reflect all animals following all GS-986 administrations combined with pre-dose levels subtracted.
Extended Data Figure 4. CD8+ T cells following Ad26/MVA vaccination.
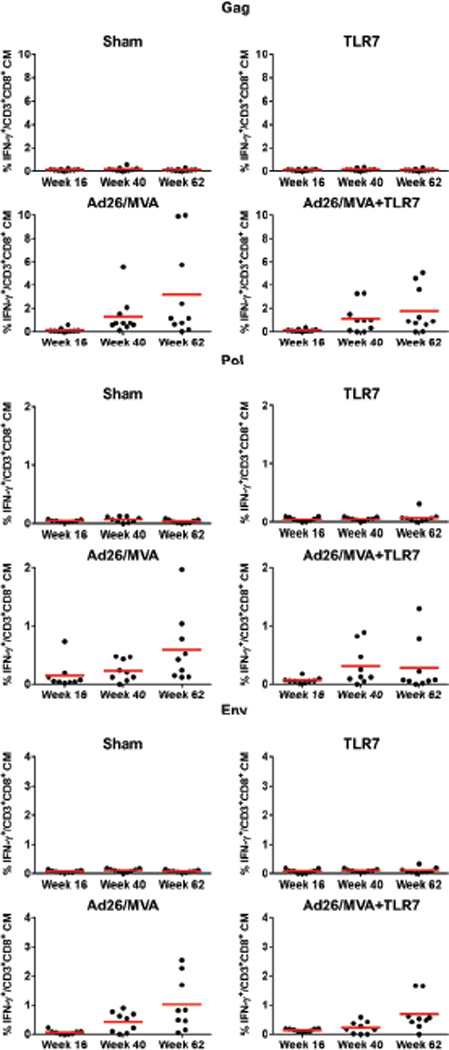
SIVmac239 Gag/Pol/Env-specific, IFN-γ+CD3+CD8+ central memory T cells were assessed by multiparameter intracellular cytokine staining assays.
Extended Data Figure 5. CD4+ T cells following Ad26/MVA vaccination.
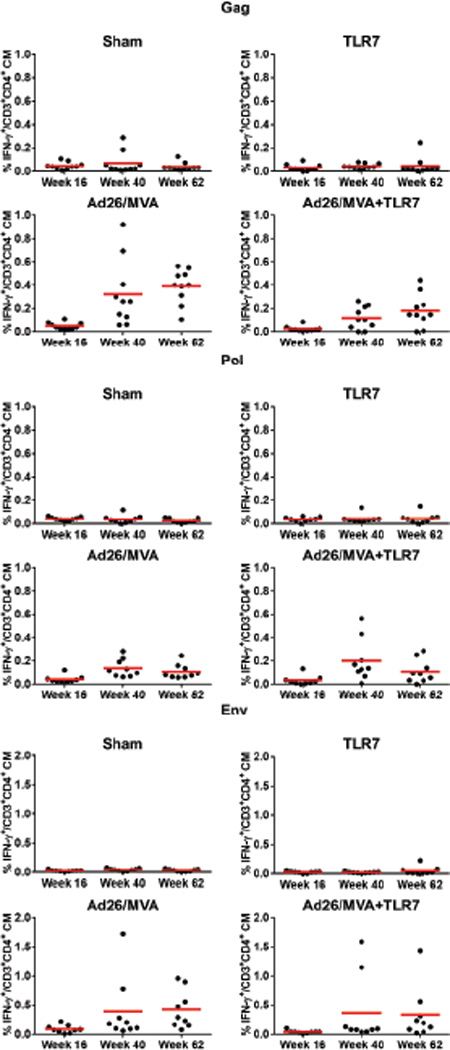
SIVmac239 Gag/Pol/Env-specific, IFN-γ+CD3+CD4+ central memory T cells were assessed by multiparameter intracellular cytokine staining assays.
Extended Data Figure 6. Cellular immune breadth.

Responses to subpools of 10 peptides spanning SIVmac239 Gag, Pol, and Env are shown prior to vaccination (week 20, blue), following Ad26 priming (week 29, red), and following MVA boosting (week 50, green). Colored squares indicate positive responses.×indicates missing data as a result of insufficient PBMC.
Extended Data Figure 7. Correlations of cellular immune breadth to day 7 SIV RNA.
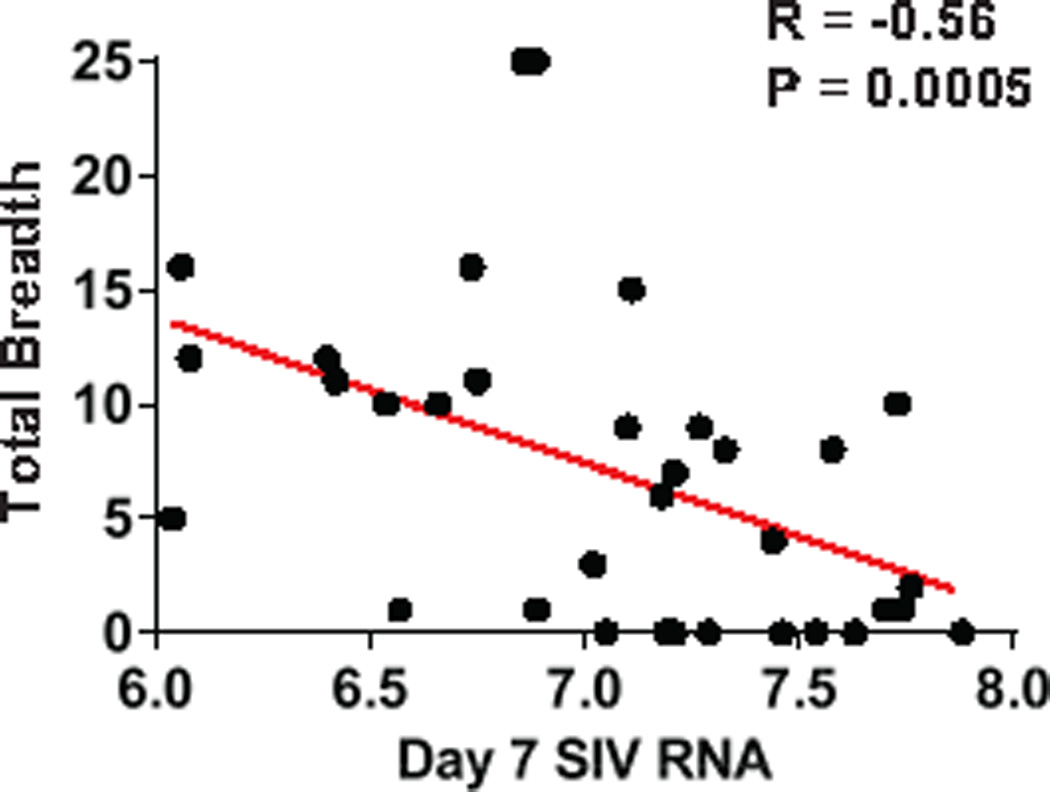
Correlations are shown for the breadth of Gag, Pol, Env, and Total (Gag+Pol+Env) cellular immune responses at the time of ART discontinuation at week 72 and pre-ART day 7 log SIV RNA.
Extended Data Figure 8. Correlations of cellular immune breadth to setpoint viral loads.
Correlations are shown for the breadth of Gag, Pol, Env, and total (Gag+Pol+Env) cellular immune responses at peak immunity at week 50 and setpoint log SIV RNA following ART discontinuation.
Extended Data Figure 9. Correlations of cellular immune breadth to time to viral rebound.
Correlations are shown for the breadth of Gag, Pol, Env, and total (Gag+Pol+Env) cellular immune responses at peak immunity at week 50 and time to viral rebound following ART discontinuation.
Extended Data Figure 10. Rebound kinetic parameters estimated from viral dynamics modeling.

Viral load values following ART discontinuation in each animal were fit to a viral dynamics model using a Bayesian framework. Plots show the median and 95% credible intervals for estimations of (a) the rate of reactivation of cells from the latent reservoir, (b) the initial exponential growth rate, (c) the immune proliferation rate, and (d) the time at which viral load reaches the detection threshold of 200 copies/ml for each treatment group. Monkeys treated with both the vaccine and TLR7 agonist exhibited slower viral growth rates and stronger immune responses than all other groups (P < 0.01 for each comparison). These monkeys and monkeys treated with only the vaccine exhibited a lower reservoir exit rate than untreated monkeys (P < 0.05 for each comparison).
Acknowledgments
We thank C. Linde, T. Broge, T. Barnes, D. van Manen, F. Wegmann, C. Shaver, W. Wagner, M. Boyd, R. Nityanandam, K. Smith, S. Blackmore, L. Parenteau, P. Giglio, M. Shetty, S. Levin, J. Shields, G. Neubauer, and F. Stephens for generous advice, assistance, and reagents. We acknowledge support from the U.S. Army Medical Research and Materiel Command and the Military HIV Research Program, Walter Reed Army Institute of Research through its cooperative agreement with the Henry M. Jackson Foundation (W81XWH-11-2-0174); the National Institutes of Health (AI096040, AI124377, AI126603, OD019851); the Ragon Institute of MGH, MIT, and Harvard. Mathematical model fitting was performed on the Orchestra High Performance Compute Cluster at Harvard Medical School. The views expressed in this manuscript are those of the authors and do not represent the official views of the Department of the Army or the Department of Defense.
Footnotes
Author Contributions
D.H.B, N.L.M., J.H.K., M.L.R., M.G.P., H.S., and R.G. designed the studies. J.H. and R.G. developed the ART formulation and TLR7 agonist. E.N.B., C.C., K.E.S., J.L., J.P.N., A.L.B., L.P., B.C.L., J.J., D.J., J.M., S.M., A.C., K.M., and G.A. conducted the studies and performed the immunologic assays. P.A. and D.N. conducted the virologic assays. J.M.G. and A.L.H. performed the viral dynamics modeling. M.G.L. led the clinical care of the rhesus monkeys. D.H.B. wrote the paper with all co-authors.
The authors declare no competing financial interests. M.G.P. and H.S. are employees of Janssen Infectious Diseases and Vaccines. J.H. and R.G. are employees of Gilead Sciences.
Data Availability
All data generated and analyzed in this study are available from the corresponding author upon reasonable request.
References
- 1.Barouch DH, Deeks SG. Immunologic strategies for HIV-1 remission and eradication. Science. 2014;345:169–174. doi: 10.1126/science.1255512. [DOI] [PMC free article] [PubMed] [Google Scholar]
- 2.Deeks SG, et al. International AIDS Society global scientific strategy: towards an HIV cure 2016. Nat Med. 2016 doi: 10.1038/nm.4108. [DOI] [PMC free article] [PubMed] [Google Scholar]
- 3.Barouch DH, et al. Protective efficacy of a global HIV-1 mosaic vaccine against heterologous SHIV challenges in rhesus monkeys. Cell. 2013;155:531–539. doi: 10.1016/j.cell.2013.09.061. [DOI] [PMC free article] [PubMed] [Google Scholar]
- 4.Barouch DH, et al. Vaccine protection against acquisition of neutralization-resistant SIV challenges in rhesus monkeys. Nature. 2012;482:89–93. doi: 10.1038/nature10766. [DOI] [PMC free article] [PubMed] [Google Scholar]
- 5.Finzi D, et al. Identification of a reservoir for HIV-1 in patients on highly active antiretroviral therapy. Science. 1997;278:1295–1300. doi: 10.1126/science.278.5341.1295. [DOI] [PubMed] [Google Scholar]
- 6.Persaud D, Zhou Y, Siliciano JM, Siliciano RF. Latency in human immunodeficiency virus type 1 infection: no easy answers. J Virol. 2003;77:1659–1665. doi: 10.1128/JVI.77.3.1659-1665.2003. [DOI] [PMC free article] [PubMed] [Google Scholar]
- 7.Chun TW, et al. Presence of an inducible HIV-1 latent reservoir during highly active antiretroviral therapy. Proc Natl Acad Sci U S A. 1997;94:13193–13197. doi: 10.1073/pnas.94.24.13193. [DOI] [PMC free article] [PubMed] [Google Scholar]
- 8.Ho YC, et al. Replication-competent noninduced proviruses in the latent reservoir increase barrier to HIV-1 cure. Cell. 2013;155:540–551. doi: 10.1016/j.cell.2013.09.020. [DOI] [PMC free article] [PubMed] [Google Scholar]
- 9.Finzi D, et al. Latent infection of CD4+ T cells provides a mechanism for lifelong persistence of HIV-1, even in patients on effective combination therapy. Nat Med. 1999;5:512–517. doi: 10.1038/8394. [DOI] [PubMed] [Google Scholar]
- 10.Chun TW, Davey RT, Jr, Engel D, Lane HC, Fauci AS. Re-emergence of HIV after stopping therapy. Nature. 1999;401:874–875. doi: 10.1038/44755. [DOI] [PubMed] [Google Scholar]
- 11.Shan L, et al. Stimulation of HIV-1-specific cytolytic T lymphocytes facilitates elimination of latent viral reservoir after virus reactivation. Immunity. 2012;36:491–501. doi: 10.1016/j.immuni.2012.01.014. [DOI] [PMC free article] [PubMed] [Google Scholar]
- 12.Deng K, et al. Broad CTL response is required to clear latent HIV-1 due to dominance of escape mutations. Nature. 2015;517:381–385. doi: 10.1038/nature14053. [DOI] [PMC free article] [PubMed] [Google Scholar]
- 13.Liu J, et al. Immune control of an SIV challenge by a T-cell-based vaccine in rhesus monkeys. Nature. 2009;457:87–91. doi: 10.1038/nature07469. [DOI] [PMC free article] [PubMed] [Google Scholar]
- 14.Whitney JB, et al. Rapid seeding of the viral reservoir prior to SIV viraemia in rhesus monkeys. Nature. 2014;512:74–77. doi: 10.1038/nature13594. [DOI] [PMC free article] [PubMed] [Google Scholar]
- 15.Abbink P, et al. Comparative seroprevalence and immunogenicity of six rare serotype recombinant adenovirus vaccine vectors from subgroups B and D. J Virol. 2007;81:4654–4663. doi: 10.1128/JVI.02696-06. [DOI] [PMC free article] [PubMed] [Google Scholar]
- 16.Kawai T, et al. Interferon-alpha induction through Toll-like receptors involves a direct interaction of IRF7 with MyD88 and TRAF6. Nat Immunol. 2004;5:1061–1068. doi: 10.1038/ni1118. [DOI] [PubMed] [Google Scholar]
- 17.Hemmi H, et al. Small anti-viral compounds activate immune cells via the TLR7 MyD88-dependent signaling pathway. Nat Immunol. 2002;3:196–200. doi: 10.1038/ni758. [DOI] [PubMed] [Google Scholar]
- 18.Henrich TJ, et al. Antiretroviral-free HIV-1 remission and viral rebound after allogeneic stem cell transplantation: report of 2 cases. Ann Intern Med. 2014;161:319–327. doi: 10.7326/M14-1027. [DOI] [PMC free article] [PubMed] [Google Scholar]
- 19.Persaud D, et al. Absence of detectable HIV-1 viremia after treatment cessation in an infant. N Engl J Med. 2013;369:1828–1835. doi: 10.1056/NEJMoa1302976. [DOI] [PMC free article] [PubMed] [Google Scholar]
- 20.Banga R, et al. PD-1(+) and follicular helper T cells are responsible for persistent HIV-1 transcription in treated aviremic individuals. Nat Med. 2016;22:754–761. doi: 10.1038/nm.4113. [DOI] [PubMed] [Google Scholar]
- 21.Hel Z, et al. Viremia control following antiretroviral treatment and therapeutic immunization during primary SIV251 infection of macaques. Nat Med. 2000;6:1140–1146. doi: 10.1038/80481. [DOI] [PubMed] [Google Scholar]
- 22.Rosenberg ES, et al. Safety and immunogenicity of therapeutic DNA vaccination in individuals treated with antiretroviral therapy during acute/early HIV-1 infection. PLoS ONE. 2010;5:e10555. doi: 10.1371/journal.pone.0010555. [DOI] [PMC free article] [PubMed] [Google Scholar]
- 23.Li JZ, et al. Factors associated with viral rebound in HIV-1-infected individuals enrolled in a therapeutic HIV-1 gag vaccine trial. J Infect Dis. 2011;203:976–983. doi: 10.1093/infdis/jiq143. [DOI] [PMC free article] [PubMed] [Google Scholar]
- 24.Liu J, et al. Low-dose mucosal simian immunodeficiency virus infection restricts early replication kinetics and transmitted virus variants in rhesus monkeys. J Virol. 2010;84:10406–10412. doi: 10.1128/JVI.01155-10. [DOI] [PMC free article] [PubMed] [Google Scholar]
- 25.Burg D, Rong L, Neumann AU, Dahari H. Mathematical modeling of viral kinetics under immune control during primary HIV-1 infection. J. Theor. Biol. 2009;259:751–759. doi: 10.1016/j.jtbi.2009.04.010. [DOI] [PubMed] [Google Scholar]
- 26.Wodarz D, et al. A new theory of cytotoxic T-lymphocyte memory: implications for HIV treatment. Philos. Trans. R. Soc. B Biol. Sci. 2000;355:329–343. doi: 10.1098/rstb.2000.0570. [DOI] [PMC free article] [PubMed] [Google Scholar]
- 27.Luzyanina T, Engelborghs K, Ehl S, Klenerman P, Bocharov G. Low level viral persistence after infection with LCMV: a quantitative insight through numerical bifurcation analysis. Math. Biosci. 2001;173:1–23. doi: 10.1016/s0025-5564(01)00072-4. [DOI] [PubMed] [Google Scholar]
- 28.Althaus CL, De Boer RJ. Dynamics of Immune Escape during HIV/SIV Infection. PLoS Comput Biol. 2008;4:e1000103. doi: 10.1371/journal.pcbi.1000103. [DOI] [PMC free article] [PubMed] [Google Scholar]
- 29.Elemans M, et al. Why Don’t CD8+ T Cells Reduce the Lifespan of SIV-Infected Cells In Vivo? PLoS Comput Biol. 2011;7:e1002200. doi: 10.1371/journal.pcbi.1002200. [DOI] [PMC free article] [PubMed] [Google Scholar]
- 30.Gadhamsetty S, Coorens T, Boer RJ. de. Notwithstanding circumstantial alibis, cytotoxic T cells can be major killers of HIV-1 infected cells. J. Virol. 2016 doi: 10.1128/JVI.00306-16. JVI.00306-16. [DOI] [PMC free article] [PubMed] [Google Scholar]
- 32.Chen HY, Mascio MD, Perelson AS, Ho DD, Zhang L. Determination of virus burst size in vivo using a single-cycle SIV in rhesus macaques. Proc. Natl. Acad. Sci. 2007;104:19079–19084. doi: 10.1073/pnas.0707449104. [DOI] [PMC free article] [PubMed] [Google Scholar]
- 33.De Boer RJ, Ribeiro RM, Perelson AS. Current Estimates for HIV-1 Production Imply Rapid Viral Clearance in Lymphoid Tissues. PLoS Comput Biol. 2010;6:e1000906. doi: 10.1371/journal.pcbi.1000906. [DOI] [PMC free article] [PubMed] [Google Scholar]
- 34.Ramratnam B, et al. Rapid production and clearance of HIV-1 and hepatitis C virus assessed by large volume plasma apheresis. The Lancet. 1999;354:1782–1785. doi: 10.1016/S0140-6736(99)02035-8. [DOI] [PubMed] [Google Scholar]
- 35.Chivers C. MHadaptive: General Markov Chain Monte Carlo for Bayesian Inference using adaptive Metropolis-Hastings sampling. 2012 [Google Scholar]
- 36.Soetaert K, Petzoldt T, Setzer RW. deSolve: Solvers for Initial Value Problems of Differential Equations (ODE, DAE, DDE) 2016 [Google Scholar]