

Abstract
Background
Obesity is a global health concern but the United States has reported a leveling in obesity rates in the pediatric population.
Objective
To provide updated waist circumference (WC) percentile values, identify differences across time and discuss differences within the context of reported weight stabilization in a nationally representative sample of American children.
Methods
Percentiles for WC in self-identified African Americans (AA), European Americans (EA) and Mexican Americans (MA) were obtained from 2009–2014 National Health and Nutrition Examination Survey data (NHANES2014). Descriptive trends across time in 10th, 25th, 50th, 75th and 90th percentile WC distributions were identified by comparing NHANES2012 with previously reported NHANESIII (1988–94).
Results
WC increased in a monotonic fashion in AA, EA and MA boys and girls. When compared with NHANESIII data, a clear left shift of percentile categories was observed such that values that used to be in the 90th percentile are now in the 85th percentile. Differences in WC were observed in EA and MA boys during a reported period of weight stabilization.
Conclusion and Relevance
WC has changed in the US pediatric population across time, even during times of reported weight stabilization, particularly among children of diverse racial/ethnic backgrounds.
Keywords: pediatric obesity, waist circumference, racial/ethnic differences, percentiles, national data
INTRODUCTION
Pediatric obesity is a public health concern affecting 17% of children in the United States (1). Given the scientific evidence demonstrating that pediatric obesity is a precursor to other complex diseases both in children and adults, and given the health care costs implications attached to these conditions (2), the prevention of pediatric obesity is paramount.
Although BMI is perhaps the most used surrogate for excessive adiposity in humans, recent research has demonstrated that BMI is a limited indicator of pediatric metabolic risk because of its limited specificity in children (3). Waist circumference (WC) has emerged as an index of pediatric adiposity that predicts fat mass as well as or better than BMI (4, 5). WC has proven to be effective for estimating total adiposity, and has been validated against various other body composition methods, including skin fold (6, 7), bioelectrical impedance (8), air displacement plethysmography (9), and dual x-ray absorptiometry (5, 10)). Furthermore, the role of WC as an indicator of risk has been evaluated in several pathological conditions and physiological markers such as hypertension and cardiometabolic risk (11, 12), nonalcoholic fatty liver disease (13), 25-hydroxyvitamin D (14), adipokines (15), serum uric acid (16), intimae media thickness (17), C-reactive protein, homocysteine and cysteine (18). Evidently WC is of great utility and relevance in clinical and research settings.
In 2004, we used United States (US) nationally representative data from NHANESIII (1988–1994) to show that children at age 13 were already exceeding the recommended cut-off for healthy WC in adults (19). In 2014, scientists reported that levels of body mass index (BMI= kg/m2) in the US have not significantly changed in the pediatric population between 2003–2004 and 2011–2012 (1), bringing hope to the public health arena. In this study, we have used NHANES data from 2009–2014 (NHANES2014) to create updated versions of previously published WC percentile tables according to race/ethnicity and sex, we have compared NHANES2014 gender- and racial/ethnic-specific WC percentiles to previously published percentiles from NHANESIII, and we have evaluated WC prevalence trends between the 2003–2004 and 2011–2012 period in which leveling-off of obesity prevalence in the pediatric population was reported.
METHODS
Sample
Data from the National Health and Nutrition Examination Survey (NHANES) were used. NHANES is a cross-sectional nationally representative study by the National Center for Health Statistics that uses a complex, stratified, multistage probability sample to represent the civilian non-institutionalized US population. Race-ethnicity was based on self-report. For the updated WC percentile tables, we used NHANES data from 2009–2014 (NHANES2014) with a total of 7130 youths (2 to 18 years) were included in the analysis: 2374 were African Americans (AA), 2548 were European Americans (EA), and 2208 were Mexican Americans (MA). For the time trend comparison between 2003–2004 and 2011–2012, a total of 5529 were included, with 2184 AA, 1670 EA and 1675 MA.
Measurement
Waist circumference (WC) was measured by trained technicians using a tape measure at just above the uppermost lateral border of the right iliac crest at the end of a normal expiration, and was recorded at the nearest millimeter, as described by the National Center of Health Statistics. NHANES maintains high standards to ensure minimal non-sampling and measurement errors during survey planning, data collection and processing, and information about questionnaires, procedures and lab manuals used for NHANES can be obtained from the National Center for Health Statistics (20).
Statistical Analysis
All analyses were conducted according to NHANES Analytic and Reporting Guidelines (21). Sample weights were used to account for differential probabilities of selection and the complex sample design, as well as non-response and non-coverage, as presented in the Supplemental Materials. Standard errors and 95% confidence interval (CI) were calculated using Taylor series linearization. The percentile regression approach used in this study followed methods detailed in our previous papers (19, 22). In summary, WC observations were classified by an indicator variable (I) as falling above or below a predicted percentile τ of the distribution, and a logistic regression approach was used to model the significant contributions of explanatory variables (ethnicity, age, age by ethnicity interaction) to the log odds of being above the τ percentile. If significance was found, percentile regression lines were constructed using the method developed by Koenker and Bassett (23). Regression lines of the 10th, 25th, 50th, 75th, 85th, 90th and 95th percentiles of the distribution of WC across ages were modeled according to sex and racial/ethnic groups. To test for statistically significant racial/ethnic differences at each percentile, we modeled the percentile regression lines as a function of age for each sex, and compared the slope of those percentile regression lines between EA, AA and MA, using EA as the reference group. SAS for Windows version 9.3 (SAS Institute) was used for statistical analysis. Statistical significance was determined at p < 0.05.
To compare the results from the present study (NHANES2014) with our previously reported results from 2004 (NHANESIII), we calculated the NHANES2014 – NHANESIII difference between estimated percentiles for 10th, 25th, 50th, 75th and 90th percentiles for boys and girls at every age. Positive results indicated an increase in the percentile estimate both data cohorts and negative results indicated a decrease in the estimates. Logistic regression models were used to evaluate the statistical significance when comparing prevalence of WC at a percentile ≥ 85th and ≥ 95th across time (during the period between 2003–2004 and 2011–2012). Comparisons across time were performed by age groups (2–5, 6–11, and 12–18 years old), as reported by Ogden, et al. (1).
RESULTS
Table 1 demonstrates estimated WC percentile regression values for boys and girls after combining all racial/ethnic groups and according to race/ethnicity for ages 2–18. All racial/ethnic slope comparisons at the 10th, 25th, 50th, 75th, 85th, 90th and 95th WC percentile estimates as a function of age using the EA group as the reference group showed statistically significant at p<0.05. Comparisons for MA boys at the 10th percentile and MA girls at the 90th percentile were inestimable. Visual inspection of the different percentiles according to race/ethnicity and sex, show a fair amount of variability of percentile cut-off values that impairs the identification of one specific group having an overall predominant increase in WC compared to others.
Table 1.
Estimated value for percentile regression for all boys and girl children and adolescents combined, and according to race/ethnic classification.
| Percentile for boys | Percentile for girls | |||||||||||||
|---|---|---|---|---|---|---|---|---|---|---|---|---|---|---|
| 10th | 25th | 50th | 75th | 85th | 90th | 10th | 25th | 50th | 75th | 85th | 90th | |||
| COMBINED SAMPLE | Intercept | 40.5 | 41.6 | 43.1 | 43.5 | 43.2 | 43.5 | 40.1 | 41.4 | 42.8 | 44.2 | 44.1 | 44.4 | |
| Slope | 1.8 | 2.0 | 2.3 | 3.0 | 3.6 | 4.0 | 1.8 | 2.0 | 2.3 | 3.0 | 3.6 | 4.0 | ||
| Age | 2 | 44.1 | 45.6 | 47.7 | 49.5 | 50.4 | 51.5 | 43.6 | 45.4 | 47.5 | 50.2 | 51.4 | 52.4 | |
| 3 | 45.9 | 47.6 | 50.0 | 52.5 | 54.0 | 55.5 | 45.4 | 47.4 | 49.8 | 53.2 | 55.0 | 56.4 | ||
| 4 | 47.7 | 49.6 | 52.2 | 55.5 | 57.6 | 59.5 | 47.1 | 49.4 | 52.2 | 56.2 | 58.6 | 60.4 | ||
| 5 | 49.5 | 51.6 | 54.5 | 58.4 | 61.2 | 63.4 | 48.9 | 51.4 | 54.5 | 59.1 | 62.3 | 64.4 | ||
| 6 | 51.3 | 53.6 | 56.8 | 61.4 | 64.8 | 67.4 | 50.6 | 53.3 | 56.8 | 62.1 | 65.9 | 68.4 | ||
| 7 | 53.1 | 55.6 | 59.1 | 64.4 | 68.4 | 71.4 | 52.4 | 55.3 | 59.1 | 65.1 | 69.6 | 72.4 | ||
| 8 | 54.9 | 57.6 | 61.3 | 67.4 | 72.0 | 75.4 | 54.2 | 57.3 | 61.5 | 68.1 | 73.2 | 76.4 | ||
| 9 | 56.7 | 59.6 | 63.6 | 70.3 | 75.6 | 79.3 | 55.9 | 59.3 | 63.8 | 71.1 | 76.8 | 80.4 | ||
| 10 | 58.5 | 61.6 | 65.9 | 73.3 | 79.3 | 83.3 | 57.7 | 61.3 | 66.1 | 74.0 | 80.5 | 84.5 | ||
| 11 | 60.2 | 63.6 | 68.2 | 76.3 | 82.9 | 87.3 | 59.4 | 63.3 | 68.4 | 77.0 | 84.1 | 88.5 | ||
| 12 | 62.0 | 65.6 | 70.4 | 79.3 | 86.5 | 91.3 | 61.2 | 65.3 | 70.8 | 80.0 | 87.8 | 92.5 | ||
| 13 | 63.8 | 67.6 | 72.7 | 82.3 | 90.1 | 95.2 | 63.0 | 67.2 | 73.1 | 83.0 | 91.4 | 96.5 | ||
| 14 | 65.6 | 69.6 | 75.0 | 85.2 | 93.7 | 99.2 | 64.7 | 69.2 | 75.4 | 86.0 | 95.0 | 100.5 | ||
| 15 | 67.4 | 71.6 | 77.3 | 88.2 | 97.3 | 103.2 | 66.5 | 71.2 | 77.7 | 88.9 | 98.7 | 104.5 | ||
| 16 | 69.2 | 73.6 | 79.5 | 91.2 | 100.9 | 107.2 | 68.2 | 73.2 | 80.1 | 91.9 | 102.3 | 108.5 | ||
| 17 | 71.0 | 75.6 | 81.8 | 94.2 | 104.5 | 111.2 | 70.0 | 75.2 | 82.4 | 94.9 | 106.0 | 112.5 | ||
| 18 | 72.8 | 77.6 | 84.1 | 97.1 | 108.1 | 115.1 | 71.8 | 77.2 | 84.7 | 97.9 | 109.6 | 116.5 | ||
| European Americans | Intercept | 40.8 | 41.9 | 43.3 | 43.2 | 43.0 | 43.5 | 40.1 | 41.6 | 43.3 | 44.1 | 43.6 | 43.4 | |
| Slope | 1.8 | 2.0 | 2.3 | 3.0 | 3.5 | 3.8 | 1.8 | 2.0 | 2.2 | 2.9 | 3.7 | 4.0 | ||
| Age | 2 | 44.4 | 45.9 | 47.8 | 49.1 | 50.0 | 51.2 | 43.6 | 45.5 | 47.8 | 49.9 | 50.9 | 51.4 | |
| 3 | 46.2 | 47.9 | 50.0 | 52.1 | 53.5 | 55.0 | 45.4 | 47.5 | 50.0 | 52.8 | 54.6 | 55.4 | ||
| 4 | 48.0 | 49.9 | 52.3 | 55.0 | 57.1 | 58.9 | 47.2 | 49.5 | 52.2 | 55.7 | 58.2 | 59.4 | ||
| 5 | 49.8 | 51.9 | 54.5 | 58.0 | 60.6 | 62.7 | 49.0 | 51.5 | 54.4 | 58.6 | 61.9 | 63.4 | ||
| 6 | 51.6 | 53.9 | 56.8 | 61.0 | 64.1 | 66.6 | 50.8 | 53.5 | 56.6 | 61.5 | 65.5 | 67.4 | ||
| 7 | 53.4 | 55.9 | 59.0 | 63.9 | 67.6 | 70.4 | 52.6 | 55.4 | 58.8 | 64.4 | 69.2 | 71.4 | ||
| 8 | 55.2 | 57.9 | 61.3 | 66.9 | 71.2 | 74.3 | 54.4 | 57.4 | 61.1 | 67.3 | 72.8 | 75.4 | ||
| 9 | 57.0 | 59.9 | 63.5 | 69.8 | 74.7 | 78.1 | 56.2 | 59.4 | 63.3 | 70.3 | 76.5 | 79.4 | ||
| 10 | 58.8 | 61.9 | 65.8 | 72.8 | 78.2 | 81.9 | 58.0 | 61.4 | 65.5 | 73.2 | 80.1 | 83.4 | ||
| 11 | 60.6 | 63.9 | 68.0 | 75.8 | 81.7 | 85.8 | 59.8 | 63.4 | 67.7 | 76.1 | 83.8 | 87.4 | ||
| 12 | 62.3 | 65.9 | 70.3 | 78.7 | 85.3 | 89.6 | 61.6 | 65.4 | 69.9 | 79.0 | 87.4 | 91.4 | ||
| 13 | 64.1 | 67.9 | 72.5 | 81.7 | 88.8 | 93.5 | 63.3 | 67.3 | 72.1 | 81.9 | 91.1 | 95.4 | ||
| 14 | 65.9 | 69.9 | 74.8 | 84.6 | 92.3 | 97.3 | 65.1 | 69.3 | 74.4 | 84.8 | 94.7 | 99.4 | ||
| 15 | 67.7 | 71.9 | 77.0 | 87.6 | 95.8 | 101.2 | 66.9 | 71.3 | 76.6 | 87.7 | 98.4 | 103.4 | ||
| 16 | 69.5 | 73.9 | 79.3 | 90.6 | 99.4 | 105.0 | 68.7 | 73.3 | 78.8 | 90.6 | 102.0 | 107.4 | ||
| 17 | 71.3 | 75.9 | 81.5 | 93.5 | 102.9 | 108.8 | 70.5 | 75.3 | 81.0 | 93.5 | 105.7 | 111.4 | ||
| 18 | 73.1 | 77.9 | 83.8 | 96.5 | 106.4 | 112.7 | 72.3 | 77.2 | 83.2 | 96.4 | 109.3 | 115.4 | ||
| African Americans | 10th | 25th | 50th | 75th | 85th | 90th | 10th | 25th | 50th | 75th | 85th | 90th | ||
| Intercept | 39.6 | 40.4 | 42.1 | 43.3 | 43.2 | 43.3 | 39.6 | 40.6 | 41.4 | 42.2 | 43.6 | 43.4 | ||
| Slope | 1.7 | 1.9 | 2.2 | 2.9 | 3.6 | 4.1 | 1.7 | 1.9 | 2.5 | 3.3 | 3.7 | 4.3 | ||
| Age | 2 | 43.0 | 44.3 | 46.5 | 49.1 | 50.3 | 51.5 | 43.1 | 44.4 | 46.3 | 48.7 | 51.1 | 51.9 | |
| 3 | 44.8 | 46.3 | 48.7 | 52.0 | 53.9 | 55.6 | 44.8 | 46.4 | 48.8 | 52.0 | 54.8 | 56.2 | ||
| 4 | 46.5 | 48.2 | 50.9 | 54.9 | 57.4 | 59.8 | 46.5 | 48.3 | 51.3 | 55.3 | 58.5 | 60.5 | ||
| 5 | 48.3 | 50.1 | 53.1 | 57.8 | 61.0 | 63.9 | 48.3 | 50.3 | 53.7 | 58.5 | 62.2 | 64.7 | ||
| 6 | 50.0 | 52.1 | 55.3 | 60.7 | 64.5 | 68.0 | 50.0 | 52.2 | 56.2 | 61.8 | 66.0 | 69.0 | ||
| 7 | 51.7 | 54.0 | 57.5 | 63.6 | 68.1 | 72.1 | 51.7 | 54.1 | 58.6 | 65.1 | 69.7 | 73.3 | ||
| 8 | 53.5 | 56.0 | 59.7 | 66.5 | 71.7 | 76.3 | 53.4 | 56.1 | 61.1 | 68.3 | 73.4 | 77.6 | ||
| 9 | 55.2 | 57.9 | 61.9 | 69.4 | 75.2 | 80.4 | 55.2 | 58.0 | 63.5 | 71.6 | 77.1 | 81.8 | ||
| 10 | 57.0 | 59.9 | 64.1 | 72.3 | 78.8 | 84.5 | 56.9 | 59.9 | 66.0 | 74.8 | 80.9 | 86.1 | ||
| 11 | 58.7 | 61.8 | 66.3 | 75.2 | 82.3 | 88.6 | 58.6 | 61.9 | 68.4 | 78.1 | 84.6 | 90.4 | ||
| 12 | 60.5 | 63.7 | 68.5 | 78.1 | 85.9 | 92.8 | 60.3 | 63.8 | 70.9 | 81.4 | 88.3 | 94.7 | ||
| 13 | 62.2 | 65.7 | 70.7 | 81.0 | 89.4 | 96.9 | 62.1 | 65.8 | 73.4 | 84.6 | 92.0 | 98.9 | ||
| 14 | 63.9 | 67.6 | 72.9 | 83.9 | 93.0 | 101.0 | 63.8 | 67.7 | 75.8 | 87.9 | 95.8 | 103.2 | ||
| 15 | 65.7 | 69.6 | 75.1 | 86.8 | 96.6 | 105.1 | 65.5 | 69.6 | 78.3 | 91.2 | 99.5 | 107.5 | ||
| 16 | 67.4 | 71.5 | 77.3 | 89.7 | 100.1 | 109.3 | 67.2 | 71.6 | 80.7 | 94.4 | 103.2 | 111.8 | ||
| 17 | 69.2 | 73.5 | 79.5 | 92.6 | 103.7 | 113.4 | 69.0 | 73.5 | 83.2 | 97.7 | 106.9 | 116.0 | ||
| 18 | 70.9 | 75.4 | 81.7 | 95.5 | 107.2 | 117.5 | 70.7 | 75.4 | 85.6 | 101.0 | 110.7 | 120.3 | ||
| Mexican Americans | 10th | 25th | 50th | 75th | 85th | 90th | 10th | 25th | 50th | 75th | 85th | 90th | ||
| Intercept | 40.8 | 42.0 | 43.2 | 44.0 | 45.0 | 46.0 | 41.0 | 41.9 | 43.6 | 46.1 | 47.0 | 48.7 | ||
| Slope | 1.8 | 2.1 | 2.5 | 3.3 | 3.8 | 4.3 | 1.7 | 2.0 | 2.4 | 3.1 | 3.6 | 3.7 | ||
| Age | 2 | 44.4 | 46.1 | 48.2 | 50.5 | 52.7 | 54.7 | 44.5 | 45.9 | 48.5 | 52.2 | 54.1 | 56.1 | |
| 3 | 46.2 | 48.2 | 50.7 | 53.8 | 56.6 | 59.0 | 46.2 | 47.9 | 50.9 | 55.3 | 57.7 | 59.9 | ||
| 4 | 48.0 | 50.2 | 53.2 | 57.1 | 60.4 | 63.3 | 47.9 | 49.9 | 53.4 | 58.4 | 61.2 | 63.6 | ||
| 5 | 49.8 | 52.3 | 55.7 | 60.3 | 64.2 | 67.7 | 49.7 | 51.9 | 55.8 | 61.5 | 64.8 | 67.3 | ||
| 6 | 51.7 | 54.3 | 58.2 | 63.6 | 68.1 | 72.0 | 51.4 | 53.9 | 58.3 | 64.6 | 68.3 | 71.0 | ||
| 7 | 53.5 | 56.4 | 60.7 | 66.9 | 71.9 | 76.3 | 53.1 | 55.9 | 60.7 | 67.7 | 71.9 | 74.7 | ||
| 8 | 55.3 | 58.5 | 63.2 | 70.1 | 75.8 | 80.7 | 54.8 | 58.0 | 63.2 | 70.8 | 75.4 | 78.4 | ||
| 9 | 57.1 | 60.5 | 65.8 | 73.4 | 79.6 | 85.0 | 56.6 | 60.0 | 65.6 | 73.8 | 79.0 | 82.2 | ||
| 10 | 58.9 | 62.6 | 68.3 | 76.7 | 83.4 | 89.3 | 58.3 | 62.0 | 68.0 | 76.9 | 82.5 | 85.9 | ||
| 11 | 60.7 | 64.6 | 70.8 | 79.9 | 87.3 | 93.6 | 60.0 | 64.0 | 70.5 | 80.0 | 86.1 | 89.6 | ||
| 12 | 62.5 | 66.7 | 73.3 | 83.2 | 91.1 | 98.0 | 61.7 | 66.0 | 72.9 | 83.1 | 89.6 | 93.3 | ||
| 13 | 64.3 | 68.7 | 75.8 | 86.5 | 95.0 | 102.3 | 63.5 | 68.0 | 75.4 | 86.2 | 93.2 | 97.0 | ||
| 14 | 66.2 | 70.8 | 78.3 | 89.7 | 98.8 | 106.6 | 65.2 | 70.0 | 77.8 | 89.3 | 96.7 | 100.8 | ||
| 15 | 68.0 | 72.8 | 80.8 | 93.0 | 102.6 | 110.9 | 66.9 | 72.0 | 80.3 | 92.4 | 100.3 | 104.5 | ||
| 16 | 69.8 | 74.9 | 83.3 | 96.3 | 106.5 | 115.3 | 68.6 | 74.0 | 82.7 | 95.5 | 103.8 | 108.2 | ||
| 17 | 71.6 | 76.9 | 85.8 | 99.5 | 110.3 | 119.6 | 70.4 | 76.0 | 85.1 | 98.5 | 107.4 | 111.9 | ||
| 18 | 73.4 | 79.0 | 88.3 | 102.8 | 114.2 | 123.9 | 72.1 | 78.0 | 87.6 | 101.6 | 110.9 | 115.6 | ||
Results from the comparison between NHANES2014 and NHANESIII are represented in Figure 1 and support an overall increase of WC in the combined sample and by age and sex. In the combined sample, the increase in WC is more pronounced in girls than in boys, with a steeper difference in the 75th and 90th percentiles. The highest difference value in the combined sample of boys was of 9.9 cm at age 18 of the 90th percentile. Interestingly, this value reflected a marked difference in trends among AA, EA and MA boys, whose difference values at age 18 of the 90th percentile were 16.2 cm, 7.9 cm and 15.1 cm, respectively. In girls, also at age 18 of the 90th percentile, the highest difference value in the combined sample was 15.5 cm, with values for AA of 11.4 cm, EA of 16.9 cm and MA of 11.2 cm. A table showing a comparison between the 90th percentile for NHANESIII and 75th, 85th and 90th percentile of NHANES2014 according to age is provided in the Supplemental Materials.
FIGURE 1.
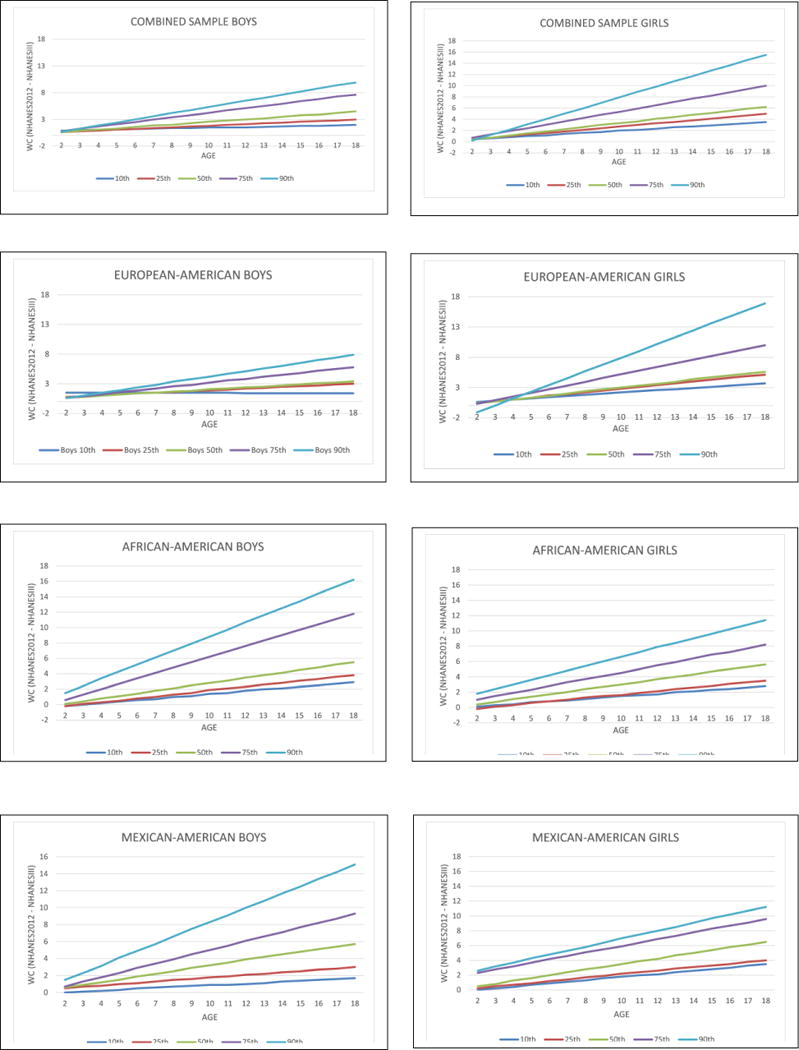
WC Differences between NHANES2014 and NHANESIII WC for Boys and Girls Combined and according to Racial/Ethnic Group
Table 2 shows the prevalence of WC above the 85th and 95th percentile for boys and girls in the combined sample, and according to racial/ethnic groups. A significant increase in WC prevalence across time was observed in Mexican Americans adolescents (ages 12–18) for the combined sample and in boys at the 85th percentile. However, a significant decrease in WC prevalence across time was observed in children (ages 2–5) at the 95th percentile in the combined sample and in boys, as well as in the combined sample of EA children. At the 85th percentile, MA boys (age 2–5) also showed a significant reduction of WC prevalence.
Table 2.
Prevalence (and confidence intervals) of waist circumference above the 85th and 95th percentile for 2003–2004 data and 2011–2012 data, according to age groups. Bold numbers represents a significant increase or decrease in prevalence between the two time periods (statistical significant a p ≤ 0.05.
| Sample | Age | ≥85th Percentile | ≥95th Percentile | |||
|---|---|---|---|---|---|---|
| 2003–2004 | 2011–2012 | 2003–2004 | 2011–2012 | |||
| Combined Sample | All | 2–18 | 15.6 (12.4–18.8) | 15.4 (13.1–17.6) | 5.6 (3.8–7.4) | 5.5 (3.9–7.1) |
| 2–5 | 15.3 (11.7–18.9) | 13.1 (10.1–16.2) | 5.5 (3.3–7.6) | 2.7 (1.7–3.7)** | ||
| 6–11 | 17.3 (12.9–21.7) | 16.4 (12.0–20.8) | 8.1 (5.5–10.7) | 7.9 (4.3–11.4) | ||
| 12–18 | 14.3 (10.7–17.9) | 15.7 (11.6–19.8) | 3.6 (1.8–5.3) | 5.1 (2.8–7.3) | ||
| Boys | 2–18 | 17.9 (14.1–21.7) | 14.7 (12.0–17.5) | 5.9 (4.0–7.8) | 4.4 (2.5–6.2) | |
| 2–5 | 19.0 (15.2–22.9) | 13.7 (7.7–19.7) | 6.4 (3.7–9.0) | 2.5 (0.3–4.7)* | ||
| 6–11 | 17.7 (11.3–24.0) | 14.2 (9.5–18.8) | 7.8 (3.9–11.7) | 6.1 (2.3–9.9) | ||
| 12–18 | 17.6 (12.9–22.2) | 15.8 (10.8–20.7) | 4.2 (2.0–6.4) | 3.9 (1.0–6.8) | ||
| Girls | 2–18 | 13.2 (10.1–16.3) | 16.0 (12.4–19.7) | 5.2 (2.6–7.8) | 6.7 (5.0–8.4) | |
| 2–5 | 11.7 (7.0–16.5) | 12.5 (4.8–20.2) | 4.6 (1.5–7.7) | 3.0 (0.3–5.6) | ||
| 6–11 | 16.9 (12.3–21.5) | 18.8 (13.7–24.0) | 8.4 (4.3–12.6) | 9.8 (5.8–13.7) | ||
| 12–18 | 10.9 (6.5–15.2) | 15.6 (10.1–21.0) | 2.9 (0.7–5.2) | 6.2 (3.6–8.8) | ||
| European Americans | All | 2–18 | 16.5 (12.4–20.6) | 15.2 (11.6–18.8) | 5.8 (3.4–8.1) | 5.5 (3.0–8.0) |
| 2–5 | 17.0 (12.6–21.3) | 14.1 (8.5–19.8) | 6.0 (2.9–9.2) | 2.1 (1.1–3.2)** | ||
| 6–11 | 17.9 (11.9–23.9) | 15.1 (7.8–22.4) | 8.5 (4.9–12.1) | 7.5 (1.5–13.5) | ||
| 12–18 | 15.3 (10.6–19.9) | 15.9 (9.6–22.1) | 3.6 (1.3–5.8) | 5.4 (2.2–8.6) | ||
| Boys | 2–18 | 19.8 (15.3–24.4) | 13.7 (10.0–17.4) | 6.2 (3.8–8.5) | 3.7 (1.2–6.3) | |
| 2–5 | 20.7 (16.3–25.0) | 15.2 (4.4–26.1) | 6.4 (2.8–10.1) | 2.0 (0.0–5.4) | ||
| 6–11 | 19.5 (11.2–27.9) | 11.0 (3.6–18.3) | 8.6 (3.4–13.8) | 4.7 (0.0–10.9) | ||
| 12–18 | 19.7 (13.8–25.7) | 15.4 (9.4–21.5) | 4.2 (1.4–7.1) | 3.7 (0.0–7.6) | ||
| Girls | 2–18 | 13.2 (9.0–17.3) | 16.7 (10.7–22.7) | 5.3 (1.7–8.9) | 7.2 (4.3–10.0) | |
| 2–5 | 13.4 (7.1–19.7) | 13.0 (0.2–25.7) | 5.7 (1.2–10.1) | 2.3 (0.0–5.8) | ||
| 6–11 | 16.3 (10.2–22.4) | 19.7 (10.5–28.8) | 8.4 (2.6–14.1) | 10.5 (3.8–17.2) | ||
| 12–18 | 10.7 (5.0–16.5) | 16.2 (8.0–24.5) | 2.9 (0.0–6.1) | 6.9 (2.9–11.0) | ||
| African Americans | All | 2–18 | 14.7 (12.3–17.2) | 16.1 (12.6–19.5) | 5.3 (4.2–6.5) | 5.9 (3.4–8.4) |
| 2–5 | 10.6 (6.9–14.4) | 12.6 (7.2–18.1) | 2.7 (0.6–4.8) | 3.8 (1.5–6.1) | ||
| 6–11 | 17.7 (13.4–21.9) | 18.3 (13.4–23.2) | 8.1 (5.4–10.7) | 8.6 (4.8–12.5) | ||
| 12–18 | 14.3 (11.3–17.2) | 16.2 (10.3–22.0) | 4.3 (2.7–5.9) | 4.8 (1.4–8.2) | ||
| Boys | 2–18 | 14.1 (11.0–17.2) | 16.2 (13.3–19.1) | 4.9 (3.3–6.6) | 5.2 (2.3–8.2) | |
| 2–5 | 11.7 (6.3–17.1) | 12.0 (3.9–20.1) | 2.0 (0.0–4.5) | 3.0 (0.0–7.0) | ||
| 6–11 | 13.8 (9.2–18.4) | 19.1 (13.2–25.0) | 6.3 (3.2–9.4) | 8.2 (2.6–13.8) | ||
| 12–18 | 15.5 (11.4–19.6) | 16.4 (11.4–21.4) | 5.2 (3.0–7.5) | 4.1 (0.0–8.4) | ||
| Girls | 2–18 | 15.4 (12.3–18.5) | 15.9 (10.3–21.5) | 5.7 (3.9–7.6) | 6.6 (3.4–9.8) | |
| 2–5 | 9.6 (6.4–12.8) | 13.4 (9.4–17.4) | 3.4 (1.0–5.9) | 4.7 (1.4–8.0) | ||
| 6–11 | 21.6 (15.7–27.6) | 17.6 (9.5–25.7) | 9.9 (5.4–14.3) | 9.1 (4.0–14.1) | ||
| 12–18 | 12.9 (9.3–16.6) | 15.9 (7.7–24.1) | 3.3 (1.2–5.4) | 5.5 (1.0–10.0) | ||
| Mexican Americans | All | 2–18 | 11.9 (8.8–14.9) | 15.2 (11.8–18.7) | 4.9 (3.0–6.9) | 5.4 (3.8–7.0) |
| 2–5 | 13.7 (7.2–20.2) | 10.4 (6.9–14.0) | 6.0 (2.4–9.6) | 3.3 (1.2–5.4) | ||
| 6–11 | 14.1 (8.8–19.4) | 19.2 (14.3–24.1) | 6.5 (3.3–9.7) | 8.5 (5.7–11.3) | ||
| 12–18 | 8.4 (6.9–9.9) | 14.5 (10.2–18.7)** | 2.6 (1.7–3.6) | 3.9 (1.5–6.4) | ||
| Boys | 2–18 | 13.2 (10.3–16.2) | 16.7 (12.1–21.3) | 5.7 (3.4–8.0) | 5.8 (3.3–8.3) | |
| 2–5 | 19.9 (10.6–29.3) | 10.6 (6.9–14.4)* | 10.3 (4.9–15.7) | 3.3 (0.0–7.4) | ||
| 6–11 | 13.9 (8.8–19.1) | 21.1 (13.4–28.8) | 5.9 (2.5–9.3) | 9.1 (4.9–13.2) | ||
| 12–18 | 8.0 (5.4–10.6) | 16.4 (9.0–23.8)** | 2.4 (0.6–4.1) | 4.4 (0.3–8.6) | ||
| Girls | 2–18 | 10.4 (6.7–14.1) | 13.7 (9.0–18.3) | 4.1 (1.6–6.5) | 5.0 (3.2–6.9) | |
| 2–5 | 7.1 (1.1–13.0) | 10.3 (2.7–17.9) | 1.5 (0.0–3.7) | 3.3 (0.0–6.7) | ||
| 6–11 | 14.3 (5.7–22.9) | 17.4 (10.2–24.5) | 7.1 (1.8–12.4) | 7.9 (3.1–12.6) | ||
| 12–18 | 8.9 (4.6–13.2) | 12.3 (5.2–19.4) | 2.9 (1.2–4.6) | 3.4 (0.0–6.9) | ||
p ≤ 0,.05
p ≤ 0.01
DISCUSSION
The results of this study demonstrate that WC has increased in the US pediatric population from NHANESIII to NHANES2014, and that this increase differs among boys and girls of diverse racial/ethnic groups. Despite reports indicating no increase in the prevalence of pediatric obesity in the US (1), our data shows an increase in WC prevalence across time in adolescents (ages 12–18), and a decrease in WC prevalence across time in younger children (ages 2–5).
When comparing data from NHANESIII and NHANES2014 our results demonstrate a clear left shift of percentile categories: for example, in NHANESIII data the 90th percentile for 8 year old boys (combined) was 71.2 cm, a value that is under the 85th percentile in NHANES2012 data. Figure 1 shows noticeable differences between the NHANES 2014 and NHANESIII percentiles. In all groups the greater change across ages occurred on the higher percentiles, whereas a small difference is observed in the lowest percentiles. The greatest increase in WC across time period considered occurred in 90th percentile of AA boys (increase of 16.2 cm) followed by EA girls (increase of 16.3 cm). No increase was observed in the 90th percentile at age 3 in AA girls, the 10th percentile at age 3 in AA boys, and the 10th percentile at age 2 in MA boys and girls. A reduction in WC was observed in the 10th and 25th percentile of AA boys and 25th percentile of AA girls at age 2, and in the 90th percentile of EA girls at age 3. The reason for such reduction is beyond the scope of this study, but it might well be a result of initiatives to reduce obesity in the early lifespan of minority populations.
The epidemiological finding of increased WC trajectory between NHANESIII and NHANES2014 is concerning. For example, the 88 cm cut-off for increased risk of obesity-related comorbidities in adult women was reported to be achieved at age 13 in MA and AA girls from NHANESIII (19), at same age in Messiah et al. evaluation of 2008 NHANES (24), and at age 11 in in the actual NHANES2014 data. The 102 cm cut-off for increased risk of obesity-related comorbidities in adult men was achieved at age 16 in MA, and 18 in EA and AA boys in NHANESIII, at age 14 in MA and 16 in EA and AA in Messiah et al. (24), and at age 16 in EA, 15 in AA, and 13 in MA in NHANES2014. Considering this increasing trajectory is pertinent in the development of preventive strategies, particularly when considering that an increase of one cm in waist circumference increases the relative risk of cardiovascular disease by 2% (25). WC has been shown to have increased in adults from 1999–2012 (26), and in areas of fast economic development a leveling-off of BMI in adults has also been accompanied by an increase in WC and abdominal obesity (27). Of note is that the comparisons between NHANESIII and NHANES2014 is provided herein to describe a trend and to support the shifting toward the left of the distribution on a 13-year period, and not to test for statistically significant differences that, in this case, might not have any research or clinical implications.
The consideration of changes in patterns of abdominal adiposity during a time of weight stabilization is of interest. A reduction of WC during early childhood provides hope for better cardiometabolic health among upcoming generations. An increase in WC among adolescents raises a potential concern as fat deposition might be shifting toward the accumulation of abdominal fat independent of weight stabilization, implying greater disease risk that might not be detected by body weight increase alone. Evidently, the interpretation of our results is limited by the extent to which WC represents a surrogate for visceral adiposity and does not provide insights into physiological mechanisms that can be further explored with more precise measurements of abdominal adiposity. It is relevant to consider that comparisons of time trends are dependent on the chosen points of examination; given the objectives of this study, we chose same points as the ones reported by Ogden and colleagues (1).
Our results emphasize the importance of evaluating WC, instead of BMI alone, in clinical practice and research protocols, particularly when examining metabolic disease risk in children. The distribution of adipose tissue in the human body has helped the understanding of how obesity associates with metabolic abnormalities and has also revealed complex and incompletely understood phenomena such as the metabolically healthy obese (MHO) phenotype (28, 29). Awareness and understanding of adiposity depots and their role in improving the health of the pediatric populations is important. Public education initiatives focusing on accessible measures for monitoring potential health status and facilitating disease prevention are needed, as well as further research exploring changes across time in precisely-measured abdominal fat depots and their impact in pediatric and adolescent health.
In conclusion, our data show that WC in children and adolescents in the United States has increased in the last 20 years, and that there are racial/ethnic differences as well as differences between boys and girls. Within the last decade, a trend toward reduced WC in young children is emerging regardless of weight stabilization Pediatricians are advised to take into account these findings when assessing health risks to the pediatric population.
Supplementary Material
What is already known about this subject?
Waist circumference percentiles have been previously published in 2004 for American children based on data from NHANES III
Obesity trends in the US pediatric population show a stabilization in body weight between 2003–2004 and 2011–2012.
What this study adds?
Updated waist circumference percentiles have been developed with updated data
A comparison of waist circumference percentiles with previously published data (NHANESIII) shows an increase of abdominal adiposity in children of European-, African-, and Mexican-American ancestry.
An evaluation of the trend of waist circumference between 2003–2004 and 2011–2012 show changes in waist circumference despite reported waist stabilization, particularly in European- and Mexican-American boys.
Acknowledgments
Dr. Fernández had full access to all of the data in the study and takes responsibility for the integrity of the data and the accuracy of the data analysis. Drs. Allison, Redden and Fernández worked on the study concept and design, and additional contributions for data acquisition, analysis and interpretations were received from Drs. Bohan Brown, López-Alarcón, Guo, and Dawson. All authors were involved in writing the paper and had final approval of the submitted version.
This study was supported in part by the National Institute of Health grants P30DK056336 and T32HL072757.
Footnotes
Besides partial support from these grant by some investigators and a pending patent for DBA, there are no potential conflicts of interest to be disclosed.
References
- 1.Ogden CL, Carroll MD, Kit BK, Flegal KM. Prevalence of childhood and adult obesity in the United States, 2011–2012. Jama. 2014;311(8):806–14. doi: 10.1001/jama.2014.732. [DOI] [PMC free article] [PubMed] [Google Scholar]
- 2.An R. Health care expenses in relation to obesity and smoking among U.S. adults by gender, race/ethnicity, and age group: 1998–2011. Public health. 2015;129(1):29–36. doi: 10.1016/j.puhe.2014.11.003. [DOI] [PubMed] [Google Scholar]
- 3.Markovic-Jovanovic SR, Stolic RV, Jovanovic AN. The reliability of body mass index in the diagnosis of obesity and metabolic risk in children. Journal of pediatric endocrinology & metabolism: JPEM. 2014 doi: 10.1515/jpem-2014-0389. [DOI] [PubMed] [Google Scholar]
- 4.Stevens J, Cai J, Truesdale KP, Cuttler L, Robinson TN, Roberts AL. Percent body fat prediction equations for 8- to 17-year-old American children. Pediatric obesity. 2014;9(4):260–71. doi: 10.1111/j.2047-6310.2013.00175.x. [DOI] [PMC free article] [PubMed] [Google Scholar]
- 5.Katzmarzyk PT, Bouchard C. Where is the beef? waist circumference is more highly correlated with bmi and total body fat than with abdominal visceral fat in children. International journal of obesity (2005) 2013 doi: 10.1038/ijo.2013.170. [DOI] [PMC free article] [PubMed] [Google Scholar]
- 6.Maffeis C, Grezzani A, Pietrobelli A, Provera S, Tato L. Does waist circumference predict fat gain in children? International journal of obesity and related metabolic disorders: journal of the International Association for the Study of Obesity. 2001;25(7):978–83. doi: 10.1038/sj.ijo.0801641. [DOI] [PubMed] [Google Scholar]
- 7.Glasser N, Zellner K, Kromeyer-Hauschild K. Validity of body mass index and waist circumference to detect excess fat mass in children aged 7–14 years. European journal of clinical nutrition. 2011;65(2):151–9. doi: 10.1038/ejcn.2010.245. [DOI] [PubMed] [Google Scholar]
- 8.Phan TL, Maresca MM, Hossain J, Datto GA. Does body mass index accurately reflect body fat? A comparison of anthropometric measures in the longitudinal assessment of fat mass. Clinical pediatrics. 2012;51(7):671–7. doi: 10.1177/0009922812440838. [DOI] [PubMed] [Google Scholar]
- 9.Neovius M, Linne Y, Rossner S. BMI, waist-circumference and waist-hip-ratio as diagnostic tests for fatness in adolescents. International journal of obesity (2005) 2005;29(2):163–9. doi: 10.1038/sj.ijo.0802867. [DOI] [PubMed] [Google Scholar]
- 10.Taylor RW, Jones IE, Williams SM, Goulding A. Evaluation of waist circumference, waist-to-hip ratio, and the conicity index as screening tools for high trunk fat mass, as measured by dual-energy X-ray absorptiometry, in children aged 3–19 y. The American journal of clinical nutrition. 2000;72(2):490–5. doi: 10.1093/ajcn/72.2.490. [DOI] [PubMed] [Google Scholar]
- 11.Hobkirk JP, King RF, Davies I, Harman N, Gately P, Pemberton P, et al. The metabolic inter-relationships between changes in waist circumference, triglycerides, insulin sensitivity and small, dense low-density lipoprotein particles with acute weight loss in clinically obese children and adolescents. Pediatric obesity. 2014;9(3):209–17. doi: 10.1111/j.2047-6310.2013.00165.x. [DOI] [PubMed] [Google Scholar]
- 12.Buchan DS, Boddy LM, Despres JP, Grace FM, Sculthorpe N, Mahoney C, et al. Utility of the hypertriglyceridemic waist phenotype in the cardiometabolic risk assessment of youth stratified by body mass index. Pediatric obesity. 2015 doi: 10.1111/ijpo.12061. [DOI] [PubMed] [Google Scholar]
- 13.Mager DR, Yap J, Rodriguez-Dimitrescu C, Mazurak V, Ball G, Gilmour S. Anthropometric measures of visceral and subcutaneous fat are important in the determination of metabolic dysregulation in boys and girls at risk for nonalcoholic fatty liver disease. Nutrition in clinical practice: official publication of the American Society for Parenteral and Enteral Nutrition. 2013;28(1):101–11. doi: 10.1177/0884533612454884. [DOI] [PubMed] [Google Scholar]
- 14.Lee HA, Kim YJ, Lee H, Gwak HS, Park EA, Cho SJ, et al. Association of vitamin D concentrations with adiposity indices among preadolescent children in Korea. Journal of pediatric endocrinology & metabolism: JPEM. 2013;26(9–10):849–54. doi: 10.1515/jpem-2012-0416. [DOI] [PubMed] [Google Scholar]
- 15.Boyraz M, Cekmez F, Karaoglu A, Cinaz P, Durak M, Bideci A. Relationship of adipokines (adiponectin, resistin and RBP4) with metabolic syndrome components in pubertal obese children. Biomarkers in medicine. 2013;7(3):423–8. doi: 10.2217/bmm.13.14. [DOI] [PubMed] [Google Scholar]
- 16.Viazzi F, Antolini L, Giussani M, Brambilla P, Galbiati S, Mastriani S, et al. Serum uric acid and blood pressure in children at cardiovascular risk. Pediatrics. 2013;132(1):e93–9. doi: 10.1542/peds.2013-0047. [DOI] [PubMed] [Google Scholar]
- 17.Melo X, Santa-Clara H, Santos DA, Pimenta NM, Pinto R, Minderico CS, et al. Single and combined effects of body composition phenotypes on carotid intima-media thickness. Pediatric obesity. 2015 doi: 10.1111/ijpo.12056. [DOI] [PubMed] [Google Scholar]
- 18.da Silva NP, de Souza FI, Pendezza AI, Fonseca FL, Hix S, Oliveira AC, et al. Homocysteine and cysteine levels in prepubertal children: association with waist circumference and lipid profile. Nutrition (Burbank, Los Angeles County, Calif) 2013;29(1):166–71. doi: 10.1016/j.nut.2012.05.015. [DOI] [PubMed] [Google Scholar]
- 19.Fernandez JR, Redden DT, Pietrobelli A, Allison DB. Waist circumference percentiles in nationally representative samples of African-American, European-American, and Mexican-American children and adolescents. The Journal of pediatrics. 2004;145(4):439–44. doi: 10.1016/j.jpeds.2004.06.044. [DOI] [PubMed] [Google Scholar]
- 20.National Center for Health Statistics. National Health and Nutrition Examination Survey. http://www.cdc.gov/nchs/nhanes.htm. Accessed on February 14, 2016.
- 21.National Center for Health Statistics. The National Health and Nutrition Examination Survey (NHANES) Analytic and Reporting Guidelines. http://www.cdc.gov/nchs/data/nhanes/nhanes_03_04/nhanes_analytic_guidelines_dec_2005.pdf. Accessed December 20, 2011.
- 22.Redden DT, Fernandez JR, Allison DB. A simple significance test for quantile regression. Statistics in medicine. 2004;23(16):2587–97. doi: 10.1002/sim.1839. [DOI] [PubMed] [Google Scholar]
- 23.Koenker R, Bassett GW. Regression Quantiles. Econometrica. 1978;46(1):33–50. [Google Scholar]
- 24.Messiah SE, Arheart KL, Lipshultz SE, Miller TL. Ethnic group differences in waist circumference percentiles among U.S. children and adolescents: estimates from the 1999–2008 National Health and Nutrition Examination Surveys. Metabolic syndrome and related disorders. 2011;9(4):297–303. doi: 10.1089/met.2010.0127. [DOI] [PubMed] [Google Scholar]
- 25.de Koning L, Merchant AT, Pogue J, Anand SS. Waist circumference and waist-to-hip ratio as predictors of cardiovascular events: meta-regression analysis of prospective studies. European heart journal. 2007;28(7):850–6. doi: 10.1093/eurheartj/ehm026. [DOI] [PubMed] [Google Scholar]
- 26.Ford ES, Maynard LM, Li C. Trends in mean waist circumference and abdominal obesity among US adults, 1999–2012. Jama. 2014;312(11):1151–3. doi: 10.1001/jama.2014.8362. [DOI] [PMC free article] [PubMed] [Google Scholar]
- 27.Lao XQ, Ma WJ, Sobko T, Zhang YH, Xu YJ, Xu XJ, et al. Overall obesity is leveling-off while abdominal obesity continues to rise in a Chinese population experiencing rapid economic development: analysis of serial cross-sectional health survey data 2002–2010. International journal of obesity. 2014 doi: 10.1038/ijo.2014.95. [DOI] [PubMed] [Google Scholar]
- 28.Heinzle S, Ball GD, Kuk JL. Variations in the prevalence and predictors of prevalent metabolically healthy obesity in adolescents. Pediatric obesity. 2015 doi: 10.1111/ijpo.12083. [DOI] [PMC free article] [PubMed] [Google Scholar]
- 29.Smith KJ, Bessell E, Magnussen CG, Dwyer T, Venn AJ. Does youth adiposity, or change in adiposity from youth to adulthood, predict metabolically healthy obesity in adulthood? Pediatric obesity. 2015 doi: 10.1111/ijpo.12065. [DOI] [PubMed] [Google Scholar]
Associated Data
This section collects any data citations, data availability statements, or supplementary materials included in this article.