

Abstract
BACKGROUND
The regional impact of care at a National Cancer Institute Comprehensive Cancer Center (NCI-CCC) on adherence to National Comprehensive Cancer Network (NCCN) ovarian cancer treatment guidelines and survival is unclear.
STUDY DESIGN
We performed a retrospective population-based study of consecutive patients diagnosed with epithelial ovarian cancer between January 1, 1996 and December 31, 2006 in southern California. Patients were stratified according to care at an NCI-CCC (n = 5), non-NCI high-volume hospital (≥10 cases/year, HVH, n = 29), or low-volume hospital (<10 cases/year, LVH, n = 158). Multivariable logistic regression and Cox-proportional hazards models were used to examine the effect of NCI-CCC status on treatment guideline adherence and ovarian cancer-specific survival.
RESULTS
A total of 9,933 patients were identified (stage I, 22.8%; stage II, 7.9%; stage III, 45.1%; stage IV, 24.2%), and 8.1% of patients were treated at NCI-CCCs. Overall, 35.7% of patients received NCCN guideline adherent care, and NCI-CCC status (odds ratio [OR] 1.00) was an independent predictor of adherence to treatment guidelines compared with HVHs (OR 0.83, 95% CI 0.70 to 0.99) and LVHs (OR 0.56, 95% CI 0.47 to 0.67). The median ovarian cancer-specific survivals according to hospital type were: NCI-CCC 77.9 (95% CI 61.4 to 92.9) months, HVH 51.9 (95% CI 49.2 to 55.7) months, and LVH 43.4 (95% CI 39.9 to 47.2) months (p < 0.0001). National Cancer Institute Comprehensive Cancer Center status (hazard ratio [HR] 1.00) was a statistically significant and independent predictor of improved survival compared with HVH (HR 1.18, 95% CI 1.04 to 1.33) and LVH (HR 1.30, 95% CI 1.15 to 1.47).
CONCLUSIONS
National Cancer Institute Comprehensive Cancer Center status is an independent predictor of adherence to ovarian cancer treatment guidelines and improved ovarian cancer-specific survival. These data validate NCI-CCC status as a structural health care characteristic correlated with superior ovarian cancer quality measure performance. Increased access to NCI-CCCs through regional concentration of care may be a mechanism to improve clinical outcomes.
In the United States (US), there are 22,000 new cases of ovarian cancer diagnosed and more than 14,000 disease-related deaths annually.1 Ovarian cancer is the fifth leading cause of cancer-related death among US women and accounts for more deaths than all other gynecologic cancers combined. Adherence to National Comprehensive Cancer Network (NCCN) treatment guidelines for ovarian cancer, a comprehensive measure of overall care, has recently been validated as correlating with improved disease-specific and overall survival, and has emerged as a relevant process measure of quality cancer care.2–4 For ovarian cancer, optimizing survival outcomes hinges on access to specialized providers that are most likely to administer effective and evidence-based treatment programs.5–10 To date, one of the most reliable health care system characteristics correlated with adherence to NCCN ovarian cancer treatment guidelines has been hospital annual case volume.6–9 As a structural measure of quality cancer care, however, annual case volume has been criticized as being imprecise and not reflective of more subtle aspects of ovarian cancer care.11–13
National Cancer Institute-designated cancer centers are characterized by scientific excellence and the capability to integrate a diversity of research approaches to focus on the problem of cancer. There are 41 NCI-designated Comprehensive Cancer Centers (NCI-CCC) in the US.14 Generally, the designation criteria are focused on research infrastructure and programs; however, the regional effect on clinical outcomes of cancer patients has not been well defined. The objective of this study was to examine this question with respect to ovarian cancer and determine the impact of care at NCI-CCC hospitals in southern California on adherence to NCCN treatment guidelines and disease-specific survival.
METHODS
The study design is a retrospective population-based study of invasive epithelial ovarian cancer reported to the California Cancer Registry (CCR); it received exempt status by the Institutional Review Board of the University of California, Irvine (HS#2011-8317). Standardized data collection and quality control procedures have been in place since 1988.15–18 Case reporting is estimated to be 99% for the entire state, with follow-up completion rates exceeding 95%.19 International Classification of Disease Codes for Oncology based on the World Health Organization’s criteria was used for tumor location and histology.19 Cases were identified using ovarian Surveillance, Epidemiology, and End Results (SEER) primary site code (C569).
This study represents a subset analysis of previously reported statewide data.3,7 Case selection criteria included all women age 18 years or older at the time of diagnosis of a first or only invasive epithelial ovarian cancer in Los Angeles, Orange, Riverside, San Bernardino and San Diego counties between January 1, 1996 and December 31, 2006. Follow-up extended through January 2008. For the purposes of this study, hospitals in southern California were characterized according to whether or not they maintained NCI-CCC status during the study time period and then were sorted by average annual ovarian cancer case volume comparable to NCI-CCC hospitals (≥10 cases/year or <10 cases/year). Using these criteria, hospital type was divided into 3 categories: NCI-CCC, non-NCI-CCC high-volume hospital (≥10 cases/year, HVH), and non-NCI-CCC low-volume hospital (<10 cases/year, LVH). Age at diagnosis was treated either as a continuous variable or a categorical variable (<45 years, 45 to 54 years, 55 to 69 years, and ≥70 years). Tumor characteristics included International Federation of Gynecology and Obstetrics (FIGO) and American Joint Commission on Cancer (AJCC) stage, tumor grade, and histology. Patient demographic characteristics included race/ethnicity and insurance type. Socioeconomic status (SES) was measured as quintiles of the Yost score: lowest (SES-1), lower-middle (SES-2), middle (SES-3), higher-middle (SES-4), and highest (SES-5). The Yost score is an index of SES level based on a principal components analysis of variables at the census block level and includes education, income, and employment.20 The California Cancer Registry does not capture data on medical comorbidities.
The main outcomes of this study were adherence to NCCN ovarian cancer treatment guidelines and ovarian cancer-specific survival. Adherence to treatment guidelines was based on NCCN recommendations for surgery and chemotherapy according to the time period of diagnosis (1997 to 2005).21–25 For stages I to IIIB, surgical treatment was considered adherent to NCCN guidelines if it included a minimum of oophorectomy (± hysterectomy), pelvic and/or para-aortic lymph node biopsy, and omentectomy. A minimum of oophorectomy (± hysterectomy) and omentectomy was considered adherent surgical care for stages IIIC to IV disease. For cases of stages IA to IB, grade 1 to 2 disease, no adjuvant treatment was considered guideline adherent. Administration of multiagent chemotherapy was considered appropriate for cases of stages IC to IV or grade 3 disease. Surgery must have preceded chemotherapy for stages I to IIIB to be considered adherent to NCCN guidelines; for stages IIIC to IV, either initial surgery or chemotherapy was characterized as appropriate care. Dichotomous variables (adherence/nonadherence) were created for adherence to surgical guidelines, adherence to chemotherapy guidelines, and adherence to overall treatment plan including surgery, chemotherapy, and treatment sequence. For analysis of adherence or nonadherence of the overall treatment plan, cases of discordance between hospitals (eg, NCI-CCC/HVH for surgery and LVH for chemotherapy) were assigned as NCI-CCC/HVH if either hospital type contributed a component to the treatment course. Cause of death was recorded according to International Classification of Disease criteria in effect at the time of death.26 The last date of follow-up was either the date of death or the last date of contact. Ovarian cancer-specific mortality was defined as death caused by ovarian cancer. Patients who died from other causes were treated as censored at the time of the event.
Descriptive statistics were analyzed with chi-square test for categorical variables. Multivariate logistic regression analysis was performed to estimate the probability of adherence to NCCN guidelines. Survival analysis was performed using the Kaplan-Meier estimate of survival probability and log rank tests. After verifying the proportionality assumption, a Cox proportional hazards model was fitted to evaluate the independent effect on survival of each predictor. Possible interaction terms of main effects were tested. Adjusted hazard ratios and 95% confidence intervals were generated. For multivariate logistic regression analysis and the Cox proportional hazards model, age was treated as a continuous variable. All statistical analysis was performed on SAS 9.2.
RESULTS
Patient population characteristics
A total of 10,630 incident cases were identified. Cases with incomplete clinical information, nonepithelial histologic subtypes, missing ICD-O-2 morphology code, or cases that were identified from autopsy or death certificate were excluded (n = 697). The remaining 9,933 patients comprised the final study population. The median age at diagnosis was 61 years (range 18 to 99 years). Patient and health care system characteristics are shown in Table 1. A total of 192 hospitals provided care for ovarian cancer. Five NCI-CCC hospitals treated 800 patients (8.1% of cases), with an average annual case volume of 14.5 cases/year. Twenty-nine HVHs treated 4,654 patients (46.9% of cases) and had an average annual case volume of 14.6 cases/year. The remaining 4,479 patients (45.1% of cases) were treated by the 158 LVHs, with an average annual case volume of 2.6 cases/year.
Table 1.
Population Characteristics of 9,933 Patients with Epithelial Ovarian Cancer, from 1996 to 2006 in Southern California, Overall and According to Hospital Type
| Characteristics | Total | NCI comprehensive cancer center | Non-NCI high-volume hospital | Non-NCI low-volume hospital | p Value* | ||||
|---|---|---|---|---|---|---|---|---|---|
| n | % | n | % | n | % | n | % | ||
| n | 9,933 | 100.0 | 800 | 8.1 | 4,654 | 46.9 | 4,479 | 45.1 | |
| Hospitals | 192 | 5 | 29 | 158 | |||||
| Age, y | <0.0001 | ||||||||
| <45 | 1,384 | 13.9 | 157 | 19.6 | 614 | 13.2 | 613 | 13.7 | |
| 45–54 | 2,060 | 20.7 | 201 | 25.1 | 1,013 | 21.8 | 846 | 18.9 | |
| 55–69 | 3,284 | 33.1 | 296 | 37.0 | 1,623 | 34.9 | 1,365 | 30.5 | |
| ≥70 | 3,205 | 32.3 | 146 | 18.3 | 1,404 | 30.2 | 1,655 | 37.0 | |
| Tumor histology | <0.0001 | ||||||||
| Serous | 4,006 | 40.3 | 361 | 45.1 | 1,920 | 41.3 | 1,725 | 38.5 | |
| Mucinous | 716 | 7.2 | 63 | 7.9 | 316 | 6.8 | 337 | 7.5 | |
| Endometrioid | 1,135 | 11.4 | 102 | 12.8 | 522 | 11.2 | 511 | 11.4 | |
| Clear cell | 525 | 5.3 | 58 | 7.3 | 281 | 6.0 | 186 | 4.2 | |
| Adenocarcinoma, not otherwise specified | 1,242 | 12.5 | 61 | 7.6 | 503 | 10.8 | 678 | 15.1 | |
| Other | 2,309 | 23.2 | 155 | 19.4 | 1,112 | 23.9 | 1,042 | 23.3 | |
| Tumor size, cm | <0.0001 | ||||||||
| ≤5 | 1,250 | 12.6 | 103 | 12.9 | 586 | 12.6 | 561 | 12.5 | |
| 5–10 | 1,952 | 19.7 | 185 | 23.1 | 956 | 20.5 | 811 | 18.1 | |
| >10 | 2,390 | 24.1 | 283 | 35.4 | 1,117 | 24.0 | 990 | 22.1 | |
| Unknown | 4341 | 43.7 | 229 | 28.6 | 1,995 | 42.9 | 2,117 | 47.3 | |
| Tumor stage | 0.064 | ||||||||
| I | 2,269 | 22.8 | 191 | 23.9 | 1,060 | 22.8 | 1,018 | 22.7 | |
| II | 783 | 7.9 | 72 | 9.0 | 342 | 7.3 | 369 | 8.2 | |
| III | 4,479 | 45.1 | 341 | 42.6 | 2,169 | 46.6 | 1,969 | 44.0 | |
| IV | 2,402 | 24.2 | 196 | 24.5 | 1,083 | 23.3 | 1,123 | 25.1 | |
| Tumor grade | <0.0001 | ||||||||
| 1 | 808 | 8.1 | 83 | 10.4 | 381 | 8.2 | 344 | 7.7 | |
| 2 | 1,793 | 18.1 | 146 | 18.3 | 841 | 18.1 | 806 | 18.0 | |
| 3 | 3,602 | 36.3 | 332 | 41.5 | 1,699 | 36.5 | 1,571 | 35.1 | |
| 4 (undifferentiated/anaplastic) | 894 | 9.0 | 34 | 4.3 | 490 | 10.5 | 370 | 8.3 | |
| Not stated | 2,836 | 28.6 | 205 | 25.6 | 1,243 | 26.7 | 1,388 | 31.0 | |
| Race | <0.0001 | ||||||||
| White | 6,526 | 65.7 | 419 | 52.4 | 3,295 | 70.8 | 2,812 | 62.8 | |
| African American | 501 | 5.0 | 32 | 4.0 | 211 | 4.5 | 258 | 5.8 | |
| Hispanic | 1,905 | 19.2 | 233 | 29.1 | 740 | 15.9 | 932 | 20.8 | |
| Asian/Pacific islander | 1,001 | 10.1 | 116 | 14.5 | 408 | 8.8 | 477 | 10.6 | |
| Insurance type | <0.0001 | ||||||||
| Managed care | 4,747 | 47.8 | 204 | 25.5 | 2,484 | 53.4 | 2,059 | 46.0 | |
| Medicare | 2,730 | 27.5 | 160 | 20.0 | 1,212 | 26.0 | 1,358 | 30.3 | |
| Medicaid | 806 | 8.1 | 175 | 21.9 | 245 | 5.3 | 386 | 8.6 | |
| Other insurance | 977 | 9.8 | 101 | 12.6 | 440 | 9.5 | 436 | 9.7 | |
| Not insured | 361 | 3.6 | 68 | 8.5 | 168 | 3.6 | 125 | 2.8 | |
| Unknown | 312 | 3.1 | 92 | 11.5 | 105 | 2.3 | 115 | 2.6 | |
| Socioeconomic status | <0.0001 | ||||||||
| SES-1 (lowest) | 1,496 | 15.1 | 188 | 23.5 | 481 | 10.3 | 827 | 18.5 | |
| SES-2 (lower-middle) | 1919 | 19.3 | 160 | 20.0 | 820 | 17.6 | 939 | 21.0 | |
| SES-3 (middle) | 2,093 | 21.1 | 139 | 17.4 | 974 | 20.9 | 980 | 21.9 | |
| SES-4 (higher-middle) | 2,268 | 22.8 | 142 | 17.8 | 1,201 | 25.8 | 925 | 20.7 | |
| SES-5 (highest) | 2,157 | 21.7 | 171 | 21.4 | 1,178 | 25.3 | 808 | 18.0 | |
| Surgery NCCN adherence | <0.0001 | ||||||||
| Not adherent | 4,850 | 48.8 | 323 | 40.4 | 2,124 | 45.6 | 2,403 | 53.7 | |
| Adherent | 5,083 | 51.2 | 477 | 59.6 | 2,530 | 54.4 | 2,076 | 46.3 | |
| Chemotherapy NCCN adherence | <0.0001 | ||||||||
| Not adherent | 3,772 | 38.0 | 221 | 27.6 | 1,558 | 33.5 | 1,993 | 44.5 | |
| Adherent | 6,161 | 62.0 | 579 | 72.4 | 3,096 | 66.5 | 2,486 | 55.5 | |
| Overall treatment plan NCCN adherence | <0.0001 | ||||||||
| Not adherent | 6,391 | 64.3 | 436 | 54.5 | 2,787 | 59.9 | 3,168 | 70.7 | |
| Adherent | 3,542 | 35.7 | 364 | 45.5 | 1,867 | 40.1 | 1,311 | 29.3 | |
Chi-square test, all p values are 2-sided.
NCCN, National Comprehensive Cancer Network; NCI, National Cancer Institute; SES, socioeconomic status.
Stratification of the population demographic characteristics according to hospital type revealed that patients treated at NCI-CCC hospitals tended to be younger, have tumors of serous histology, and have a tumor size >10 cm (Table 1). White patients represented 52.4% of cases treated at NCI-CCC, compared with 70.8% and 62.8% of cases treated at HVHs and LVHs, respectively. Conversely, Hispanic and Asian/Pacific Islander women accounted for a larger proportion of patients treated at NCI-CCCs. Patients with managed care insurance were more commonly treated at HVHs (53.4% of cases) and LVHs (46.0% of cases) than NCI-CCCs (25.5% of cases). The opposite pattern was observed for patients with Medicaid or no insurance, who were more likely to receive care at NCI-CCCs. Access to each hospital type varied significantly according to SES. For HVHs, there was a positive linear association between increasing SES and the proportion of patients treated, increasing from 10.3% of cases for SES-1 to 25.3% of cases for SES-5 (Fig. 1). In LVHs, the most common group was in SES-3, and the least frequently treated groups were those in the socioeconomic extremes (SES-1 and SES-5). In contrast, the distribution of NCI-CCC patients according to SES demonstrated a bimodal pattern, with the most common SES groups being the 2 extreme socioeconomic categories (SES-1 and SES-5) and the least frequent group being SES-3.
Figure 1.
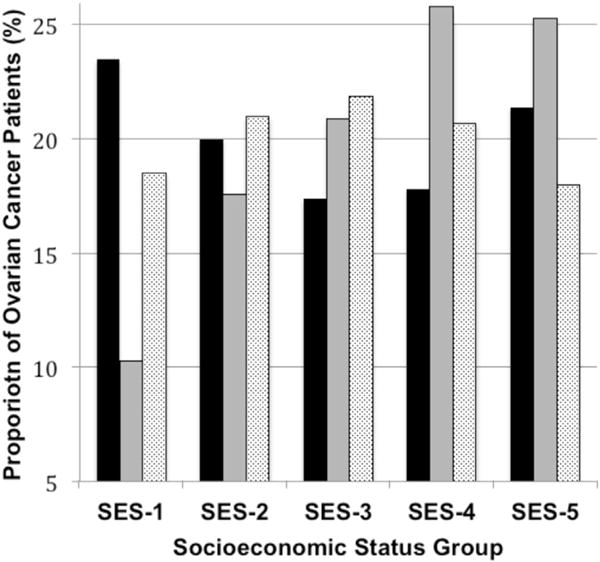
Proportional distribution of ovarian cancer patients in southern California (n = 9,933), 1996 to 2006, according to socioeconomic status (SES) and stratified by hospital type. Chi-square test, 2-sided p value < 0.0001. Black bar, National Cancer Institute Comprehensive Cancer Center; gray bar, high-volume hospital; light gray bar, low-volume hospital.
Adherence to treatment guidelines
Surgery conformed to recommended guidelines in 51.2% of all cases, while appropriate chemotherapy was administered to 62.0% of patients. Considering the overall treatment program, 35.7% of patients were treated according to NCCN guidelines (Table 1). Multivariate logistic regression analysis of variables predictive of overall treatment adherence to NCCN guidelines revealed a statistically significantly and independent positive association for NCI-CCC (odds ratio [OR] 1.00) compared with HVH (OR 0.83, 95% CI 0.70 to 0.99) and LVH (OR 0.56, 95% CI 0.47 to 0.67) (Table 2). Increasing age and atypical histology were associated with a lower likelihood of guideline adherence. Among demographic characteristics, race and insurance type were not statistically significant predictors of guideline adherence after controlling for other factors. Increasing SES, however, was an independent and statistically significant predictor of receiving NCCN guideline-adherent treatment, which increased by 23% for patients in SES-4 and by 46% for patients in SES-5.
Table 2.
Logistic Regression Model (Binomial Logistic Regression) of Demographic, Pathologic, and Health Care System Variables Associated with National Comprehensive Cancer Network Ovarian Cancer Treatment Guideline Adherence
| Characteristic | Overall treatment adherence | Surgery adherence | Chemotherapy adherence | ||||||
|---|---|---|---|---|---|---|---|---|---|
| OR | 95% CI | OR | 95% CI | OR | 95% CI | ||||
| Age | 0.98* | 0.97* | 0.98* | 0.98* | 0.98* | 0.99* | 0.97* | 0.97* | 0.98* |
| Year of diagnosis | 0.98 | 0.97 | 1.00 | 1.05 | 1.03 | 1.06 | 0.93 | 0.92 | 0.95 |
| Tumor histology | |||||||||
| Serous | 1.00 | 1.00 | 1.00 | ||||||
| Mucinous | 0.75* | 0.61* | 0.92* | 0.76* | 0.63* | 0.92* | 0.73* | 0.60* | 0.88* |
| Endometrioid | 0.76* | 0.65* | 0.89* | 0.72* | 0.61* | 0.84* | 0.92 | 0.78 | 1.07 |
| Clear cell | 1.05 | 0.84 | 1.30 | 1.01 | 0.82 | 1.25 | 1.29* | 1.04* | 1.60v |
| Adenocarcinoma, not otherwise specified | 0.40* | 0.34* | 0.47* | 0.28* | 0.24* | 0.33* | 0.98 | 0.85 | 1.14 |
| Other | 0.57* | 0.50* | 0.64* | 0.55* | 0.49* | 0.62* | 0.6* | 0.57* | 0.73* |
| Tumor size, cm | |||||||||
| ≤5 | 1.00 | 1.00 | 1.00 | ||||||
| 5–10 | 1.05 | 0.90 | 1.23 | 1.23* | 1.05* | 1.45* | 0.98 | 0.84 | 1.15 |
| >10 | 0.94 | 0.80 | 1.10 | 1.22* | 1.04* | 1.42* | 0.85 | 0.73 | 1.00 |
| Unknown | 0.94 | 0.81 | 1.08 | 0.94 | 0.81 | 1.08 | 0.95 | 0.82 | 1.10 |
| Tumor stage | |||||||||
| I | 1.00 | 1.00 | 1.00 | ||||||
| II | 0.92 | 0.75 | 1.14 | 1.04 | 0.87 | 1.25 | 0.93 | 0.78 | 1.12 |
| III | 3.73* | 3.24* | 4.30* | 4.54* | 3.97* | 5.19* | 1.70* | 1.49* | 1.94* |
| IV | 2.93* | 2.50* | 3.45* | 2.79* | 2.40* | 3.25* | 1.67* | 1.45* | 1.94v |
| Tumor grade | |||||||||
| Grade 1 | 1.00 | 1.00 | 1.00 | ||||||
| Grade 2 | 1.31* | 1.08* | 1.60* | 1.24* | 1.03* | 1.50* | 1.10 | 0.90 | 1.33 |
| Grade 3 | 1.30* | 1.07* | 1.58* | 1.40* | 1.17* | 1.68* | 0.69* | 0.57* | 0.83* |
| Grade 4 (undifferentiated/anaplastic) | 1.44* | 1.14* | 1.81* | 1.40* | 1.12* | 1.75* | 0.83 | 0.66 | 1.05 |
| Grade not stated | 0.46* | 0.37* | 0.56* | 0.44* | 0.36* | 0.54* | 0.35* | 0.29* | 0.42* |
| Race | |||||||||
| White | 1.00 | 1.00 | 1.00 | ||||||
| African American | 0.80 | 0.64 | 1.01 | 0.86 | 0.70 | 1.06 | 0.81* | 0.66* | 0.99* |
| Hispanic | 1.01 | 0.88 | 1.15 | 0.94 | 0.82 | 1.07 | 1.11 | 0.98 | 1.26 |
| Asian/Pacific islander | 0.93 | 0.80 | 1.09 | 1.02 | 0.88 | 1.19 | 0.93 | 0.80 | 1.08 |
| Insurance type | |||||||||
| Managed care | 1.00 | 1.00 | 1.00 | ||||||
| Medicare | 1.01 | 0.89 | 1.15 | 0.94 | 0.83 | 1.06 | 1.11 | 0.99 | 1.24 |
| Medicaid | 1.06 | 0.89 | 1.27 | 0.87 | 0.73 | 1.04 | 1.26* | 1.06* | 1.51* |
| Other ins | 1.12 | 0.96 | 1.31 | 1.08 | 0.92 | 1.26 | 1.08 | 0.92 | 1.26 |
| Not insured | 0.87 | 0.68 | 1.12 | 0.72* | 0.57* | 0.92* | 0.98 | 0.77 | 1.24 |
| Unknown | 0.96 | 0.74 | 1.26 | 1.02 | 0.79 | 1.33 | 0.90 | 0.69 | 1.16 |
| Socioeconomic status | |||||||||
| SES-1 (lowest) | 1.00 | 1.00 | 1.00 | ||||||
| SES-2 (lower-middle) | 1.07 | 0.91 | 1.26 | 0.97 | 0.83 | 1.13 | 1.17* | 1.01* | 1.36* |
| SES-3 (middle) | 1.13 | 0.96 | 1.34 | 0.95 | 0.81 | 1.12 | 1.22 | 1.04 | 1.42 |
| SES-4 (higher-middle) | 1.23* | 1.04* | 1.45* | 1.09 | 0.93 | 1.27 | 1.19* | 1.02* | 1.39* |
| SES-5 (highest) | 1.46* | 1.23* | 1.72* | 1.17 | 0.99 | 1.38 | 1.49* | 1.27* | 1.75* |
| Hospital type | |||||||||
| NCI Comprehensive Cancer Center | 1.00 | 1.00 | 1.00 | ||||||
| Non-NCI high-volume hospital | 0.83* | 0.70* | 0.99* | 0.83* | 0.69* | 0.99* | 0.82* | 0.69* | 0.99* |
| Non-NCI low-volume hospital | 0.56* | 0.47* | 0.67* | 0.68* | 0.57* | 0.81* | 0.54* | 0.45* | 0.65* |
Significant variables. Statistical significance was set to p < 0.05; all p values are 2-sided.
NCI, National Cancer Institute; OR, odds ratio; SES, socioeconomic status.
Survival analysis
The median ovarian cancer-specific survival for all patients was 49.9 months. On univariate analysis, NCI-CCC treatment was associated with a statistically significant survival advantage (Fig. 2). The median survival time for patients treated at an NCI-CCC was 77.9 months, compared with 51.9 months for patients treated at an HVH and 43.4 months for those treated at an LVH (p < 0.0001). After controlling for the expected negative prognostic factors of increasing age, International Federation of Gynecology and Obstetrics/American Joint Committee on Cancer (FIGO/AJCC) stage, tumor size, and tumor grade, treatment at an NCI-CCC (HR 1.00) was associated with a statistically significant and independent improvement in ovarian cancer-specific survival compared with HVH (HR 1.18, 95% CI 1.04 to 1.33) and LVH (HR 1.30, 95% CI 1.15 to 1.47) (Table 3). Among demographic characteristics, neither race nor insurance status was significantly associated with survival after controlling for other factors. On the other hand, higher SES was a statistically significant predictor of improved survival. Specifically, the risk of ovarian cancer-related death was decreased by 18% (95% CI 0.74 to 0.92) for patients in SES-4 and by 25% (95% CI 0.68 to 0.84) for patients in SES-5 compared with patients in the lowest SES category (SES-1).
Figure 2.
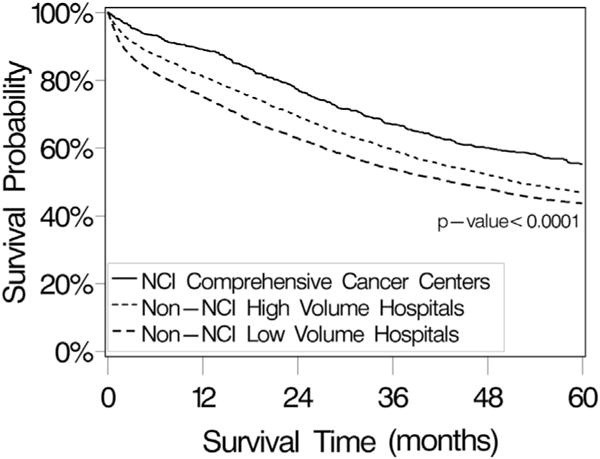
Ovarian cancer-specific survival probability for patients with invasive primary epithelial ovarian cancer in southern California, from the California Cancer Registry, 1996 to 2006, stratified by hospital type. Survival analyses were performed using the Kaplan-Meier method and 2-sided log rank test. The median survival time for all patients (n = 9,933) was 49.9 months (95% CI 47.8 to 52.1 months). Median survival times were 77.9 months (95% CI 61.4 to 92.9 months) for National Cancer Institute (NCI) Comprehensive Cancer Center patients (n = 800), 51.9 months (95% CI 49.2 to 55.7 months) for non-NCI high-volume hospital patients (n = 4,654), and 43.4 months (95% CI 39.9 to 47.2 months) for non-NCI low-volume hospital patients (n = 4,479).
Table 3.
Multivariate Ovarian Cancer-Specific Survival Analysis
| Characteristic | HR* | 95% CI | |
|---|---|---|---|
| Age | 1.03 | 1.03 | 1.03 |
| Tumor histology | |||
| Serous | 1.00 | – | – |
| Mucinous | 1.37† | 1.17† | 1.60† |
| Endometrioid | 0.88 | 0.78 | 1.00 |
| Clear cell | 1.25† | 1.05† | 1.48† |
| Adenocarcinoma, not otherwise specified | 1.50† | 1.38† | 1.63† |
| Other | 1.32† | 1.23† | 1.43† |
| Tumor size, cm | |||
| ≤5 | 1.00 | – | – |
| 5–10 | 0.98 | 0.88 | 1.09 |
| >10 | 0.86† | 0.77† | 0.96† |
| Unknown | 1.11† | 1.01† | 1.23† |
| Tumor stage | |||
| I | 1.00 | – | – |
| II | 2.79† | 2.33† | 3.35† |
| III | 6.24† | 5.42† | 7.19† |
| IV | 9.67† | 8.35† | 11.19† |
| Tumor grade | |||
| 1 | 1.00 | – | – |
| 2 | 1.78† | 1.46† | 2.18† |
| 3 | 2.00† | 1.64† | 2.43† |
| 4, undifferentiated/anaplastic | 2.04† | 1.65† | 2.52† |
| Not stated | 2.59† | 2.13† | 3.16† |
| Race/ethnicity | |||
| White | 1.00 | – | – |
| African American | 1.11 | 0.97 | 1.26 |
| Hispanic | 0.95 | 0.87 | 1.04 |
| Asian/Pacific islander | 0.93 | 0.83 | 1.04 |
| Insurance type | |||
| Managed care | 1.00 | – | – |
| Medicare | 0.95 | 0.89 | 1.03 |
| Medicaid | 1.07 | 0.95 | 1.21 |
| Other ins | 0.92 | 0.82 | 1.04 |
| Not insured | 1.13 | 0.94 | 1.35 |
| Unknown | 0.89 | 0.74 | 1.06 |
| Socioeconomic status | |||
| SES-1 (lowest) | 1.00 | – | – |
| SES-2 (lower-middle) | 0.99 | 0.90 | 1.10 |
| SES-3 (middle SES) | 0.93 | 0.84 | 1.04 |
| SES-4 (higher-middle) | 0.82† | 0.74† | 0.92† |
| SES-5 (highest) | 0.75† | 0.68† | 0.84† |
| Hospital type | |||
| NCI Comprehensive Cancer Center | 1.00 | – | – |
| Non-NCI high-volume hospital | 1.18† | 1.04† | 1.33† |
| Non-NCI low-volume hospital | 1.30† | 1.15† | 1.47† |
Hazard ratios were computed using Cox proportional hazards model.
Significant variables. Statistical significance was set to p < 0.05, and all p values are 2-sided.
HR, hazard ratio; NCI, National Cancer Institute; SES, socioeconomic status.
Given the independent associations between both hospital type and SES with ovarian cancer-specific survival, an exploratory univariate survival analysis was performed to examine the survival impact of NCI-CCC status stratified by consolidated SES groupings. For patients in the lower to middle SES groups (SES-1 to SES-3), the median disease-specific survival for all patients was 46.1 months. Among this group, the median survival for patients treated at NCI-CCCs (67.0 months) was statistically significantly longer compared with that for patients treated at HVHs (50.8 months) and those treated at LVHs (38.5 months) (p < 0.0001) (Fig. 3A). For patients in the upper socioeconomic strata (SES-4 and SES-5), the median disease-specific survival for all patients was 53.1 months. Similar to the lower SES strata, the median survival time was statistically significantly longer for patients treated at NCI-CCCs (80.0 months) compared with HVHs (52.7 months) and LVHs (49.9 months) (p < 0.0001) (Fig. 3B).
Figure 3.
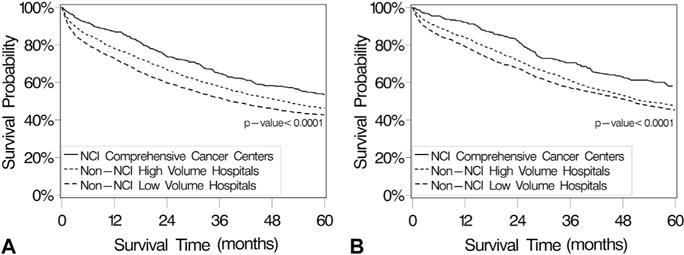
(A) Ovarian cancer-specific survival probability for patients in the low to middle socioeconomic strata (SES-1 to SES-3) with invasive primary epithelial ovarian cancer in southern California, from the California Cancer Registry, 1996 to 2006, stratified by hospital type. Survival analyses were performed using the Kaplan-Meier method and 2-sided log rank test. The median survival time for all patients (n = 5,508) was 46.1 months (95% CI 42.7 to 50 months). Median survival times were 67.0 months (95% CI 54.9 to 90.3 months) for National Cancer Institute (NCI) Comprehensive Cancer Center patients (n = 487), 50.8 months (95% CI 45.4 to 55.5 months) for non-NCI high-volume hospital patients (n = 2,275), and 38.5 months (95% CI 35.1 to 42.9 months) for non-NCI low-volume hospital patients (n = 2,746). (B) Ovarian cancer-specific survival probability for patients in the higher-middle to highest socioeconomic strata (SES-4 and SES-5) with invasive primary epithelial ovarian cancer in southern California from the California Cancer Registry, 1996 to 2006, stratified by hospital type. Survival analyses were performed using the Kaplan-Meier method and 2-sided log rank test. Median survival time for all patients (n = 4,425) was 53.1 months (95% CI 50.1 to 57.7 months). Median survival times were 80.0 months (95% CI 60.5 to 100.6 months) for NCI Comprehensive Cancer Center patients (n = 313), 52.7 months (95% CI 49.3 to 60.0 months) for non-NCI high-volume hospital patients (n = 2,379), and 49.9 months (95% CI 45.1 to 54.9 months) for non-NCI low-volume hospital patients (n = 1,733).
DISCUSSION
In 1973, the NCI established the Cancer Center Support Grant program and described criteria for a hospital to attain NCI-CCC status. Requirements are restrictive, and these centers must demonstrate expertise in each of 3 areas of research: laboratory, clinical, and behavioral/population-based.14 The NCI-CCCs are expected to initiate and conduct early phase, innovative clinical trials and to participate in the NCI’s cooperative groups by providing leadership and recruiting patients for trials. The NCI-CCCs must also conduct activities in outreach and education, and provide information on advances in health care for both health care professionals and the public. Receiving the NCI designation places a cancer center among the top 4% of the approximately 1,500 cancer centers in the US. However, the potential benefit of many of these programmatic elements to the local or regional cancer patient population has been difficult to measure. Currently, there are no data that specifically examine the potential benefit of ovarian cancer care at an NCI-CCC with regard to important health care quality measures. The objective of this study, therefore, was to investigate the impact of ovarian cancer care at an NCI-CCC on adherence to NCCN treatment guidelines and survival in the demographically diverse region of southern California.
Our data indicate that ovarian cancer care administered at a NCI-CCC is associated with statistically and clinically significant improvements in the rate of adherence to NCCN treatment guidelines and disease-specific survival when measured against both hospitals with a comparative annual case volume (HVHs) and those with lower ovarian cancer volume (LVHs). Although NCI-CCCs were significantly more likely to administer appropriate care than both HVHs and LVHs, even at NCI-CCCs, the rate of adherence to recommended treatment was disappointingly low (45.5%). This observation may reflect challenges with collection and interpretation of information from administrative databases or differences in unmeasured variables affecting patients’ capacity to tolerate therapy (eg, medical comorbidities). For example, Erickson and coworkers4 recently reported their single-institution experience with 367 ovarian cancer patients at the University of Alabama at Birmingham, an NCI-CCC. They described a rate of 78.5% adherence to NCCN treatment guidelines.4 The most common reason for deviation from recommended treatment was a failure to administer appropriate chemotherapy as a result of comorbidities or progression of disease. In our dataset, we were unable to determine whether there was selection bias toward increased rates of higher medical comorbidity in the non-NCI-CCC centers that reflected negatively on survival outcomes. Conversely, it is also possible that there are unmeasured benefits to care at an NCI-CCC, over and above a higher rate of adherence to NCCN treatment guidelines, such as access to clinical trials and coordinated multidisciplinary care, which had a positive effect on survival outcomes.
This study is informative with regard to some of the challenges in access to high-quality health care facing the US health care delivery system.27–31 The finding that in the heavily resourced health care metropolis that is southern California, there were 158 hospitals that performed, on average, 2.6 ovarian cancer operations per year, is disturbing. Undoubtedly, there are multiple factors that contribute to such a decentralization of services including inaccuracies in diagnosis, patient ability or willingness to travel, and physician preference. It is also possible, and perhaps even likely, that contractual obligations between health plans, payers, hospitals, and physicians have the unfortunate side effect of discouraging referral of women with suspected ovarian cancer to high-volume centers. Regrettably, such health care system pressures can sometimes run countercurrent to the well-documented volume-outcomes relationship for ovarian cancer. Previous data from California indicated disparities in access to high-volume surgeons and hospitals for Hispanics, Asian/Pacific Islanders, women from low-SES, and those with safety-net insurance.7 Interestingly, within this study, we observed reverse disparities with regard to these populations and access to NCI-CCCs. Specifically, women from racial minority groups, low-SES, and with safety-net insurance were over-represented in NCI-CCCs. However, from a population-based perspective, only a small percentage of these at-risk groups actually had access to NCI-CCCs. For example, although 29.0% of patients treated at NCI-CCCs were Hispanic, this accounted for just 12.2% of Hispanic ovarian cancer patients in the southern California region. Insurance status has also been shown to affect access to care. In an earlier study from California, Aranda and colleagues32 found that both Medicare and Medicaid insurance were associated with statistically significantly reduced access to a high-volume surgeon. The type of health insurance can be considered both a health system factor and an individual-level measure of SES, and it has been linked to expenditure on cancer treatment, leading some authors to suggest that payer status may influence access to appropriate care.33 In contrast, this study was unable to demonstrate a statistically significant association between insurance type and either adherence to treatment guidelines or survival. Although patients with Medicaid and no insurance accounted for 30.4% of patients treated at NCI-CCCs in this study, only 20.8% of patients in these payer categories were treated at NCI-CCCs within the southern California region. So although minorities, lower-SES women, and those with safety-net insurance may be disproportionately over-represented at NCI-CCCs, access remained limited.
After controlling for other variables, neither race nor insurance status was statistically significantly associated with either adherence to treatment guidelines or survival, yet SES emerged as a consistent predictor of both of these important clinical outcomes. These data, as well as those from other recent publications, suggest that SES is likely the dominant factor driving ovarian cancer disparities.7 Additional research is needed to define the mechanisms behind these apparent inequalities. The current data showing an association between NCI-CCC status and improved adherence to treatment guidelines and survival may have important health policy and administration implications regarding concentration of ovarian cancer services as a mechanism to improve outcomes for all women with ovarian cancer as well as effectively reduce racial and SES-based disparities in survival.34 Notably, our data indicate that even among the most challenging lower socioeconomic populations (SES-1 through SES-3), the survival advantage associated with NCI-CCC care was maintained proportionate to the general population.
Strengths of this study include the large study population size, the proven reliability of the California Cancer Registry, and examination of a contemporary time period during which no major treatment paradigm shifts occurred. There are also several limitations that must be considered when interpreting these data. First, this was a retrospective study design using a population-based dataset and is subject to the inherent potential for reporting and selection bias that accompanies such methodology. For example, individual chemotherapeutic agents are not identified in the California Cancer Registry database; consequently, administration of multi-agent chemotherapy was delineated as adherent to treatment guidelines. Second, and perhaps most importantly, we were unable to control for potentially important unreported variables that could influence both adherence to treatment guidelines and survival outcomes, such as the presence of medical comorbidities. A third potential limitation is that the survival analysis intentionally did not adjust for adherence to NCCN treatment guidelines. Controlling for treatment-related variables intrinsically associated with NCI-CCCs or HVHs, such as variation in surgical practices and chemotherapy use, could potentially mask or mitigate a positive hospital type-outcome effect.35 Fourth, we were unable to examine the potential effect of physician specialty because the California Cancer Registry does not capture this information routinely. Finally, because this was a retrospective observational study, we were unable to account for the effects of patient ability or willingness to travel in selection of treatment delivery settings.
CONCLUSIONS
Despite these limitations, several conclusions can be drawn from these data. First, NCI-CCC status is an independent predictor of adherence to ovarian cancer treatment guidelines and improved ovarian cancer-specific survival. Second, these data validate NCI-CCC status as a structural health care characteristic correlated with superior ovarian cancer quality measure performance. Finally, although the geographic region in this case was confined to southern California, these data suggest that improving access to NCI-CCC through regional concentration of care may be a mechanism to improve clinical outcomes for women with ovarian cancer. Additional research is needed to more precisely define the most pressing barriers to ensuring availability of high quality care for all women with ovarian cancer.
Acknowledgments
Support: Dr Bristow was supported in part by the Queen of Hearts Foundation. The sponsor had no role in the design of the study, collection, analysis, and interpretation of the data, writing of the manuscript, or the decision to submit the manuscript for publication.
Abbreviations and Acronyms
- HR
hazard ratio
- HVH
high-volume hospital
- LVH
low-volume hospital
- NCI-CCC
National Cancer Institute Comprehensive Cancer Center
- NCCN
National Comprehensive Cancer Network
- OR
odds ratio
- SES
socioeconomic status
Footnotes
Disclosure Information: Nothing to disclose.
Author Contributions
Study conception and design: Bristow, Chang, Ziogas, Campos, Chavez, Anton-Culver
Acquisition of data: Chang, Ziogas
Analysis and interpretation of data: Bristow, Chang, Ziogas, Campos, Chavez, Anton-Culver
Drafting of manuscript: Bristow, Chang, Ziogas
Critical revision: Bristow, Chang, Ziogas, Campos, Chavez, Anton-Culver
References
- 1.Siegel R, Naishadham D, Jemal A. Cancer statistics 2013. CA Cancer J Clin. 2013;63:11–30. doi: 10.3322/caac.21166. [DOI] [PubMed] [Google Scholar]
- 2.Bristow RE, Powell MA, Al-Hammadi N, et al. Disparities in ovarian cancer care quality and survival according to race and socioeconomic status. J Natl Cancer Inst. 2013;105:823–832. doi: 10.1093/jnci/djt065. [DOI] [PMC free article] [PubMed] [Google Scholar]
- 3.Bristow RE, Chang J, Ziogas A, et al. Adherence to treatment guidelines for ovarian cancer as a measure of quality care. Obstet Gynecol. 2013;121:1226–1234. doi: 10.1097/AOG.0b013e3182922a17. [DOI] [PubMed] [Google Scholar]
- 4.Erickson BK, Martin JY, Shah MM, et al. Reasons for failure to deliver National Comprehensive Cancer Network (NCCN)-adherent care in the treatment of epithelial ovarian cancer at an NCCN cancer center. Gynecol Oncol. 2014;133:142–146. doi: 10.1016/j.ygyno.2014.02.006. [DOI] [PMC free article] [PubMed] [Google Scholar]
- 5.Read C, Elit L. Trends in gynecologic cancer care in North America. Obstet Gynecol Clin North Am. 2012;39:107–129. doi: 10.1016/j.ogc.2012.02.003. [DOI] [PubMed] [Google Scholar]
- 6.Bristow RE, Palis BE, Chi DS, et al. The National Cancer Database on advanced-stage epithelial ovarian cancer: impact of hospital surgical case volume on overall survival and surgical treatment paradigm. Gynecol Oncol. 2010;118:262–267. doi: 10.1016/j.ygyno.2010.05.025. [DOI] [PubMed] [Google Scholar]
- 7.Bristow RE, Chang J, Ziogas A, et al. High-volume ovarian cancer care: survival impact and disparities in access for advanced-stage disease. Gynecol Oncol. 2014;132:403–410. doi: 10.1016/j.ygyno.2013.12.017. [DOI] [PubMed] [Google Scholar]
- 8.Goff BA, Matthews BJ, Wynn M, et al. Ovarian cancer: patterns of surgical care across the United States. Gynecol Oncol. 2006;103:383–390. doi: 10.1016/j.ygyno.2006.08.010. [DOI] [PubMed] [Google Scholar]
- 9.Goff BA, Matthews BJ, Larson EH, et al. Predictors of comprehensive surgical treatment in patients with ovarian cancer. Cancer. 2007;109:2031–2042. doi: 10.1002/cncr.22604. [DOI] [PubMed] [Google Scholar]
- 10.Bristow RE, Zahurak ML, Diaz-Montes TP, et al. Impact of surgeon and hospital ovarian cancer surgical case volume on in-hospital mortality and related short-term outcomes. Gynecol Oncol. 2009;115:334–338. doi: 10.1016/j.ygyno.2009.08.025. [DOI] [PubMed] [Google Scholar]
- 11.Donabedian A. Evaluating the quality of medical care. Milbank Memorial Fund Q. 1966;44:166–206. [PubMed] [Google Scholar]
- 12.Birkmeyer JD, Dimick JB, Birkmeyer NJO. Measuring the quality of surgical care: structure, process, or outcome? J Am Coll Surg. 2004;198:626–632. doi: 10.1016/j.jamcollsurg.2003.11.017. [DOI] [PubMed] [Google Scholar]
- 13.Phippen NT, Barnett JC, Lowery WJ, et al. Surgical outcomes and national comprehensive cancer network compliance in advanced ovarian cancer surgery in a low volume military treatment facility. Gynecol Oncol. 2013;131:158–162. doi: 10.1016/j.ygyno.2013.07.001. [DOI] [PubMed] [Google Scholar]
- 14.National Cancer Institute. Office of Cancer Centers. Available at: http://www.cancercenters.gov/cancer_centers/index.html. Accessed August 29, 2014.
- 15.California Cancer Reporting system Standards. I. Sacramento, CA: California Department of Health Services, Cancer Surveillance Section; 1997. Cancer Reporting in California: Standards for Automated Reporting. [Google Scholar]
- 16.California Cancer Reporting system Standards. II. California Department of Health Services, Cancer Surveillance Section; 1997. Cancer Reporting in California: Standards for Automated Reporting. [Google Scholar]
- 17.California Cancer Reporting system Standards. III. California Department of Health Services, Cancer Surveillance Section; 1997. Cancer Reporting in California: Standards for Automated Reporting. [Google Scholar]
- 18.California Cancer Reporting system Standards. IV. California Department of Health Services, Cancer Surveillance Section; 1998. Cancer Reporting in California: Standards for Automated Reporting. [Google Scholar]
- 19.California Cancer Registry. How complete are California Cancer Registry data. Available at: http://www.ccrcal.org/Inside_CCR/FAQ.shtml. Accessed June 30, 2014.
- 20.Yost K, Perkins C, Cohen R, et al. Socioeconomic status and breast cancer incidence in California for different race/ethnic groups. Cancer Causes Control. 2001;12:703–711. doi: 10.1023/a:1011240019516. [DOI] [PubMed] [Google Scholar]
- 21.Morgan RJ, Copeland L, Gershenson D, et al. Update of the NCCN ovarian cancer practice guidelines. Oncology. 1997;11:95–105. [PubMed] [Google Scholar]
- 22.Morgan R, Alvarez RD, Armstrong DK, et al. NCCN practice guidelines for ovarian cancer. Version 2000. National Comprehensive Cancer Network; [Google Scholar]
- 23.Morgan R, Alvarez RD, Armstrong DK, et al. Ovarian cancer guideline. Version 1.2002. National Comprehensive Cancer Network; [Google Scholar]
- 24.Morgan R, Alvarez RD, Armstrong DK, et al. Ovarian cancer. Version 1.2003. National Comprehensive Cancer Network; [Google Scholar]
- 25.Morgan R, Alvarez RD, Armstrong DK, et al. Ovarian cancer. Version 1.2005. National Comprehensive Cancer Network; [Google Scholar]
- 26.Fritz APC, Jack A, Shanmugaratnam K, et al. International classification of Diseases for Oncology. Geneva: World Health Organization; 2000. [Google Scholar]
- 27.Institute of Medicine. The Unequal Burden of Cancer. Washington, DC: National Academy Press; 1999. [Google Scholar]
- 28.Institute of Medicine. Unequal Treatment: Confronting Racial and Ethnic Disparities in Healthcare. Washington, DC: National Academy Press; 2003. [Google Scholar]
- 29.Harlan LC, Greene AL, Clegg LX, et al. Insurance status and the use for guideline therapy in the treatment of selected cancers. J Clin Oncol. 2005;23:9079–9088. doi: 10.1200/JCO.2004.00.1297. [DOI] [PubMed] [Google Scholar]
- 30.Freeman HP. Poverty, culture, and social injustice: determinants of cancer disparities. CA Cancer J Clin. 2004;54:72–77. doi: 10.3322/canjclin.54.2.72. [DOI] [PubMed] [Google Scholar]
- 31.U.S. Department of Health and Human Services. Healthy People 2020: Disparities. Available at: http://healthypeople.gov/2020/about/disparitiesAbout.aspx. Accessed January 14, 2014.
- 32.Aranda MA, McGory M, Sekeris E, et al. Do racial/ethnic disparities exist in the utilization of high-volume surgeons for women with ovarian cancer? Gynecol Oncol. 2008;111:166–172. doi: 10.1016/j.ygyno.2008.08.009. [DOI] [PMC free article] [PubMed] [Google Scholar]
- 33.Thorpe KE, Howard D. Health insurance and spending among cancer patients. Health Aff. 2003;W3(Suppl):189–198. doi: 10.1377/hlthaff.w3.189. [DOI] [PubMed] [Google Scholar]
- 34.van Altena AM, van den Akker PAJ, de Hulla JA, et al. Efficacy of a regional network for ovarian cancer care. Obstet Gynecol. 2013;122:668–675. doi: 10.1097/AOG.0b013e3182a054ee. [DOI] [PubMed] [Google Scholar]
- 35.Schrag D, Earle C, Fu X, et al. Associations between hospital and surgeon procedure volumes and patient outcomes after ovarian cancer resection. J Natl Cancer Inst. 2006;98:163–171. doi: 10.1093/jnci/djj018. [DOI] [PubMed] [Google Scholar]