Abstract
In collapsing focal segmental glomerulosclerosis (FSGS) of HIV-associated nephropathy (HIVAN), podocytes exhibit a high proliferation rate and loss of differentiation markers. We have found previously that the nef gene of HIV-1 is responsible for these changes. Here, we investigated the signaling pathways induced by Nef and its role in the pathogenesis of HIVAN. Using conditionally immortalized podocytes after differentiation, we found that infection of podocytes with nef increased Src kinase activity and signal transducer and activator of transcription 3 (Stat3) phosphorylation and activated the Ras–c-Raf–MAPK1,2 pathway. A dominant negative mutant of Src abolished the Nef effect, whereas inhibition of MAPK1,2 or dominant negative Stat3 reduced Nef effects partially. Reducing the expression of Nef with small interference RNA reversed the Nef effect. Mutation of Nef in the PxxP or R105R106 motifs diminished Nef signaling and the phenotypic changes in podocytes. Both phospho-MAPK1,2 and phospho-Stat3 staining increased in podocytes of kidneys from HIV-1 transgenic mice compared with their littermates and in podocytes of kidneys from HIVAN patients compared with HIV patients with non-HIVAN kidney diseases or non-HIV patients with idiopathic FSGS, classic FSGS, or minimal-change disease. These data suggest that Nef-induced activation of Stat3 and Ras-MAPK1,2 via Src-dependent pathways is responsible for podocyte proliferation and dedifferentiation, a characteristic finding in collapsing FSGS of HIVAN.
Introduction
HIV-associated nephropathy (HIVAN) is the most common cause of chronic renal failure in HIV-1–seropositive patients and is the third leading cause of end-stage renal disease in African-Americans between ages 20 and 64 (1, 2). The pathologic features of HIVAN include collapsing focal segmental glomerulosclerosis (FSGS) and microcystic dilatation of tubules (3). Glomerular visceral epithelial cells (podocytes) demonstrate a variety of phenotypic alterations in patients with HIVAN, and they show identical changes in the HIV-1 transgenic (Tg26) mouse model of HIVAN (4–6). The normal mature podocyte is quiescent and highly differentiated. Significant proliferation and hypertrophy of podocytes were observed, however, in both human and mouse kidneys with HIVAN (4–6). With HIV-1 infection, podocytes also undergo dedifferentiation, characterized by loss of expression of differentiation markers including synaptopodin, WT-1, GLEPP-1, and CALLA (5, 6). These findings indicate that the podocytes are profoundly altered in response to infection.
We now know that the podocytes are infected by HIV-1 in Tg26 mice (7) and in patients with HIVAN (8, 9). Transgenic mice bearing a Øgag/pol–deleted HIV-1 genome expressing the regulatory genes including nef under the control of the viral long-terminal repeat develop collapsing FSGS identical to that observed in human HIVAN (10). Hanna et al. studied a series of transgenic mice bearing various HIV-1 constructs under the control of the human CD4 promoter (11, 12). In these studies, they reported that the nef gene was responsible for a renal phenotype that included interstitial nephritis and FSGS, although not of the collapsing variant (11). They further found that the renal phenotype was abolished by introduction of a mutation into the SH3-binding domain of Nef, but not by introduction of an Hck mutation (12). Kajiyama et al. (13) reported a transgenic line of mice that was similar to the gag/pol deletion construct but with an added stop codon engineered into the nef gene. Again, this construct was under the control of the viral long-terminal repeat, and mice developed glomerulosclerosis and tubular dilatation by 6 weeks of age (13). When this line was crossed with a transgenic line expressing nef, these dual-transgenic mice developed more severe glomerulosclerosis (13). The authors concluded that, while the nef gene was not required for inducing kidney disease, it contributed to disease progression. When these 2 studies are taken together, however, they suggest that in the murine model system Nef plays an important role in the pathogenesis of HIVAN.
Studies in vitro also define a clear role of Nef in HIVAN pathogenesis. We reported that conditionally immortalized podocytes from HIV transgenic mice demonstrate increased proliferation and a loss of contact inhibition in culture (14). To identify the HIV-1 gene responsible for these changes, conditionally immortalized podocytes were infected with a series of HIV-1 proviral constructs based on the parental construct (pNL4-3: ØG/P-EGFP) but with stop codons introduced sequentially into the individual env, vif, vpr, vpu, nef, or rev genes. The parental construct expressing all regulatory genes including nef induced proliferation under nonpermissive conditions (37°C) (15). In contrast, the deletion of nef markedly reduced proliferation. The stable expression of nef alone was sufficient to recreate the phenotype of the parental construct (15). Recently, we have reported that Nef upregulates the expression of cyclin A and cyclin E and suppresses the expression of p21 and p27 in podocytes (16). In addition, Nef causes podocyte dedifferentiation characterized by downregulation of synaptopodin and CALLA (16). Thus, both in vitro and in vivo data support an important role for Nef in HIVAN pathogenesis.
Nef is a 27- to 35-kDa myristoylated accessory protein that has many important effects in HIV pathogenesis in general, including viral replication and downregulation of CD4 and MHC I (17–22). Structurally, the left-handed polyproline helix type II of Nef forms a (PxxP)3 sequence cluster (23, 24). This proline-rich motif mediates the interaction between Nef and the SH3 domain of the Src family kinases and the guanine nucleotide exchange factor Vav (23, 24). This interaction is central to many Nef-induced cellular effects (23–25). In addition, Nef interacts with other signaling molecules including p21-activated kinase (PAK), PI3K, and c-Raf1 (26–28). The C-terminal loop of Nef interacts with trafficking molecules, resulting in the downregulation of CD4 and MHC I (19, 20). Thus, Nef plays a major role in signal transduction in T cells.
We hypothesized that Nef could also interact with signaling molecules in podocytes, leading to the activation of multiple signaling pathways that contribute to the phenotypic changes of podocytes observed in HIVAN. Therefore, we examined the downstream signaling pathways of Nef based on the motifs, which are well-defined in T cells. We also explored the relationship of signaling and pathogenesis using well-defined phenotypes established in vitro and in vivo. We used expression of cyclin E as a marker for cell proliferation and loss of synaptopodin expression as a marker for podocyte dedifferentiation. We also studied phosphorylation of these signaling molecules in kidney sections from Tg26 mice and in kidney biopsies from patients with HIVAN and compared them with those from HIV patients with non-HIVAN kidney diseases or non-HIV patients with idiopathic FSGS, classic FSGS, or minimal-change disease.
Results
Nef activates the Src-Stat3 pathway in podocytes.
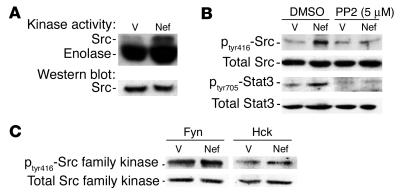
In initial experiments, we examined the effects of infection with nef on the activity of c-Src kinase. Control vector– and nef-infected cells were lysed, and the activity of c-Src was analyzed by transfer of 32P from [γ-32P]-ATP to enolase using a similar method as previously described (29). We found that infection of podocytes with the nef gene alone increased Src kinase activity (3-fold) (Figure 1A). To confirm that the increase was Src-specific, we examined phosphorylation at tyrosine residue 416 (tyr416). Phosphorylation at this site is generally the result of Src activation. Nef-infected podocytes had significantly increased phosphorylation at tyr416 (3.1-fold) (Figure 1B), and phosphorylation was blocked by 4-amino-5-(4-chlorophenyl)-7-(t-butyl) pyrazolo(3,4-d)pyrimidine (PP2), a known inhibitor of the Src family kinases (Figure 1B). In the Nef-infected podocytes, there was no significant increase in Fyn and Hck activity, as shown by the ratio of phosphorylated form to total protein of Src family kinases (Figure 1C). Src activation is known to cause activation of signal transducer and activator of transcription 3 (Stat3) in NIH3T3 cells (29). Hence, we determined whether Stat3 was also tyrosine-phosphorylated. We found that Nef induced 2.7-fold stimulation of Stat3 phosphorylation at tyr705 in the immortalized podocytes. This probably occurs through Src activation, since PP2 completely inhibited this effect (Figure 1B).
Figure 1.
Nef activates the Src-Stat3 pathway. Podocytes were infected with nef-containing vector (Nef) or control vectors (V) as described, and differentiation was induced at 37°C on collagen I for 10 days. (A) Src kinase activity was determined by an in vitro phosphorylation assay as described in Methods. Densitometric data: Src activity/Src protein ratio: V = 0.15 ± 0.02, Nef = 0.45 ± 0.05, P < 0.05, n = 3. (B) Both phosphorylated and total Src and Stat3 were detected by Western blot as described in Methods. Densitometric data: phospho-Src/total Src ratio: V = 0.13 ± 0.02, Nef = 0.40 ± 0.04, V + PP2 = 0.14 ± 0.05, Nef + PP2 = 0.22 ± 0.07, P < 0.05 when Nef is compared with Nef + PP2, n = 4; phospho-Stat3/total Stat3 ratio: V = 0.24 ± 0.05, Nef = 0.65 ± 0.07, V + PP2 = 0.14 ± 0.06, Nef + PP2 = 0.18 ± 0.07, P < 0.01 when Nef is compared with V or with Nef + PP2, n = 4. (C) Phosphorylation of Hck and Fyn was also detected using the same method as that described for Src. Densitometric data: phospho-Hck/total Hck ratio: V = 0.93 ± 0.25, Nef = 0.98 ± 0.32; phospho-Fyn/total Fyn ratio: V = 0.94 ± 0.30, Nef = 1.05 ± 0.35; P = NS, n = 3.
Nef activates Ras–c-Raf–MAPK1,2 activity in podocytes.
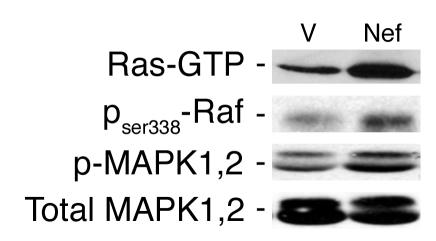
Since c-Src often activates the MAPK pathway as well, we explored the effects of Nef on the MAPK pathway. First we determined whether Nef activated Ras. GTP-bound Ras was identified by a pull-down assay using the Raf-binding domain as the trap. Nef increased Ras-GTP markedly in podocytes (Figure 2, top panel). Since Nef has been shown previously to interact with c-Raf (28), we explored this interaction by using an antibody specific for the phosphorylated c-Raf at ser338. Nef activated c-Raf, which acts upstream of MAPK1,2 (Figure 2, second panel from top). Expression of nef in podocytes induced significant MAPK1,2 (p44/42) phosphorylation without inducing a change in total protein expression (Figure 2, bottom two panels). There was no increase in p38 or JNK phosphorylation (data not shown). These results show that Nef activates the Ras–c-Raf–MAPK1,2 pathway in podocytes.
Figure 2.
Nef-induced Ras-Raf-MAPK1,2 activation in podocytes. Nef-infected podocytes (Nef) and control podocytes (V) were prepared as previously described. Phospho–c-Raf and phospho-MAPK1,2 (p-MAPK1,2) were detected by Western blot using specific antibodies. Ras-GTP was determined by a pull-down assay using Raf1-RBD as the trap. Densitometric data: Ras-GTP: V = 17 ± 4.5, Nef = 49 ± 7.4, P < 0.05, n = 3; c-Raf: V = 0.93 ± 0.25, Nef = 2.74 ± 0.45, P < 0.05, n = 3; phospho-MAPK1,2/total MAPK1,2 ratio: V = 0.37 ± 0.05, Nef = 0.65 ± 0.10, P < 0.01, n = 5.
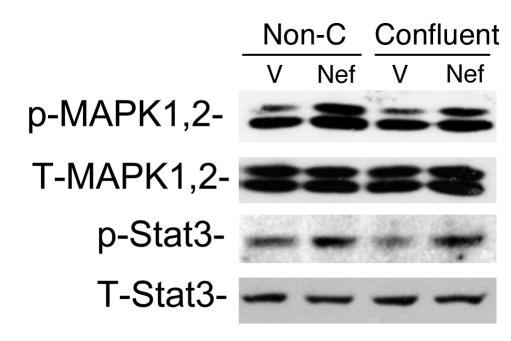
We reported previously that Nef is responsible for the loss of contact inhibition in HIV-infected podocytes. To assess whether cell-cell contact inhibits Nef-induced MAPK1,2 and Stat3 activation, podocytes grown to 50% confluence and to 100% confluence were used. As shown in Figure 3, there was no difference in Nef-induced MAPK1,2 and Stat3 activation between nonconfluent and confluent cells, suggesting that cell-cell contact does not inhibit these signaling pathways.
Figure 3.
Cell-cell contact does not inhibit Nef-induced Stat3 and MAPK1,2 activation. Nef-infected (Nef) or control vector–infected (V) podocytes were prepared as described. Cells grown to 50% confluence (Non-C) were compared with those grown to 100% confluence (Confluent). Western blot was performed for phospho-Stat3, total Stat3 (T-Stat3), phospho-MAPK1,2, and total MAPK1,2 (T-MAPK1,2) using their specific antibodies as described. Densitometric data: phospho-MAPK1,2/total MAPK1,2 ratio: V = 0.66 ± 0.13, Nef = 1.21 ± 0.19 for nonconfluent cells; V = 0.67 ± 0.18, Nef = 1.24 ± 0.12 for confluent cells; phospho-Stat3/total Stat3 ratio: V = 0.65 ± 0.11, Nef = 1.26 ± 0.16 for nonconfluent cells; V = 0.45 ± 0.10, Nef = 1.14 ± 0.26 for confluent cells; P < 0.05 when Nef is compared with V, n = 3.
Role of Src activation in Nef-induced signaling pathways and phenotypic changes in podocytes.
Since Nef significantly induces Src activation in podocytes, we tested the role of Src activation in the stimulation of the MAPK 1,2 and Stat3 pathways and podocyte proliferation and differentiation using SRC dominant negative mutant (Src-DN). As shown in Figure 4A, Src-DN was overexpressed in Nef-infected podocytes. Src-DN exhibited a molecular weight similar to that of wild-type Src because GFP was inserted in place of the catalytic domain of Src. GFP was used to verify the efficiency of transfection and subsequent antibiotic selection. We found that Src-DN significantly inhibited the Nef-induced phosphorylation of Stat3 and MAPK1,2 as well as the expression of cyclin E, a marker for proliferation (Figure 4A). These data suggest that Src acts upstream of Stat3 and MAPK1,2. Src-DN also restored the differentiation of podocytes, manifested by a return of synaptopodin expression (Figure 4B). Finally, transfection with Src-DN completely inhibited Nef-induced podocyte proliferation (Figure 4C). Src-DN had some inhibitory effect on control cells too, probably by inhibition of endogenous Src activity (Figure 4C).
Figure 4.
Role of Src activation in Nef-induced MAPK1,2 and Stat3 phosphorylation and phenotypic changes in podocytes. Control vector–infected (Vector) or Nef-infected (Nef) podocytes were transfected with Src-DN and then selected with hygromycin B. (A) Differentiation was induced at 37°C for 10 days, and then cells were lysed for Western blot for cyclin E, phospho-Stat3, phospho-MAPK1,2, and β-actin. Densitometric data: cyclin E/β-actin ratio: V = 0.15 ± 0.04, V + Src-DN = 0.07 ± 0.03, Nef = 1.57 ± 0.17, Nef + Src-DN = 0.62 ± 0.12; phospho-Stat3/β-actin ratio: V = 0.23 ± 0.06, V + Src-DN = 0.21 ± 0.10, Nef = 0.99 ± 0.18, Nef + Src-DN = 0.30 ± 0.20; phospho-MAPK1,2/β-actin ratio: V = 2.01 ± 0.20, V + Src-DN = 1.83 ± 0.17, Nef = 4.23 ± 0.87, Nef + Src-DN = 1.60 ± 0.26; P < 0.01 when Nef is compared with Nef + Src-DN, n = 3. (B) Total RNA was extracted for Northern blot for synaptopodin (Synap) and GAPDH. Densitometric data: synaptopodin/GAPDH ratio: V = 1.12 ± 0.11, V + Src-DN = 1.34 ± 0.11, Nef = 0.25 ± 0.10, Nef + Src-DN = 1.11 ± 0.14, P < 0.01 when Nef is compared with Nef + Src-DN, n = 3. (C) Simultaneously, cells were divided into 24-well dishes at 20,000 cells per well, and cell number was counted at days 3 and 5. Means of 3 experiments in triplicate are shown. *P < 0.001 as compared with Nef + Src-DN.
Role of Stat3 and MAPK1,2 in mediating Nef activity.
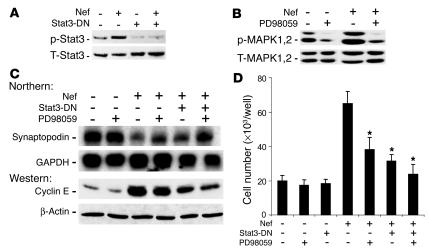
Since Nef caused Stat3 and MAPK1,2 activation, we tested the individual role of these pathways in mediating Nef’s effects on the podocyte phenotype. A dominant negative mutant of Stat3 (Stat3-DN) was created by mutation of the tyr705 residue. We found that Stat3-DN inhibited Nef-induced Stat3 phosphorylation (Figure 5A). Similarly, PD98059 (Calbiochem; EMD Biosciences Inc.), an MEK1/2 inhibitor, blocked MAPK1,2 phosphorylation (Figure 5B). Stat3-DN inhibited Nef-induced cyclin E expression and significantly increased synaptopodin expression (Figure 5C). PD98059 slightly inhibited cyclin E expression and partially restored synaptopodin expression (Figure 5C). An additive effect was observed when cells were treated with both Stat3-DN and PD98059 (Figure 5C). When combined, Stat3-DN and PD98059 also significantly blocked Nef-induced podocyte proliferation (Figure 5D). Control cells were unaffected.
Figure 5.
Role of Stat3 and MAPK1,2 in Nef-induced phenotypic changes in podocytes. Control vector–infected (V) or Nef-infected (Nef) podocytes were transfected with Stat3-DN. (A) Phospo-Stat3 and total Stat3 were determined by Western blot, with the following densitometric data: phospho-Stat3/total Stat3 ratio: V = 0.45 ± 0.15, Nef = 1.25 ± 0.20, V + Stat3-DN = 0.10 ± 0.05, Nef + Stat3-DN = 0.19 ± 0.06, P < 0.01 when Nef is compared with Nef + Stat3-DN, n = 3. (B) Cells were treated with PD98059 at 20 μM overnight, and MAPK1,2 activation was determined by Western blot, with the following densitometric data: phospho-MAPK1,2/total MAPK1,2 ratio: V = 0.91 ± 0.2, V + PD = 0.23 ± 0.11, Nef = 1.52 ± 0.32, Nef + PD = 0.34 ± 0.15, P < 0.01 when Nef is compared with Nef + PD, n = 3. (C) Cells were also used for determination of synaptopodin and GAPDH by Northern blot analysis and of cyclin E and β-actin by Western blot analysis, with the following densitometric data: synaptopodin/GAPDH ratio: V = 0.64 ± 0.21, V + PD = 0.70 ± 0.17, Nef = 0.17 ± 0.05, Nef + PD = 0.42 ± 0.12, Nef + Stat3-DN = 0.31 ± 0.05, Nef + PD + Stat3-DN = 0.63 ± 0.15, P < 0.05 when Nef is compared with Nef + PD or with Nef + Stat3-DN, P < 0.01 when Nef is compared with Nef + PD + Stat3-DN, n = 3; cyclin E/β-actin ratio: V = 0.28 ± 0.05, V + PD = 0.27 ± 0.1, Nef = 2.2 ± 0.52, Nef + PD = 1.8 ± 0.54, Nef + Stat3-DN = 1.32 ± 0.13, Nef + PD + Stat3-DN = 0.80 ± 0.22, P < 0.05 when Nef is compared with Nef + Stat3-DN, P < 0.01 when Nef is compared with Nef + PD + Stat3-DN, n = 4. (D) Cell proliferation: cells were transfected with Stat3-DN or treated with PD98059 as described above. Cell number was determined as described. n = 6. *P < 0.001 as compared with Nef-infected cells.
Reduction of Nef expression by small interference RNA decreased Nef-induced signaling and cyclin E expression.
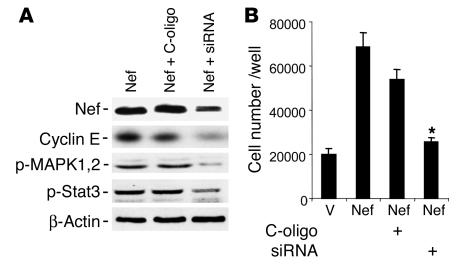
Nef-infected podocytes were transfected with a mixture of small interference RNA (siRNA) oligonucleotides for Nef or control nonsilencing oligonucleotides (C-oligo) for 3 days. Nef expression was reduced significantly in siRNA-treated cells as shown by Western blot analysis (Figure 6A). Nef-induced phosphorylation of Stat3 and MAPK1,2 and expression of cyclin E were significantly diminished in siRNA-treated cells (Figure 6A). Nef-induced cell proliferation was also significantly inhibited by siRNA for Nef (Figure 6B). These data confirm that the stimulation of cell signaling molecules as well as increases in cyclin E expression and cell proliferation in Nef-infected podocytes are due to nef gene expression.
Figure 6.
Effect of Nef siRNA on Nef-induced activity. Nef-infected podocytes were transfected with a mixture of siRNA for Nef or control nonsilencing oligonucleotide for 3 days. (A) Western blot analysis was performed for Nef, cyclin E, phospho-MAPK1,2, phospho-Stat3, and β-actin. Densitometric data: Nef/β-actin ratio: Nef = 1.3 ± 0.1, Nef + C-oligo = 1.19 ± 0.1, Nef + siRNA = 0.52 ± 0.08, P < 0.01 when Nef + siRNA is compared with Nef + C-oligo, n = 3; cyclin E/β-actin ratio: Nef = 0.97 ± 0.16, Nef + C-oligo = 0.92 ± 0.20, Nef + siRNA = 0.35 ± 0.16, P < 0.05 when Nef + siRNA is compared with Nef + C-oligo, n = 4; phospho-MAPK1,2/β-actin ratio: Nef = 0.73 ± 0.12, Nef + C-oligo = 0.67 ± 0.08, Nef + siRNA = 0.11 ± 0.02, P < 0.05 when Nef + siRNA is compared with Nef + C-oligo, n = 4; phospho-Stat3/β-actin ratio: Nef = 0.97 ± 0.13, Nef + C-oligo = 0.81 ± 0.19, Nef + siRNA = 0.27 ± 0.8, P < 0.05 when Nef + siRNA is compared with Nef + C-oligo, n = 4. (B) Cell proliferation assays were performed as described for cells treated with siRNA or control nonsilencing oligonucleotide. *P < 0.001 when Nef + siRNA is compared with Nef + C-oligo, n = 4.
Effects of PxxP and R105R106 motifs in Nef on signaling pathways and phenotypic changes induced by Nef in podocytes.
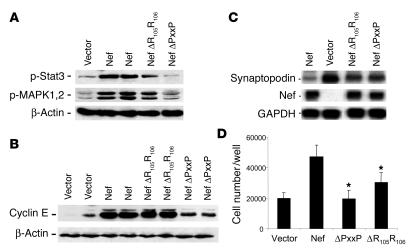
PxxP and R105R106 are binding motifs in Nef for the SH3 domain of the Src family kinases and PAK, respectively. As shown in Figure 7A, Nef mutated in the PxxP motif was unable to induce MAPK1,2 and Stat3 phosphorylation, indicating that the PxxP motif in Nef is required for signaling activity in podocytes. The mutation of the R105R106 motif in the PAK-binding domain in Nef did not affect Stat3 and MAPK1,2 phosphorylation significantly (Figure 7A). Mutation of the PxxP motif in Nef caused a significant decrease in cyclin E expression (Figure 7B) and restored expression of synaptopodin, an index of differentiation of podocytes (Figure 7C). Mutation of the R105R106 motif did not affect cyclin E expression but restored expression of synaptopodin significantly. Mutation of the PxxP motif abolished Nef-induced cell proliferation completely, whereas mutation of the R105R106 motif in Nef had only a modest effect on inhibition of proliferation (Figure 7D). These data suggest that the PxxP motif in Nef is critical for mediating the Nef-induced Stat3 and MAPK1,2 phosphorylation as well as the downstream cellular effects that include podocyte proliferation and dedifferentiation. The R105R106 motif also mediates some of the Nef effects on cell proliferation and dedifferentiation, but probably through a different downstream signaling pathway.
Figure 7.
Effects of PxxP and R105R106 motifs in Nef on Nef-induced MAPK1,2 and Stat3 phosphorylation and phenotypic changes in podocytes. Podocytes were infected with Nef constructs with a mutation in the PxxP or the R105R106 motif using a method similar to that described for WT Nef. (A) Western blot analysis was performed for phospho-Stat3, phospho-MAPK1,2, and β-actin. Densitometric data: phospho-Stat3/β-actin ratio: V = 0.18 ± 0.10, Nef = 0.62 ± 0.22, R105R106 = 0.39 ± 0.21, PxxP = 0.09 ± 0.02; phospho-MAPK1,2/β-actin ratio: V = 0.27 ± 0.10, Nef = 0.91 ± 0.23, R105R106 = 0.83 ± 0.12, PxxP = 0.43 ± 0.01; P < 0.05 when PxxP is compared with Nef, n = 4. (B) Western blot was also performed for cyclin E and β-actin. Densitometric data: cyclin E/β-actin ratio: V = 0.34 ± 0.22, Nef = 1.70 ± 0.26, R105R106 = 1.65 ± 1.11, PxxP = 0.81 ± 0.12, P < 0.01 when PxxP is compared with Nef, n = 4. (C) Northern blot analysis for synaptopodin, Nef, and GAPDH was performed as described. Nef expression was absent in cells infected with control vector. Densitometric data: synaptopodin/GAPDH ratio: Nef = 0.10 ± 0.06, V = 1.03 ± 0.21, PxxP = 0.41 ± 0.15, R105R106 = 0.48 ± 0.12, P < 0.01 when PxxP and R105R106 are compared with Nef, n = 3. (D) Cell proliferation was determined as described. After equal cell numbers (20,000) were plated per well, cell number was counted at day 3. Means of 3 experiments in triplicate are shown. *P < 0.001 as compared with Nef-infected cells.
Increased phospho-MAPK1,2 and phospho-Stat3 in podocytes of Tg26 mice.
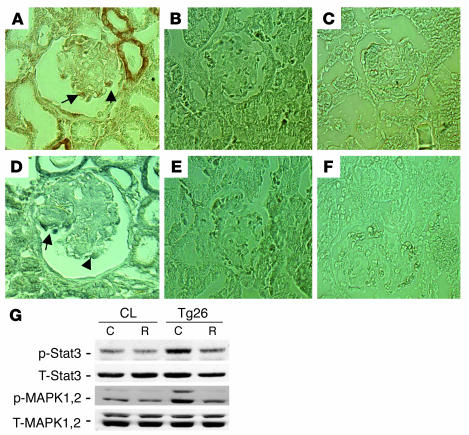
By immunostaining, we found that both phospho-MAPK1,2 and phospho-Stat3 increased in podocytes of kidneys from Tg26 mice compared with littermates (Figure 8, A–F). No positive staining was detected in podocytes of kidneys from all control littermates. Staining was also increased in tubules of Tg26 mice. In addition, podocytes isolated from Tg26 mice were conditionally immortalized and differentiated as previously described (14). These cells exhibited increased phosphorylation for both MAPK1,2 and Stat3 when compared with control podocytes from their littermates (Figure 8G). Roscovitine, a known inhibitor of cyclin-dependent kinase-9, was shown to suppress HIV-1 transcription and reverse the phenotypic changes induced by HIV-1 infection in vitro and in vivo (30, 31). Roscovitine (20 μM) also inhibited HIV-1–induced phosphorylation of MAPK1,2 and Stat3 in podocytes from Tg26 mice (Figure 8G).
Figure 8.
Increased phospho-MAPK1,2 and Stat3 in podocytes from Tg26 mice. (A–F) Immunostaining was performed on kidney sections from 5 Tg26 mice and 4 littermates. Representative pictures are shown. (A) Phospho-MAPK1,2 in a Tg26 mouse. (B) Phospho-MAPK1,2 in littermates. (C) Negative control for phospho-MAPK1,2 using control IgG. (D) Phospho-Stat3 in a Tg26 mouse. (E) Phospho-Stat3 in littermates. (F) Negative control for phospho-Stat3 using control IgG. Arrows indicate positive podocytes. (G) Conditionally immortalized podocytes from Tg26 mice and their littermates (CL) were differentiated at 37°C for 10 days. Then cells were incubated with roscovitine (R) at 20 μM or DMSO (C) overnight before lysis. Western blot was performed as described previously. Densitometric data: phospho-MAPK1,2/total MAPK1,2 ratio: control podocytes, C = 0.17 ± 0.05, R = 0.16 ± 0.04; Tg26 podocytes, C = 0.50 ± 0.09, R = 0.22 ± 0.06; phospho-Stat3/total Stat3 ratio: control podocytes, C = 0.48 ± 0.07, R = 0.38 ± 0.08; Tg26 podocytes, C = 0.72 ± 0.07, R = 0.46 ± 0.08; n = 4; P < 0.05 when R is compared with C in Tg26 podocytes.
Immunohistochemistry of signaling molecules in biopsies of HIVAN kidneys.
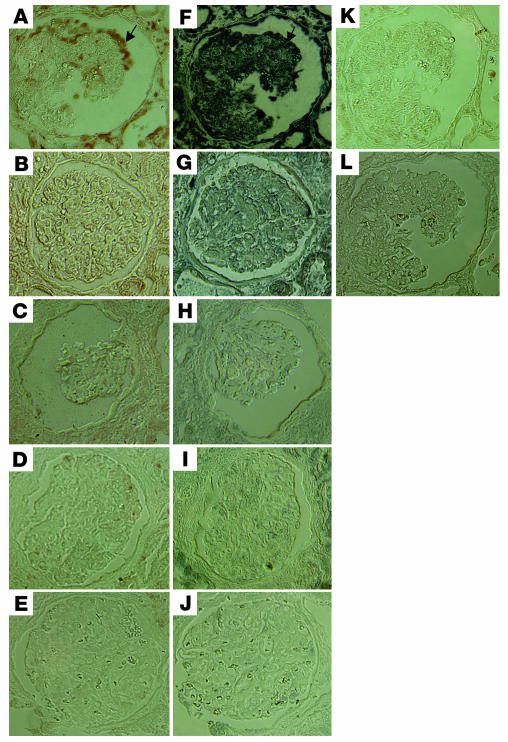
To verify the role of these pathways in mediating Nef activity in vivo in humans, we immunostained kidney tissue sections from patients with HIVAN using antibodies to specific signaling molecules. We used biopsy samples from HIV patients with non-HIVAN kidney diseases as controls. We also used kidney biopsies from non-HIV patients with idiopathic collapsing FSGS, classic FSGS (noncollapsing), or minimal-change disease (nil disease) as controls. By using specific anti–phospho-MAPK1,2 and anti–phospho-Stat3 antibodies, we found that there was a significant increase in phosphorylation of MAPK1,2 and Stat3 in podocytes of all HIVAN kidneys (8 patients) as compared with kidneys from HIV-1–seropositive patients without HIVAN (8 patients) and as compared with kidneys from non-HIV patients with similar collapsing FSGS (5 of 7 patients), classic noncollapsing FSGS (7 patients), or minimal-change disease (6 patients). The number of podocytes with positive staining was counted in all glomeruli of each kidney section from 8 HIVAN patients by 2 independent investigators. We found that the estimated average numbers of positive podocytes per glomerulus in all kidney sections of HIVAN patients were 9.3 ± 5.8 for phospho-MAPK1,2 and 12.5 ± 6.9 for phospho-Stat3. On serial sections, there was partial colocalization between phospho-Stat3 and phospho-MAPK1,2, which indicates a simultaneous activation of both pathways in some podocytes of HIVAN kidneys. There was also simultaneously increased staining in the tubular area of kidneys from HIVAN patients. Interestingly, 2 of 7 idiopathic collapsing FSGS patients had increased staining for both phospho-MAPK1,2 and phospho-Stat3 to the same intensity as observed in HIVAN patients. One of these 2 patients had a mononucleosis-like disease, although his HIV status was negative at that time by both ELISA and PCR. These data indicate that other viral infections may cause activation of the same pathways in podocytes of idiopathic collapsing FSGS. Other patients (5 of 7) with idiopathic collapsing FSGS and all patients with non-HIVAN kidney diseases, classic FSGS, or minimal-change disease had occasional positive staining in podocytes or weaker staining in both mesangial area and podocytes, as compared with HIVAN patients. In HIV-seropositive non-HIVAN kidneys, there was some positive staining of infiltrated cells in the interstitial area. The representative pictures of immunostaining are shown in Figure 9.
Figure 9.
Immunohistochemistry of signaling molecules in kidney biopsies. Immunostaining of phospho-Stat3 and phospho-MAPK1,2 was performed in kidney biopsies from HIVAN patients and compared with that in kidney biopsies from HIV patients with non-HIVAN kidney diseases or from non-HIV patients with idiopathic collapsing FSGS, classic FSGS, or minimal-change disease. Representative pictures are shown. (A) Phospho-MAPK1,2 in HIVAN kidney. (B) Phospho-MAPK1,2 in non-HIVAN kidney (hypertension). (C) Phospho-MAPK1,2 in idiopathic collapsing FSGS kidney (in a patient with negative staining). (D) Phospho-MAPK1,2 in classic FSGS kidney. (E) Phospho-MAPK1,2 in minimal-change disease kidney. (F) Phospho-Stat3 in HIVAN kidney. (G) Phospho-Stat3 in non-HIVAN kidney. (H) Phospho-Stat3 in idiopathic collapsing FSGS kidney (in a patient with negative staining). (I) Phospho-Stat3 in classic FSGS kidney. (J) Phospho-Stat3 in minimal-change disease kidney. (K) Negative control for phospsho-MAPK1,2. (L) Negative control for phospho-Stat3. ×400. Arrows in A and F indicate colocalization of phospho-MAPK1,2 and phospho-Stat3.
Discussion
The glomerular disease of HIV-associated nephropathy is mediated by direct infection of glomerular podocytes in vivo (7–9, 32). Studies by in situ hybridization and laser-capture PCR have shown that HIV-1 mRNA is expressed in podocytes of kidneys from both HIVAN patients and HIV transgenic mice (8, 9). A recent report as an abstract by Zhong et al. showed that expression of HIV-1 genes in podocytes alone causes glomerulosclerosis, further supporting infection of podocytes as the mechanism of disease pathogenesis in vivo (32).
Experimental evidence has revealed that HIV-1 infection induces podocyte injury manifested by proliferation and dedifferentiation, leading to the collapsing FSGS observed in HIVAN (4–6). We have previously determined that Nef alone is sufficient to cause the proliferation and dedifferentiation of podocytes in vitro (15, 16). These changes in podocyte phenotype induced by Nef in vitro are identical to those observed in podocytes of Tg26 mice in vivo as well as in kidney biopsies from HIVAN patients (4–6). These data suggest that proliferation and dedifferentiation are critical processes induced by Nef that ultimately lead to the collapsing FSGS observed in HIVAN.
Nef is an HIV accessory protein with multiple functional domains. We found that the mutation in the PxxP motif in Nef decreased phosphorylation of Stat3 and MAPK1,2 in podocytes when compared with wild-type Nef. In addition, we found that Nef mutations in the PxxP domain prevented Nef-induced podocyte proliferation and downregulation of synaptopodin. These data suggest that the PxxP motif is the major mediator of the Nef signaling that induces proliferation and dedifferentiation of podocytes. The mutation of the R105R106 motif did not affect Stat3 and MAPK1,2 phosphorylation significantly but inhibited Nef’s ability to induce proliferation and dedifferentiation. These data suggest that the R105R106 motif might interact with some other downstream signaling pathway independent of Stat3 and MAPK1,2.
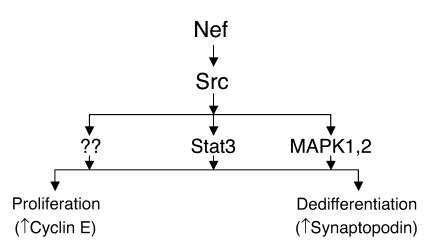
We found in this study that Src is a key mediator of Nef action in podocytes, as summarized in Figure 10. The Src family kinases are a group of nonreceptor tyrosine kinases, involved in cell proliferation, cell-cell adhesion, and cell motility (33). Nef has been shown to interact with the Src family kinases and has the highest affinity for Hck (34). Despite this high affinity, we found that Nef increased Src kinase activity in podocytes, whereas there was only a small increase in Fyn and Hck kinase activity. We found that expression of Src-DN decreased the Src-mediated Stat3 and MAPK1,2 phosphorylation, suppressed Nef-induced cyclin E expression and podocyte proliferation, and restored expression of synaptopodin completely in podocytes. These data indicate that the Src pathway is essential for the Nef-induced changes observed in podocytes. The role of the Src family kinases in HIVAN as well as other kidney diseases has not been well studied. Recently, Verma et al. reported that Fyn binds to nephrin via its SH3 domain, leading to phosphorylation of nephrin (35). Fyn deletion, but not Yes deletion, results in coarsening of podocyte foot processes (35, 36). These reports indicate that individual kinases of the Src family play distinct roles in podocyte pathophysiology. We report here that Src activation is the key pathway that mediates podocyte proliferation and dedifferentiation in response to Nef expression. Our observations suggest that the Src kinase pathway plays a key role in the pathogenesis of HIVAN.
Figure 10.
Schematic of Nef signaling pathways and their relationship with Nef’s biologic effects in podocytes. Nef activates both Stat3 and MAPK1,2 pathways via an Src-dependent pathway. Src activation is essential for Nef-induced podocyte proliferation and dedifferentiation. Stat3 and MAPK1,2 mediate these Nef effects in an additive manner. Other downstream signaling of Nef-Src interaction may also be important.
Src activation causes Stat3 phosphorylation, which leads to transformation of NIH3T3 cells (31). We found that Nef activates Stat3 through Src activation, since both PP2 and Src-DN inhibited this effect. Inhibition of the Stat3 pathway by dominant negative mutants partially diminished Nef’s effects on the induction of cyclin E expression, podocyte proliferation, and the suppression of synaptopodin. We also consistently found that Stat3 phosphorylation was significantly increased in podocytes from HIVAN kidneys and Tg26 mouse kidneys in vivo. In contrast, kidneys from HIV patients with non-HIVAN kidney diseases or from non-HIV patients with collapsing FSGS similar to HIVAN did not exhibit increased staining for phospho-Stat3. These data indicate that activation of the Stat3 pathway may be critical and characteristic for the podocyte proliferation observed in HIVAN. Stat3 is usually activated by the JAK pathway in response to various cytokines and growth factors and by the Src kinase directly (37). Stat3 has been implicated in cell growth, differentiation, and apoptosis (37). Stat3 activation is found in renal cell carcinoma (38) and is considered to be an important signaling pathway for the developing kidney (39). Stat3 activation mediates v-Src–induced cell proliferation through an upregulation of cyclin E expression in hematopoietic cell lines (40), and its activation has also been shown to mediate HGF-induced tubulogenesis (41). Growth arrest–specific gene 6 (Gas6) is a newly identified vitamin K–dependent growth factor for kidney mesangial and epithelial cells (42). Recently, Stat3 has been identified as a key pathway that mediates Gas6-induced kidney cell proliferation (42). We report here that Stat3 phosphorylation is an important and apparently unique signaling pathway for the collapsing FSGS of HIVAN.
The MAPK family is considered an important signaling pathway in many kidney diseases (43). The MAPK family includes at least 3 distinct pathways: extracellular signal–regulated kinase (ERK, or MAPK1,2), JNK, and p38 MAPK (44). It was reported that MAPK1,2, p38, and JNK are expressed in developing kidney, whereas only JNK is expressed in adult kidney (45). Increased phosphorylation of MAPK1,2 was found in renal tubules of the ischemic/reperfusion injury animal model (46) and in the cystic areas of autosomal-dominant polycystic kidney disease (47). The activation of p38 was reported in the mesangium of diabetic nephropathy (48) and in anti–glomerular basement membrane (anti-GBM) glomerulonephritis models (49). We found that Nef induced MAPK1,2 phosphorylation in podocytes in vitro, and an increased phosphorylation of MAPK1,2 was also observed in vivo in podocytes of HIVAN kidney and of Tg26 mice. This was not observed in podocytes of HIV patients with non-HIVAN kidney disease or non-HIV patients with idiopathic collapsing FSGS, classic FSGS, or minimal-change disease.
Increased phospho-MAPK1,2 and phospho-Stat3 were found consistently in podocytes of HIVAN patients, which indicates a relationship among viral infection, the activation of these signaling pathways, and podocyte proliferation. Two of 7 idiopathic collapsing FSGS patients exhibited a similar pattern of change, which suggests that they may share this pathogenic pathway. It is possible that these patients had other viral infection such as JC or SV40 virus. The activation of these signaling pathways and increased proliferation of podocytes could be a common feature of all virally induced collapsing FSGS.
Both in vivo and in vitro, we found that podocytes from Tg26 mice had increased phosphorylation of MAPK1,2 and Stat3, indicating that Tg26 mice share the same pathogenesis as is shown in HIVAN kidneys. None of their littermates had any positive staining in podocytes. The fact that roscovitine diminished Stat3 and MAPK1,2 phosphorylation in podocytes from Tg26 mice suggests that HIV-1 transcription is required for activation of these signaling pathways, although a direct inhibitory effect of the drug on MAPK1,2 phosphorylation cannot be excluded.
Our data suggest that Nef activates both Stat3 and MAPK1,2 in an Src-dependent pathway. In addition, an additive effect was observed between the Stat3 and MAPK1,2 pathways involved in Nef signaling. But inhibition of both Stat3 and MAPK1,2 did not completely suppress cyclin E expression nor completely restore synaptopodin expression. This indicates that other pathways are also involved in the downstream signaling of Nef-Src (Figure 10).
The interpretation of our in vitro observations is limited by several experimental conditions. Infection of podocytes with the nef-containing vectors occurred at 33°C when cells were in a proliferating state. After that, cells were allowed to differentiate at 37°C. We were unable to generate sufficient transfection efficiency by infecting differentiated cells. In addition, because these cells are conditionally immortalized podocytes and are not primary isolates, observed effects of Nef may be due to the T antigen expression. While this system clearly limits interpretation, we have provided clear experimental evidence for Nef’s importance. Decreasing expression of Nef in this system with siRNA or infecting cells with Nef mutants reversed the cellular effects of Nef expression. Thus, Nef rather than T antigen expression was responsible for the transduction patterns observed. In addition, the same pathways were involved when examined in vivo using kidney biopsies from HIVAN patients and kidneys from Tg26 mice, in which the T antigen is not present. Taken together, we believe that these results support a role of MAPK1,2 and Stat3 in vivo.
In conclusion, we report that Nef activates Stat3 and MAPK1,2 through Src-dependent pathways in vitro and in vivo, leading to cell proliferation and dedifferentiation of podocytes. Our in vivo studies suggest that activation of these signaling pathways is unique for collapsing FSGS of HIVAN. Idiopathic collapsing FSGS induced by other viruses, however, may share similar pathways. This study further supports our hypothesis that Nef is a critical HIV protein that mediates podocyte proliferation and dedifferentiation. Our studies also demonstrate, for the first time to our knowledge, that Nef activates Stat3 and MAPK1,2 through Src, and they point out the critical role of Src, MAPK1,2, and Stat3 in the pathogenesis of HIVAN. We believe that the identification of specific motifs in Nef that are responsible for signaling, along with the cognate downstream signaling molecules, will help us to define the regulatory network underlying the key mechanisms of HIVAN pathogenesis.
Methods
Infection of conditionally immortalized murine podocytes with nef-expressing or control vector.
Conditionally immortalized murine podocytes were isolated from control mice and Tg26 mice as previously described (14, 15, 50). These cells proliferate under permissive conditions (IFN-γ at 33°C) but differentiate under nonpermissive conditions (37°C). Under nonpermissive conditions, the cells lose the expression of T antigen. A retroviral expression vector (pBabe-puro) was used to clone nef into the BamHI-SalI site. Moloney murine leukemia virus gag/pol genes and VSV.G envelope were provided in trans to generate pseudotyped virus particles. Podocytes were infected with control vector or Nef-containing vector as described previously (15). The expression of nef in podocytes was confirmed by Western blot analysis (15). For this study, podocytes were infected or transfected when cells were split at passages 15, and then cells were grown at 37°C on type I collagen–coated dishes for 10 days to inactivate the temperature-sensitive T antigen and to allow for differentiation. By Western blot, we confirmed that T antigen was absent in these cells.
Immunoblotting analysis of signaling proteins.
Control and Nef-infected podocytes were lysed with a buffer containing 1% NP40, a protease inhibitor cocktail, and tyrosine and serine-threonine phosphorylation inhibitors. After determination of protein concentration, cell lysates were subjected to Western blot analysis using the following specific antibodies: anti–phospho-p44/42, anti-p44/42, anti–phospho–c-Raf, anti–phospho-Stat3, anti-Stat3, and anti–phospho-Src (all from Cell Signaling Technology Inc.); and monoclonal anti-Src antibodies (Upstate Group Inc.). Western blot data were quantified using KODAK Image Station (PerkinElmer Life Sciences).
Determination of Src kinase activity.
Cell lysates were incubated with monoclonal anti-Src antibody (a gift from Irwin Gelman, Roswell Park Cancer Institute, Buffalo, New York, USA) prebound to protein agarose beads. The immunocomplex was washed twice with lysis buffer and twice with kinase buffer (20 mM HEPES with pH 7.4, 10 mM MgCl2, and 10 μg of enolase [Sigma-Aldrich]), and then resuspended in 15 μl of kinase buffer containing 10 μg of enolase and 25 μCi of [γ32P]-ATP. After 20 minutes of incubation at 32°C, the reaction was stopped by addition of 30 μl of 2× protein-loading buffer. After boiling, the samples were separated in SDS-PAGE and transferred to Immobilon-P membrane (Millipore Corp.) for autoradiography.
To determine the activity of the Src family kinase, we isolated the target substrates by immunoprecipitation with antibodies specific for Hck, Fyn (Santa Cruz Biotechnology Inc.), or Src (Upstate Group Inc.) and then immunoblotting with an anti–ptyr416-Src antibody, which recognizes the active form of all Src family kinases (Upstate Group Inc. and Cell Signaling Technology Inc.). The bands were quantified using KODAK Image Station.
Ras activation assay.
Ras activity was measured using a Ras Activation Assay Kit (Upstate Group Inc.). Cells were lysed in an Mg2+ lysis buffer. Cells loaded with either GTPγs or GDP were used as positive or negative controls. Ras-GTP was pulled down using GST fusion protein corresponding to the human Ras-binding domain of Raf1 (Raf1-RBD). Western blot was performed with an anti-Ras mAb (Upstate Group Inc.).
Cell proliferation.
After podocytes were cultured at 37°C for 10 days on collagen-coated dishes, cells were split and plated on 24-well dishes coated with collagen at 20,000 cells per well in fresh medium. The cell number was counted 3 and 5 days after incubation at 37°C.
Northern blot.
Total RNA was extracted from podocytes using Trizol (Life Technologies Inc.). Probes for Northern blot were generated by RT-PCR of RNA isolated from glomeruli of a normal mouse. The probes for synaptopodin and GAPDH were derived from the published cDNA sequence: GenBank accession number NM021695, nucleotide positions 642–1343, for synaptopodin, and accession number NM008084, nucleotide positions 566–1017, for GAPDH (16). Nef cDNA (pGM91) was obtained from the NIH AIDS Research and Reference Reagent Program. The cDNA probes were radiolabeled with [α32P]-dCTP by random-primer oligonucleotide. Expression levels were quantified by UN-SCAN-IT (Silk Scientific Inc.).
Construction of mutant Nef.
The constructs with mutations in the PxxP (SH3) or R105R106 (PAK) motifs in Nef were generated using QuikChange Site-Directed Mutagenesis kits (Stratagene). The PxxP-binding domain was mutated by changing of the proline residues to alanines. The PAK-binding domain mutation was created by replacement of the R105R106 residues with leucines. These constructs were subcloned into retroviral vectors (pBabe-Puro), and pseudotyped virus was generated as described above. Podocytes were infected with viruses containing mutant nef as described previously for the wild-type nef. The catalytic domain of Src was replaced by GFP to create a dominant negative form of Src (provided by Pamela L. Schwartzberg, NIH). The SH3 domain of this mutant competes with the binding site of Nef for endogenous c-Src, preventing Src activation. Similarly, a dominant negative form of Stat3 was created by mutation of the tyrosine phosphorylation site. Control or Nef-infected podocytes were transfected with these dominant negative mutant plasmids of Src or Stat3 using the GeneJammer transfection reagent (Stratagene). Transfectants were expanded under antibiotic selection.
Nef siRNA experiments.
siRNA sequence was designed using a program provided by QIAGEN Inc. Twenty-one base siRNAs with dTdT overhangs were synthesized by QIAGEN Inc. and transfected into podocytes using TransMessenger Transfection Reagent (QIAGEN Inc.). A transfection efficiency of 70–80% was verified using fluorescence-labeled oligonucleotides. Several different oligonucleotides (Nef sequence accession no. M19921: no. 1, CAATGCTGCTTGTGCCTGG; no. 2, GCACAAGAGGAGGAAGAGG; no. 3, GAGGAGGAAGAGGTGGGTT; no. 4, GAGGTGGGTTTTCCAGTCA; no. 5, GGCAGCTGTAGATCTTAGC; no. 6, GGCTACTTCCCTGATTGGC) were tested and selected based on the inhibition of Nef expression as detected by Western blot using an anti-Nef mAb (FIT Biotech Oyj Plc.). A mixture of siRNAs was used that provided maximal inhibition (nos. 1, 3, and 6).
Immunohistochemistry.
Human biopsy material was collected previously from HIV patients with or without HIVAN after informed consent under a protocol approved by the Mount Sinai Institutional Review Board. Kidney tissue was obtained from 8 patients with HIVAN and 8 patients with non-HIVAN renal disease. The 8 patients with non-HIVAN renal diseases were found among HIV-seropositive patients without typical collapsing FSGS and/or tubular dilatation (2 had diabetes, 4 had hypertensive nephrosclerosis, and 2 had interstitial nephritis). A renal pathologist reviewed these biopsies blindly and confirmed the above diagnoses. Human kidney biopsies from non-HIV patients with other kidney diseases were collected at Columbia University under a protocol approved by its Institutional Review Board. All these patients were found to be HIV-seronegative. These biopsy samples were from 6 patients with minimal-change disease, 7 patients with classic FSGS, and 7 patients with idiopathic collapsing FSGS. For the biopsy specimens from Mount Sinai Hospital, kidney tissue was fixed in 4% paraformaldehyde at 4°C for 2–4 hours and embedded in paraffin. The human kidney biopsies from Columbia University were fixed overnight (up to 12 hours) at room temperature in 10% formalin and embedded in paraffin. Paraffin-embedded tissue sections (5 μm) were placed onto Superfrost Plus slides (VWR Scientific). Kidney sections from Tg26 mice and their littermates were prepared similarly. Immunostaining was performed using rabbit anti–phospho-MAPK1,2 or rabbit anti–phospho-Stat3 primary antibodies (Cell Signaling Technology Inc.) and biotinylated secondary antibodies (Vector Laboratories Inc.) and revealed with avidin-peroxidase (VECTASTAIN Elite; Vector Laboratories Inc.). Slides were mounted in Aqua Poly/Mount (Polysciences Inc.) and photographed under an Olympus BX60 microscope (Olympus Optical Co.) with a digital camera.
Data analysis.
For cell proliferation assays, the data are given as mean ± SDM. For Western blot and Northern blot analyses, all experiments were repeated at least 3 times. Representative experiments are shown below. Bands were quantified by densitometric analysis and are expressed as mean ± SD. Statistically significant differences between the means were determined by unpaired t test. Significance was defined as P ≤ 0.05.
Acknowledgments
John Cijiang He is a recipient of an NIH career development award (K08 DK065495) and a Gaisman Frontiers of Biomedical Sciences Research Award from Mount Sinai School of Medicine. This work was also supported by NIH grants P01 DK056492 to Paul Klotman and R01 GM54508 to Ravi Iyengar. We thank Mike Ross for his help in the preparation of kidney biopsy sections.
Footnotes
John Cijiang He and Mohammad Husain contributed equally to this work.
Nonstandard abbreviations used: FSGS, focal segmental glomerulosclerosis; HIVAN, HIV-associated nephropathy; siRNA, small interference RNA; Src-DN, Src dominant negative mutant; Stat, signal transducer and activator of transcription; Stat3-DN, Stat3 dominant negative mutant; Tg26, HIV-1 transgenic.
Conflict of interest: The authors have declared that no conflict of interest exists.
References
- 1.US Renal Data System. 2001. USRDS 2001 Annual Data Report: Atlas of End-Stage Renal Disease in the United States. The National Institutes of Health, National Institute of Diabetes and Digestive and Kidney Diseases. Bethesda, Maryland, USA. 247 pp. http://www.usrds.org/atlas_2001.htm.
- 2.Ross MJ, Klotman PE. Recent progress in HIV-associated nephropathy. J. Am. Soc. Nephrol. 2002;13:2997–3004. doi: 10.1097/01.asn.0000040750.40907.99. [DOI] [PubMed] [Google Scholar]
- 3.D’Agati V, Appel GB. Renal pathology of human immunodeficiency virus infection. Semin. Nephrol. 1998;18:406–421. [PubMed] [Google Scholar]
- 4.Barisoni L, et al. Podocyte cell cycle regulation and proliferation in collapsing glomerulopathies. Kidney Int. 2000;58:137–143. doi: 10.1046/j.1523-1755.2000.00149.x. [DOI] [PubMed] [Google Scholar]
- 5.Barisoni L, Bruggeman LA, Mundel P, D’Agati VD, Klotman PE. HIV-1 induces renal epithelial dedifferentiation in a transgenic model of HIV-associated nephropathy. Kidney Int. 2000;58:173–181. doi: 10.1046/j.1523-1755.2000.00152.x. [DOI] [PubMed] [Google Scholar]
- 6.Barisoni L, Kriz W, Mundel P, D’Agati V. The dysregulated podocyte phenotype: a novel concept in the pathogenesis of collapsing idiopathic focal segmental glomerulosclerosis and HIV-associated nephropathy. J. Am. Soc. Nephrol. 1999;10:51–61. doi: 10.1681/ASN.V10151. [DOI] [PubMed] [Google Scholar]
- 7.Bruggeman LA, et al. Nephropathy in human immunodeficiency virus-1 transgenic mice is due to renal transgene expression. J. Clin. Invest. 1997;100:84–92. doi: 10.1172/JCI119525. [DOI] [PMC free article] [PubMed] [Google Scholar]
- 8.Bruggeman LA, et al. Renal epithelium is a previously unrecognized site of HIV-1 infection. J. Am. Soc. Nephrol. 2000;11:2079–2087. doi: 10.1681/ASN.V11112079. [DOI] [PubMed] [Google Scholar]
- 9.Marras D, et al. Replication and compartmentalization of HIV-1 in kidney epithelium of patients with HIV-associated nephropathy. Nat Med. 2002;8:522–526. doi: 10.1038/nm0502-522. [DOI] [PubMed] [Google Scholar]
- 10.Kopp JB, et al. Progressive glomerulosclerosis and enhanced renal accumulation of basement membrane components in mice transgenic for human immunodeficiency virus type 1 gene. Proc. Natl. Acad. Sci. U. S. A. 1992;89:1577–1581. doi: 10.1073/pnas.89.5.1577. [DOI] [PMC free article] [PubMed] [Google Scholar]
- 11.Hanna Z, et al. Nef harbors a major determinant of pathogenicity for an AIDS-like disease induced by HIV-1 in transgenic mice. Cell. 1998;95:163–175. doi: 10.1016/s0092-8674(00)81748-1. [DOI] [PubMed] [Google Scholar]
- 12.Hanna Z, et al. The pathogenicity of human immunodeficiency virus (HIV) type I nef in CD4C/HIV transgenic mice is abolished by mutation of its SH3-binding domain, and disease development is delayed in the absence of Hck. J. Virol. 2001;75:9378–9392. doi: 10.1128/JVI.75.19.9378-9392.2001. [DOI] [PMC free article] [PubMed] [Google Scholar]
- 13.Kajiyama W, Kopp JB, Marinos NJ, Klotman PE, Dickie P. Glomerulosclerosis and viral gene expression in HIV-transgenic mice: role of nef. Kidney Int. 2000;58:1148–1159. doi: 10.1046/j.1523-1755.2000.00271.x. [DOI] [PubMed] [Google Scholar]
- 14.Schwartz EJ, et al. Human immunodeficiency virus-1 induces loss of contact inhibition in podocytes. J. Am. Soc. Nephrol. 2001;12:1677–1684. doi: 10.1681/ASN.V1281677. [DOI] [PubMed] [Google Scholar]
- 15.Husain M, et al. HIV-1 nef induces proliferation and anchorage-independent growth in podocytes. J. Am. Soc. Nephrol. 2002;13:1806–1815. doi: 10.1097/01.asn.0000019642.55998.69. [DOI] [PubMed] [Google Scholar]
- 16.Sunamoto M, Husain M, He J, Schwartz E, Klotman PE. Critical role for Nef in HIV-1-induced podocyte dedifferentiation. Kidney Int. 2003;64:1695–1701. doi: 10.1046/j.1523-1755.2003.00283.x. [DOI] [PubMed] [Google Scholar]
- 17.Kestler 3rd HW, et al. Importance of the nef gene for maintenance of high virus loads and for development of AIDS. Cell. 1991;65:651–662. doi: 10.1016/0092-8674(91)90097-i. [DOI] [PubMed] [Google Scholar]
- 18.Simmons A, Aluvihare V, McMichael A. Nef triggers a transcriptional program in T cells imitating single-signal T cell activation and inducing HIV virulence mediators. Immunity. 2001;14:763–777. doi: 10.1016/s1074-7613(01)00158-3. [DOI] [PubMed] [Google Scholar]
- 19.Piguet V, et al. Nef-induced CD4 degradation: a diacidic-based motif in nef functions as a lysosomal targeting signal through the binding of β-COP in endosomes. Cell. 1999;97:63–73. doi: 10.1016/s0092-8674(00)80715-1. [DOI] [PubMed] [Google Scholar]
- 20.Schwartz O, Marechal V, Le Gall S, Lemonnier F, Heard JM. Endocytosis of major histocompatibility complex class I molecules is induced by HIV-1 nef protein. Nat. Med. 1996;2:338–342. doi: 10.1038/nm0396-338. [DOI] [PubMed] [Google Scholar]
- 21.Wolf D, et al. HIV-1 nef associated PAK and PI3-kinases stimulate akt-independent Bad-phosphorylation to induce anti-apoptotic signals. Nat. Med. 2001;7:1217–1224. doi: 10.1038/nm1101-1217. [DOI] [PubMed] [Google Scholar]
- 22.Fackler OT, Luo W, Geyer M, Alberts AS, Peterlin BM. Activation of Vav by Nef induces cytoskeletal rearrangements and downstream effector functions. Mol. Cell. 1999;3:729–739. doi: 10.1016/s1097-2765(01)80005-8. [DOI] [PubMed] [Google Scholar]
- 23.Geyer M, Fackler OT, Peterlin BM. Structure-function relationships in HIV-1 nef. EMBO Rep. 2001;2:580–585. doi: 10.1093/embo-reports/kve141. [DOI] [PMC free article] [PubMed] [Google Scholar]
- 24.Lee CH, Saksela K, Mirza U, Chait BT, Kuriyan J. Crystal structure of the conserved core of HIV-1 Nef complexed with a Src family SH3 domain. Cell. 1996;85:931–942. doi: 10.1016/s0092-8674(00)81276-3. [DOI] [PubMed] [Google Scholar]
- 25.Hiipakka M, Huotari P, Manninen A, Renkema GH, Saksela K. Inhibition of cellular functions of HIV-1 Nef by artificial SH3 domains. Virology. 2001;286:152–159. doi: 10.1006/viro.2001.0973. [DOI] [PubMed] [Google Scholar]
- 26.Renkema GH, Manninen A, Mann DA, Harris M, Saksela K. Identification of the Nef-associated kinase as p21-activated kinase 2. Curr. Biol. 1999;9:1407–1410. doi: 10.1016/s0960-9822(00)80086-x. [DOI] [PubMed] [Google Scholar]
- 27.Linnemann T, Zheng YH, Mandic R, Peterlin BM. Interaction between nef and phosphatidylinositol-3-kinase leads to activation of p21-activated kinase and increased production of HIV. Virology. 2002;294:246–255. doi: 10.1006/viro.2002.1365. [DOI] [PubMed] [Google Scholar]
- 28.Hodge DR, et al. Binding of c-Raf1 kinase to a conserved acidic sequence within the carboxyl-terminal region of the HIV-1 nef protein. J. Biol. Chem. 1998;273:15727–15733. doi: 10.1074/jbc.273.25.15727. [DOI] [PubMed] [Google Scholar]
- 29.Ram PT, Horvath CM, Iyengar R. Stat3-mediated transformation of NIH-3T3 cells by the constitutively active Q205L Gαo protein. Science. 2000;287:142–144. doi: 10.1126/science.287.5450.142. [DOI] [PubMed] [Google Scholar]
- 30.Nelson JP, Gelman IH, Klotman PE. Suppression of HIV-1 expression by inhibitors of cyclin-dependent kinases promotes differentiation of infected podocytes. J. Am. Soc. Nephrol. 2001;12:2827–2831. doi: 10.1681/ASN.V12122827. [DOI] [PubMed] [Google Scholar]
- 31.Gherardi D, et al. Reversal of collapsing glomerulopathy in mice with the cyclin-dependent kinase inhibitor CYC202. J. Am. Soc. Nephrol. 2004;15:1212–1222. doi: 10.1097/01.asn.0000124672.41036.f4. [DOI] [PubMed] [Google Scholar]
- 32.Zhong J, et al. Expression of HIV-1 genes in podocytes alone can lead to glomerulosclerosis [abstract] J. Am. Soc. Nephrol. 2003;14:153A. [Google Scholar]
- 33.Martin GS. The hunting of the Src. Nat. Rev. Mol. Cell Biol. 2001;2:467–475. doi: 10.1038/35073094. [DOI] [PubMed] [Google Scholar]
- 34.Hiipakka M, Poikonen K, Saksela K. SH3 domains with high affinity and engineered ligand specificities targeted to HIV-1 Nef. J. Mol. Biol. 1999;293:1097–1106. doi: 10.1006/jmbi.1999.3225. [DOI] [PubMed] [Google Scholar]
- 35.Verma R, et al. Fyn binds to and phosphorylates the kidney slit diaphragm component Nephrin. J. Biol. Chem. 2003;278:20716–20723. doi: 10.1074/jbc.M301689200. [DOI] [PubMed] [Google Scholar]
- 36.Lahdenpera J, et al. Clustering-induced tyrosine phosporylation of nephrin by Src family kinases. Kidney Int. 2003;64:404–413. doi: 10.1046/j.1523-1755.2003.00097.x. [DOI] [PubMed] [Google Scholar]
- 37.Akira S. Roles of STAT3 defined by tissue-specific gene. Oncogene. 2000;19:2607–2611. doi: 10.1038/sj.onc.1203478. [DOI] [PubMed] [Google Scholar]
- 38.Horiguchi A, Oya M, Marumo K, Murai M. Stat3, but not ERKs, mediates the IL-6-induced proliferation of renal cancer cells, ACHN and 769P. Kidney Int. 2002;61:926–938. doi: 10.1046/j.1523-1755.2002.00206.x. [DOI] [PubMed] [Google Scholar]
- 39.Barasch J, et al. Mesenchymal to epithelial conversion in rat metanephros is induced by LIF. Cell. 1999;99:377–386. doi: 10.1016/s0092-8674(00)81524-x. [DOI] [PubMed] [Google Scholar]
- 40.Odajima J, et al. Full oncogenic activities of v-Src are mediated by multiple signaling pathways. J. Biol. Chem. 2000;275:24096–24105. doi: 10.1074/jbc.m001606200. [DOI] [PubMed] [Google Scholar]
- 41.Boccaccio C, et al. Induction of epithelial tubules by growth factor HGF depends on the STAT pathway. Nature. 1988;391:285–288. doi: 10.1038/34657. [DOI] [PubMed] [Google Scholar]
- 42.Yanagita M, et al. Gas6 induces mesangial cell proliferation via latent transcription factor STAT3. J. Biol. Chem. 2001;276:42364–42369. doi: 10.1074/jbc.M107488200. [DOI] [PubMed] [Google Scholar]
- 43.Tian W, Zhang Z, Cohen DM. MAPK signaling and the kidney. Am. J. Physiol. Renal Physiol. 2000;279:F593–F604. doi: 10.1152/ajprenal.2000.279.4.F593. [DOI] [PubMed] [Google Scholar]
- 44.Johnson GL, Lapadat R. Mitogen-activated protein kinase pathways mediated by ERK, JNK, and p38 protein kinases. Science. 2002;298:1911–1912. doi: 10.1126/science.1072682. [DOI] [PubMed] [Google Scholar]
- 45.Omori S, Hida M, Ishikura K, Kuramochi S, Awazu M. Expression of mitogen-activated protein kinase family in rat renal development. Kidney Int. 2000;58:27–37. doi: 10.1046/j.1523-1755.2000.00137.x. [DOI] [PubMed] [Google Scholar]
- 46.Yang CW, et al. Preconditioning with cyclosporine A or FK506 differentially regulates mitogen-activated protein kinase expression in rat kidneys with ischemic/reperfusion injury. Transplantation. 2003;75:20–24. doi: 10.1097/00007890-200301150-00004. [DOI] [PubMed] [Google Scholar]
- 47.Nagao S, et al. Renal activation of extracellular signal-regulated kinase in rats with autosomal-dominant polycystic kidney disease. Kidney Int. 2003;63:427–437. doi: 10.1046/j.1523-1755.2003.00755.x. [DOI] [PubMed] [Google Scholar]
- 48.Thirone ACP, et al. Modulation of growth hormone signal transduction in kidneys of streptozotocin-induced diabetic animals. Diabetes. 2002;51:2270–2281. doi: 10.2337/diabetes.51.7.2270. [DOI] [PubMed] [Google Scholar]
- 49.Stambe C, et al. Blockade of p38 MAPK ameliorates acute inflammatory renal injury in rat anti-GBM glomerulonephritis. J. Am. Soc. Nephrol. 2003;14:338–351. doi: 10.1097/01.asn.0000048715.12315.fd. [DOI] [PubMed] [Google Scholar]
- 50.Saleem MA, et al. A conditionally immortalized human podocyte cell line demonstrating nephrin and podocin expression. J. Am. Soc. Nephrol. 2002;13:630–638. doi: 10.1681/ASN.V133630. [DOI] [PubMed] [Google Scholar]


