Abstract
Adenosine coordinates organ metabolism and blood supply, and it modulates immune responses. In the kidney it mediates the vascular response elicited by changes in NaCl concentration in the macula densa region of the nephron, thereby serving as an important regulator of GFR. To determine whether adenosine formation depends on extracellular nucleotide hydrolysis, we studied NaCl-dependent GFR regulation (tubuloglomerular feedback) in mice with targeted deletion of ecto-5′-nucleotidase/CD73 (e-5′NT/CD73), the enzyme responsible for adenosine formation from AMP. e-5′NT/CD73–/– mice were viable and showed no gross anatomical abnormalities. Blood pressure, blood and urine chemistry, and renal blood flow were not different between e-5′NT/CD73+/+ and e-5′NT/CD73–/– mice. e-5′NT/CD73–/– mice had a significantly reduced fall in stop flow pressure and superficial nephron glomerular filtration rate in response to a saturating increase of tubular perfusion flow. Furthermore, whereas tubuloglomerular feedback responses did not change significantly during prolonged loop of Henle perfusion in e-5′NT/CD73+/+ mice, a complete disappearance of the residual feedback response was noted in e-5′NT/CD73–/– mice over 10 minutes of perfusion. The contractile response of isolated afferent arterioles to adenosine was normal in e-5′NT/CD73–/– mice. We conclude that the generation of adenosine at the glomerular pole depends to a major extent on e-5′NT/CD73–mediated dephosphorylation of 5′-AMP, presumably generated from released ATP.
Introduction
Adenosine is a multifunctional nucleoside that coordinates cellular oxygen supply and demand by adapting organ blood flow to metabolic rate (1). In addition, adenosine plays a major role in immune responsiveness with its net effect being either pro- or anti-inflammatory, depending on adenosine receptor subtype representation (2). Studies in adenosine receptor KO mice have contributed importantly to further defining nonredundant roles of adenosine in both processes. Our focus has been to elucidate the role of adenosine in the local hemodynamic control mechanism, called tubuloglomerular feedback, that operates in the kidney at the level of the juxtaglomerular apparatus (JGA). Tubuloglomerular feedback describes a functional connection between the tubular epithelium at the site of the macula densa (MD) and the underlying smooth muscle cells of the afferent and efferent glomerular arterioles. An increase in NaCl concentration in the luminal fluid at the MD cells causes an activation of smooth muscle cells and arteriolar vasoconstriction. As a consequence, glomerular filtration pressure and filtration rate fall. Both pharmacological and gene-targeting approaches have shown that tubuloglomerular feedback–induced vasoconstriction has an absolute requirement for functional A1 adenosine receptors (A1ARs), suggesting that adenosine as their natural ligand plays a critical role in the vascular response to increased NaCl (3–6). On the other hand, it has been proposed that ATP may be more important than adenosine in mediating tubuloglomerular feedback responses (7). Recent evidence indicates that ATP is released across the basolateral membrane of MD cells in response to increases in luminal NaCl concentration (8). The hypothesis that ATP might mediate the tubuloglomerular feedback response is based on studies demonstrating impairment of pressure-induced autoregulatory constrictor responses in the presence of inhibitors of P2 purinergic receptors as well as in P2X1 KO mice (9, 10). It is to be noted, however, that no studies have been published thus far that have examined the effect of P2 antagonists or of genetic P2 receptor deficiency on tubuloglomerular feedback responsiveness in a direct fashion.
Nevertheless, these two lines of experimental evidence can be reconciled by assuming that ATP is successively hydrolyzed to 5′-AMP and adenosine in the juxtaglomerular interstitium so that ATP released by MD cells serves as the precursor for the formation of adenosine. Previous evidence in rats has, in fact, suggested that pharmacological blockade of ecto-5′-nucleotidase/CD73 (e-5′NT/CD73) causes a reduced efficiency of tubuloglomerular feedback consistent with the notion that AMP hydrolysis provides some of the adenosine involved in NaCl-dependent vasoconstriction (11). In the current study we have used a gene-targeting approach to assess whether the tubuloglomerular feedback response is dependent upon an intact ATP breakdown pathway. Our data show that mice with a deletion of the e-5′NT/CD73 gene have a marked impairment of tubuloglomerular feedback–dependent vasomotor responses. These data indicate that signaling between MD cells and VSMCs involves e-5′NT/CD73–dependent formation of adenosine presumably from ATP released by MD cells.
Results
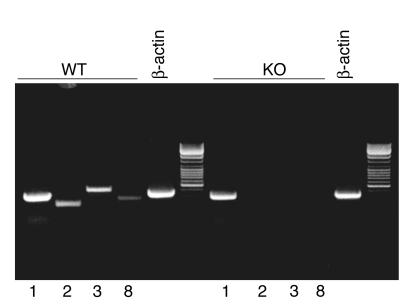
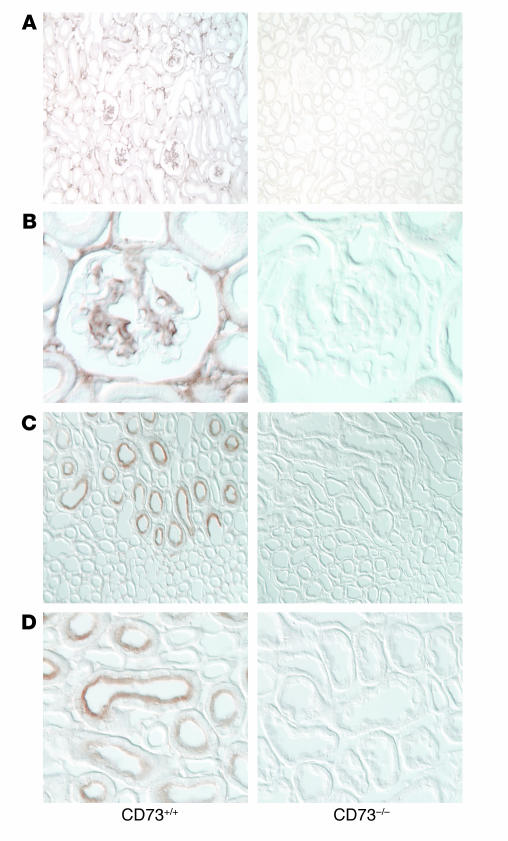
Targeted disruption of the e-5′NT/CD73 gene in the region of the second and third exon caused elimination of mRNA transcripts of the targeted exons as well as all subsequent exons (Figure 1). Immunoperoxidase labeling using a polyclonal Ab against CD73 confirmed the absence of the protein in kidneys of e-5′NT/CD73–/– mice, while WT animals showed immunostaining in glomeruli, presumably in mesangial cells, proximal tubule brush border, and cortical interstitial cells (Figure 2). e-5′NT/CD73–deficient mice were indistinguishable from WT mice in gross anatomical appearance, fertility, and behavior. Crossings of heterozygous mice yielded offspring of the different genotypes in a near Mendelian ratio. Of a total number of 264 pups, 76 (28.8%) were WT, 55 (20.8%) were e-5′NT/CD73–/–, and 133 (50.4%) were e-5′NT/CD73+/–. Also, male and female mice were produced in about equal numbers, with 26 of the 55 e-5′NT/CD73–/– mice being male and 29 female.
Figure 1.
RT-PCR determinations of e-5′NT/CD73 mRNA transcripts in e-5′NT/CD73+/+ (WT) and e-5′NT/CD73–/– mice (KO). Primer sequences are located in exons 1, 2, 3, or 8. PCR reaction with β-actin primers were used as positive control.
Figure 2.
e-5′NT/CD73 Ab staining of kidney sections from WT and e-5′NT/CD73–deficient mice. (A and B) Immunoperoxidase staining of sections of the renal cortex with a polyclonal Ab against e-5′NT/CD73. In sections from WT mice (left) positivity was noted predominantly in the glomerular tuft, including the glomerular stalk, and in interstitial cells. Staining was absent in sections from e-5′NT/CD73–/– mice. (C and D) In the renal outer medulla e-5′NT/CD73 positivity was found in the brush border of proximal straight tubules (left), with no staining being detectable in sections from e-5′NT/CD73–/– animals. Magnification in A and C: ×100; in B and D: ×600.
Plasma and urine chemistry.
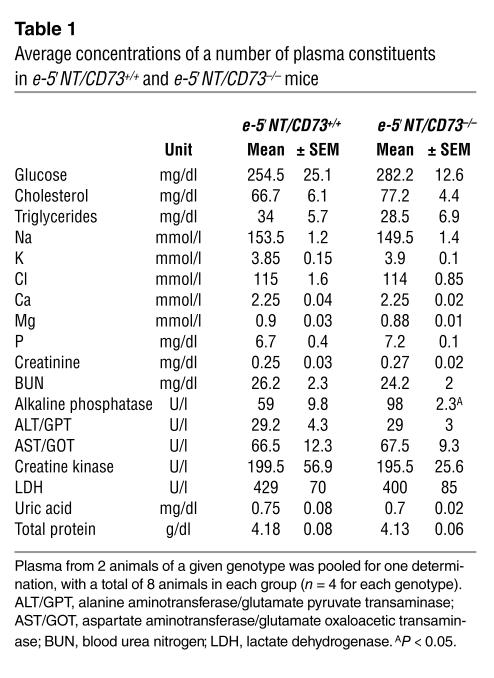
Measurements of a panel of plasma constituents were performed in four male and four female e-5′NT/CD73+/+ and e-5′NT/CD73–/– mice. Since no gender differences were detectable, values from male and female animals were analyzed together. As can be seen in Table 1, the only significant difference was a higher level of plasma alkaline phosphatase in the e-5′NT/CD73–/– mice. Similarly, urinary Na and Cl concentrations were not different between e-5′NT/CD73+/+ and e-5′NT/CD73–/– mice (Na: 156 ± 28 and 172 ± 26 mM; Cl: 115 ± 20 and 104 ± 12.4 mM). Urinary osmolarity, determined in urine collected by bladder puncture shortly after anesthesia, was not different between WT and KO mice (1,900 ± 134 and 1,998 ± 196 mOsm/l; P = 0.69).
Table 1.
Average concentrations of a number of plasma constituents in e-5′NT/CD73+/+ and e-5′NT/CD73–/– mice
Response to 5′-AMP.
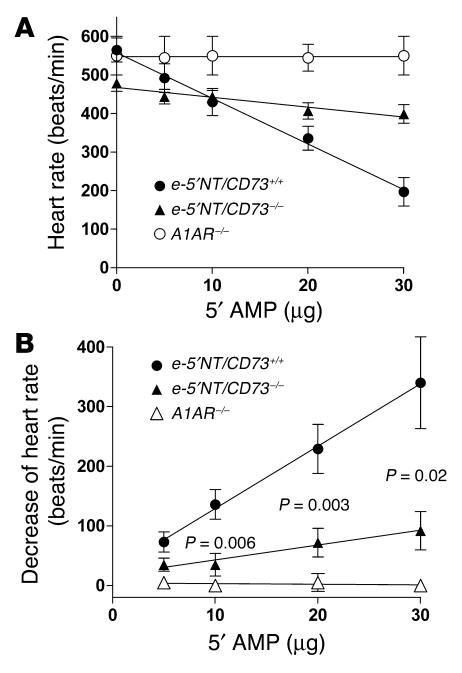
To assess the absence of e-5′NT/CD73 functionally we determined heart rate responses to bolus injections of increasing amounts of 5′-AMP. As can be seen in Figure 3, 5′-AMP caused dose-dependent bradycardia in both WT and e-5′NT/CD73–/– mice, but the magnitude of the heart rate change was significantly attenuated in the e-5′NT/CD73–deficient animals. While heart rate decreased from 555/min ± 33 to 185/min ± 25 in WT animals, it only fell from 500/min ± 32 to 360/min ± 15 in e-5′NT/CD73–/– mice. Thus, a substantial part of the bradycardic effect of 5′-AMP is mediated by activation of A1AR following hydrolysis of 5′-AMP to adenosine. Direct proof of this possibility was obtained by the observation that 5′-AMP had no measurable effect on heart rate in A1AR KO mice (Figure 3).
Figure 3.
Change of heart rate in response to 5′-AMP. (A) Heart rate in e-5′NT/CD73+/+, e-5′NT/CD73–/–, and A1AR–/– mice during control and during the injection of 5, 10, 20, and 30 μg of 5′-AMP. (B) Decrease of heart rate compared with control; significance is given for the comparison between e-5′NT/CD73+/+ and e-5′NT/CD73–/– mice.
Blood pressure.
Systolic blood pressure measured by the tail compression method in awake animals averaged 111 ± 3 mmHg (n = 11) in WT and 102 ± 2 mmHg (n = 11) in e-5′NT/CD73 KO mice (P = 0.02). Heart rate was 529/min ± 9 in WT and 540/min ± 10 in KO mice (P = 0.44). Systolic blood pressure of anesthetized mice about 60 minutes after the administration of inactin/ketamine averaged 100 ± 7 mmHg in WT (n = 10) and 112 ± 5 mmHg in e-5′NT/CD73–/– mice (n = 15; P = 0.17), with mean heart rates being 413/min ± 14 and 434/min ± 14 in WT and KO mice respectively (P = 0.33).
Plasma renin concentration.
Plasma renin concentration (PRC) was determined in five e-5′NT/CD73+/+ and five e-5′NT/CD73–/– mice both under basal conditions and following the intraperitoneal administration of 50 mg/kg furosemide. PRC averaged 736 ± 80 ng Ang I/ml/h in WT and 493 ± 94 ng Ang I/ml/h in e-5′NT/CD73–/– mice (P = 0.08). At 45 minutes after the injection of furosemide, PRC averaged 3,368 ± 576 and 2,373 ± 303 ng Ang I/ml/h in e-5′NT/CD73+/+ and e-5′NT/CD73–/– mice, respectively (P = 0.2). The stimulation of renin secretion by furosemide was 4.6-fold in WT and 4.8-fold in e-5′NT/CD73 KO mice.
Renal blood flow.
Renal blood flow (one kidney) and superficial blood flow velocity (relative measurements given in perfusion units, or PU) were found to average 1 ± 0.1 ml/min and 127 ± 10 PU in WT mice. Values in e-5′NT/CD73–/– animals were 0.9 ± 0.1 ml/min and 127 ± 9 PU, not significantly different from WT animals. Mean arterial blood pressure in these animals averaged 93 ± 6 mmHg in WT and 85.5 ± 3.3 in KO mice (P = 0.29). As a result of similar blood flows and blood pressures, renal vascular resistance was also the same between the two strains of mice (90 ± 6 versus 98 ± 11 mmHg min/ml). In response to 20 μg of AMP, renal vascular resistance fell to 70.5 ± 1.4 mmHg min/ml or by 12% ± 5% in WT and to 95.4 ± 12 mmHg min/ml or by 3.3% ± 2.1% in KO mice, a difference of borderline significance (P = 0.08).
Micropuncture measurements
Stop flow pressure.
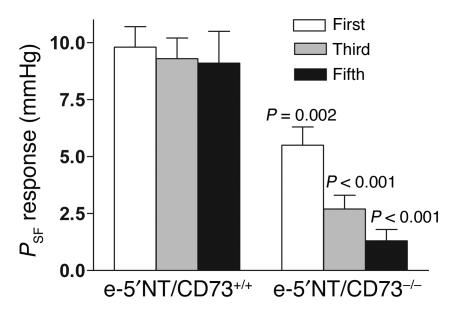
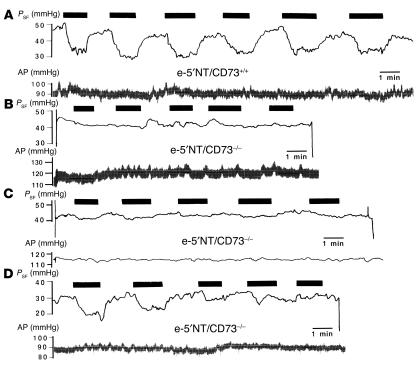
The response of stop flow pressure (PSF) to an increase in loop perfusion rate from 0 to 30 nl/min was examined in five male e-5′NT/CD73+/+ and six male e-5′NT/CD73–/– mice of 2–4 months of age (mean body weight 27.4 ± 0.5 g versus 25.7 ± 0.9 g). Mean arterial blood pressure during the period of micropuncture was 96 ± 3.4 mmHg in WT and 98 ± 2.9 mmHg in KO animals (NS). Similarly, mean PSF at zero loop flow was not significantly different between e-5′NT/CD73+/+ and e-5′NT/CD73–/– animals (40.8 ± 2.1 mmHg versus 37.8 ± 1 mmHg; P = 0.16). Initial responses to a saturating increase in loop flow rate consisted of a 9.8 ± 0.9 mmHg decrease in PSF in WT mice (n = 17), whereas the reduction averaged 5.5 ± 0.8 mmHg in e-5′NT/CD73–/– mice (n = 24; P = 0.002; Figure 4). Observations in individual tubules of e-5′NT/CD73–/– mice (Figure 5) indicated a certain degree of inhomogeneity in that initial responses were absent or greatly suppressed in 18 out of 24 tubules, or 75% (Figure 5, B and C), while they were relatively normal in the remaining 25% (Figure 5D). A comparable response variability was not observed in WT animals. Repetitive flow challenges showed that responding tubules lost tubuloglomerular feedback sensitivity during subsequent flow exposures. Thus, while PSF reductions in WT nephrons were not different between the first, third, and fifth challenge, tubuloglomerular feedback response magnitude in e-5′NT/CD73–/– mice declined to only 2.7 ± 0.6 mmHg and 1.3 ± 0.5 mmHg at the third and fifth challenge, respectively (Figure 4 and Figure 5D).
Figure 4.
Average PSF responses (the difference between PSF at zero and 30 nl/min) to the first, third, and fifth flow challenge in e-5′NT/CD73+/+ and e-5′NT/CD73–/– mice. Lines indicate SEM, and significance is given for comparisons between the genotypes for a given response (nonpaired t test).
Figure 5.
Recordings of PSF (upper traces) and arterial pressure (AP, lower traces) in e-5′NT/CD73+/+ and e-5′NT/CD73–/– mice. Black boxes indicate periods of loop of Henle perfusion at 30 nl/min. (A) Six successive PSF responses in a nephron of a WT mouse; this response pattern is representative for all nephrons studied. (B) Absence of PSF responses in a nephron of an e-5′NT/CD73–/– mouse; this response is representative for 25% of nephrons studied. (C) PSF response in a nephron of an e-5′NT/CD73–/– mouse equal to or smaller than 2 mmHg; this response is representative for 50% of nephrons studied. (D) PSF response in a nephron of an e-5′NT/CD73–/– mouse was initially normal, but disappears after repeated flow challenges; this response is representative for 25% of nephrons studied.
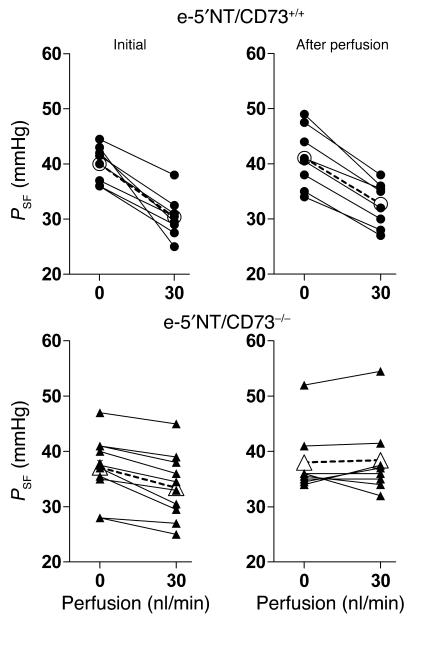
In an additional series of experiments in three WT and four e-5′NT/CD73–/– mice, the reduction in PSF following an increase in flow from 0 to 30 nl/min was determined before and after a period of uninterrupted perfusion for 10 minutes (Figure 6). Tubuloglomerular feedback responses in WT mice to the initial challenge averaged –9.6 ± 1.4 mmHg, while responses following extended perfusion of the loop averaged –8.4 ± 0.8 mmHg (P = 0.39 compared with initial response). In contrast, feedback responses in e-5′NT/CD73–/– mice averaged –3.7 ± 0.7 mmHg initially and 0.4 ± 0.9 after the perfusion (P = 0.001 compared with initial response). Thus, prolonged perfusion in e-5′NT/CD73–/– mice renders the tubuloglomerular feedback system unresponsive to changes in loop perfusion rate.
Figure 6.
PSF in response to a loop of Henle flow elevation from 0 to 30 nl/min in e-5′NT/CD73+/+(filled circles) and e-5′NT/CD73–/– (filled triangles) before (Initial) and after a 10-minute perfusion period at 30 nl/min (After perfusion). Open symbols indicate mean values.
Early proximal flow rate.
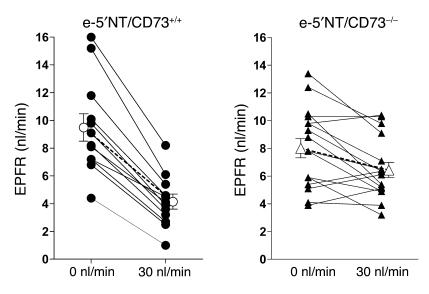
To examine whether the impaired responses of PSF to loop perfusion are paralleled by similarly attenuated responses of superficial nephron glomerular filtration rate (SNGFR), we determined the response of early proximal flow rate (EPFR) to a saturating increase in loop flow rate. EPFR is a close correlate of SNGFR because of the early puncture site, and it has therefore been used as an index of SNGFR in numerous studies (12). Because multiple determinations of EPFR are not reliably possible, we compared EPFR at 0 loop flow with EPFR at the third exposure of a given tubule to a flow of 30 nl/min (Figure 7). In e-5′NT/CD73+/+ mice, EPFR at loop flows of 0 and 30 nl/min averaged 9.5 ± 1 and 4.1 ± 0.54 nl/min, respectively. Thus, EPFR fell 5.3 ± 0.5 nl/min or 57.4% ± 2.8%. In e-5′NT/CD73 KOs, EPFR was 8.0 ± 0.7 nl/min at zero flow (NS compared to WT) and 6.4 ± 0.5 nl/min at a flow of 30 nl/min, values representing a fall of 1.6 ± 0.5 nl/min or 15.6% ± 5.8%. Both absolute and relative reductions in tubuloglomerular feedback responses were significantly reduced in e-5′NT/CD73–/– compared with WT mice (P < 0.0001).
Figure 7.
EPFR during loop of Henle perfusion at 0 and 30 nl/min in e-5′NT/CD73+/+ and e-5′NT/CD73–/– mice. Lines connect measurements in the same tubule. Closed symbols show data from individual nephrons; open symbols indicate mean values.
Isolated perfused afferent arterioles.
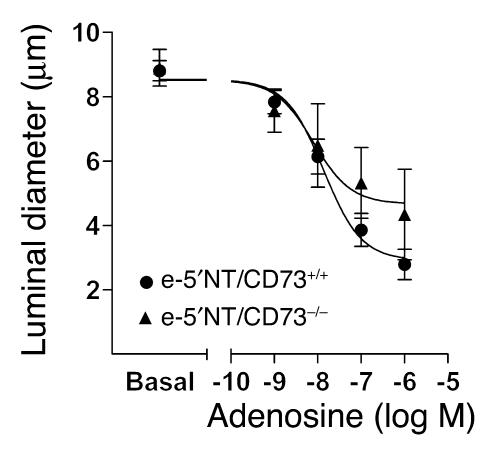
Additional experiments were performed to determine whether the impaired tubuloglomerular feedback response in e-5′NT/CD73–deficient mice was the result of a diminished response of afferent arterioles of these mice to adenosine. As shown in Figure 8, basal diameters of isolated perfused afferent arterioles were similar in e-5′NT/CD73+/+ and e-5′NT/CD73–/– mice, averaging 8.9 ± 0.6 and 8.8 ± 0.3 μm, respectively. Application of adenosine in doses of 10–9, 10–8, 10–7, and 10–6 M constricted afferent arterioles to 7.8 ± 0.4, 6.1 ± 0.5, 3.9 ± 0.5, and 2.8 ± 0.5 μm in WT mice, and to 7.6 ± 0.7, 6.5 ± 1.3, 5.3 ± 1.3, and 4.3 ± 1.3 μm in KOs, respectively, with differences between genotypes at a given dose not reaching 5% levels of significance. Therefore, the altered tubuloglomerular feedback responsiveness seems to be related to impaired signaling rather than a reduced vasoreactivity of the afferent arteriole.
Figure 8.
Average responses of isolated perfused afferent arterioles of e-5′NT/CD73+/+ (n = 10) and e-5′NT/CD73–/– mice (n = 4) to increasing bath concentrations of adenosine. Bars indicate SEM. Curves were calculated by nonlinear regression analysis.
Discussion
The current study describes the generation of mice with a null mutation in the e-5′NT/CD73 gene and initial studies to define the renal and systemic phenotype of these animals. Absence of the enzyme was established at the mRNA level by the failure to detect transcripts beyond the targeted second and third exon and at the protein level by absence of immunostaining with a polyclonal Ab that positively labeled expected expression sites in WT mice. In addition, we used the effect of bolus injections of AMP on heart rate to establish the absence of e-5′NT/CD73 functionally. It has been shown previously that pharmacological blockade of e-5′NT/CD73 blocked the negative chronotropic and inotropic effects of AMP in the heart in situ (13). In the current studies we observed that the bradycardic effect of AMP is markedly attenuated in e-5′NT/CD73 null mice. We also found that AMP-induced bradycardia is entirely absent in a line of mice that lack A1AR receptors, previously generated in our laboratory (3). Thus, e-5′NT/CD73–dependent adenosine formation and subsequent A1AR activation are the dominant causes for AMP-induced bradycardia. The negative chronotropic response to AMP can therefore serve as a functional assay for local, e-5′NT/CD73–dependent adenosine generation and action.
The main observation in the present study is that mice with a null mutation in the e-5′NT/CD73 gene have a markedly reduced ability to translate changes in luminal NaCl concentration into changes in glomerular arteriolar tone. Although e-5′NT/CD73 is believed to have a number of secondary functions (14, 15), there is general agreement that the major role of the enzyme consists of converting extracellular 5′-AMP to adenosine. Dependence of tissue adenosine levels on a functional e-5′NT/CD73 enzyme is supported by studies in which inhibition of the enzyme was found to significantly reduce adenosine concentrations (16, 17). Thus, it would seem likely that failure to produce appropriate amounts of adenosine in response to an increase in luminal NaCl is the underlying reason for the altered tubuloglomerular feedback responsiveness in e-5′NT/CD73 KO mice. Our observations in isolated perfused afferent arterioles have shown that vascular responsiveness to adenosine is normal, further supporting the notion of an inadequate adenosine generation as the cause for the feedback attenuation. We acknowledge the possibility of the alternative explanation that the absence of e-5′NT/CD73 activity may lead to greatly increased ATP concentrations and that this may cause P2 receptor desensitization and subsequent attenuation of tubuloglomerular feedback responses. An increase in extracellular ATP concentration in association with an inhibition of e-5′NT/CD73 has been reported in isolated neutrophils (17). It is not clear, however, that such an effect occurs in a complex tissue in view of the abundance of alternative extracellular ATP breakdown pathways in the form of multiple ecto-ATP diphosphohydrolases, ecto-phosphodiesterase/pyrophosphatases, and alkaline phosphatase (18). In fact, unchanged plasma ATP concentrations have been observed in mice with a KO mutation of CD39, an ecto-enzyme that directly hydrolyzes ATP, and pharmacological inhibition of e-5′NT/CD73 activity did not alter tissue concentrations of ATP in isolated rat kidneys (16, 19). It is also important to point out that our conclusion of a critical role of adenosine deficiency is predicated to a significant extent upon the earlier evidence showing that functionally intact A1ARs are an absolute requirement for feedback-induced vasoconstriction to occur. Tubuloglomerular feedback responses have been found to be essentially completely inhibited by pharmacological A1AR antagonists, and they are abolished in A1AR–/– mice (3–6).
The present observations suggest that the adenosine used in tubuloglomerular signal transmission is generated in the extracellular space by hydrolysis of 5′-AMP. Our observations are in good agreement with earlier studies in which the e-5′NT/CD73 inhibitor, β,γ-methylene adenosine diphosphate, was found to cause a marked right shift and desensitization of the tubuloglomerular feedback response curve (11). Furthermore, convincing preliminary evidence is available to show that the same inhibitor completely blocked the vasoconstriction caused by an increase in luminal NaCl in an in vitro preparation of the rabbit JGA (20). The same authors also have reported for the first time that nonspecific inhibition of P2 receptors with suramin had no effect on NaCl-induced vasoconstriction (20). This observation is further support of the notion that the role of ATP in the feedback response is to cause vasoconstriction indirectly through conversion to adenosine and not directly through activation of P2X receptors. Although it has been proposed that ATP may be a direct vasoconstrictor mediator of the tubuloglomerular feedback response, studies of the effect of P2 receptor antagonists have focused on vessel autoregulation rather than tubuloglomerular feedback itself (10). Since the autoregulatory constrictor reaction is only in part feedback dependent, it does not appear that there is a direct conflict between previous studies and our present conclusions. Nevertheless, further experiments are desirable to directly examine the effect of P2 receptor antagonists and P2 receptor deficiencies on MD-dependent changes of GFR or glomerular capillary pressure.
We suspect that the availability of 5′-AMP in the JGA interstitium is the result of ATP release by MD cells and subsequent metabolism of the nucleoside triphosphate. It was shown recently by using ATP-sensitive reporter cells that MD cells release ATP and that this release is stimulated by raising NaCl concentration (8). Enhanced release of ATP may be related to the swelling of MD cells, which is another consequence of elevating luminal NaCl (21–23). It is likely that ecto-ATPases dephosphorylating ATP to AMP are present in cells adjacent to the MD. ATP-diphosphohydrolase activity is associated with most endothelial cells, including those in the renal vasculature (19, 24). Furthermore, NTPDase2 (CD39L1), one of the nucleoside triphosphate diphosphohydrolases converting ATP and ADP to AMP, has been found in association with MD cells and renal arterioles (S.C. Robson, personal communication). Recent preliminary studies have shown expression of several isoforms of ENPP (ecto-nucleotide pyrophosphatase/phosphodiesterase) in the region of the glomerular vascular pole, including in the glomerular tuft and MD cells (25). e-5′NT/CD73, the enzyme responsible for hydrolysis of AMP, is widely expressed and has a particularly high representation in the kidney (26). Within the kidney, enzyme activity is found in tubules, fibroblasts, and glomerular and extraglomerular mesangial cells (27–29). The present immunohistochemical staining has largely confirmed this distribution pattern in WT mice. In contrast to mice, e-5′NT/CD73 activity was not found in glomerular or extraglomerular mesangial cells of rats (29). Afferent arterioles of rats, however, are surrounded by a sheath of fibroblast processes expressing e-5′NT/CD73 that could conceivably be the location of nucleotide hydrolysis in this species (29). We assume, therefore, that the successive degradation of ATP by a cascade of dephosphorylating enzymes generates adenosine in the juxtaglomerular interstitium and largely prevents a direct constrictor action of ATP. Given the localization of the enzyme and the structure of the juxtaglomerular apparatus, it would seem likely that the interaction with the substrate 5′-AMP occurs on the surface of extraglomerular mesangial cells or of fibroblast processes encasing afferent arterioles. This assumption could possibly provide an alternative explanation for the earlier observation that elimination of mesangial cells by Thy1-1 Ab and complement treatment causes a marked reduction of tubuloglomerular feedback responsiveness in vitro (30). The kinetics of ATP degradation appear compatible with this proposal. Km values for e-5′NT/CD73 have been shown to be in the low micromolar range (31). Since extracellular ATP concentrations at the base of MD cells during high luminal NaCl have been estimated to be around 10 μmol/l (8), 5′-AMP concentrations in the vicinity of the Km seem possible. The efficiency of conversion of 5′-AMP to adenosine varies somewhat between different tissues, but half-degradation times of less than 1 minute have been shown in synaptosomal preparations as well as in bile canalicular membrane vesicles (32, 33). With a delay time of 10–15 seconds and attainment of full vasoconstriction within another 15–30 seconds, the temporal characteristics of tubuloglomerular feedback would therefore seem compatible with a response that results from the generation of adenosine by enzymatic ATP hydrolysis.
Although absence of e-5′NT/CD73 clearly affects tubuloglomerular feedback responsiveness, we observed some variability in the response characteristics of individual nephrons. While three of four nephrons had markedly reduced or absent tubuloglomerular feedback responses from the beginning, a time-dependent attenuation was observed in the remaining nephrons. The reason for this relative inhomogeneity is not entirely clear. One possibility is that ATP in some tubules may have a direct effect on smooth muscle cells through P2X receptors, but that the P2X receptor subtype involved desensitizes and becomes unresponsive with extended exposure times. It is of note that the P2X1 receptor that has been shown to be expressed in afferent arterioles is known for rapid desensitization (34). It is conceivable that due to discrete differences in the diffusion distances in individual JGAs, ATP is able to cause such transient direct constrictions in some, but not all nephrons. Another possibility may be that AMP is converted to adenosine through some other nucleotidase. For example, alkaline phosphatase is another enzyme capable of AMP dephosphorylation, and it is of note that we found plasma alkaline phosphatase levels significantly elevated in e-5′NT/CD73 KO mice. One would have to assume that the capacity of this pathway is insufficient to maintain adenosine generation at the required rate during prolonged MD exposure to high NaCl. Whatever the exact reason for the observed tubuloglomerular feedback desensitization, it is important to emphasize that only a minority of nephrons show this effect and that such loss of reactivity is not a characteristic of the tubuloglomerular feedback response in WT animals (see Figure 5A and Figure 6). Thus, tubuloglomerular feedback desensitization appears to be a phenomenon specific to the model of the e-5′NT/CD73–/– mouse and may therefore be of limited general import.
In summary, e-5′NT/CD73 KO mice are normal in gross anatomical appearance, behavior, and fertility. The constriction of glomerular arterioles in response to increases in luminal NaCl concentration is markedly impaired, however. This impairment is most consistent during repetitive or prolonged exposure of MD cells to the NaCl perturbation. Taken together with previous local measurements of ATP (8), our observations suggest that the main extracellular signaling pathway for the tubuloglomerular feedback response involves ATP release by MD cells, its dephosphorylation to form 5′-AMP, and the subsequent generation of adenosine by the action of e-5′NT/CD73; adenosine then activates A1AR on glomerular arterioles to produce the local vasoconstrictive response.
Methods
Generation of e-5′NT/CD73–/– KO mice.
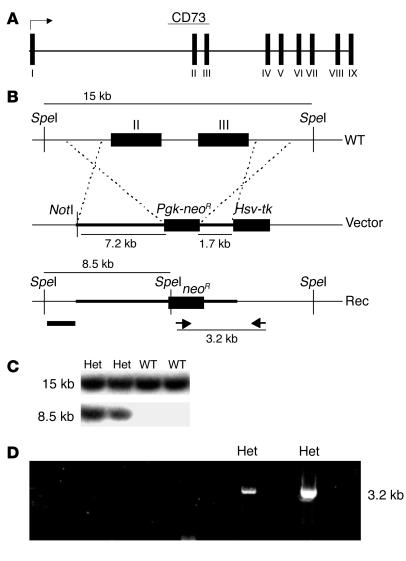
All animal studies were performed according to protocols examined and approved by the Animal Use and Care Committee of the National Institute of Diabetes and Digestive and Kidney Diseases. A targeting vector was generated to replace exons 2 and 3 of the e-5′NT/CD73 gene coding for the presumptive catalytic site of the enzyme (35) with a neomycin-resistance cassette (Figure 9). Briefly, homologous arms upstream (7.2 kb) and downstream (1.7 kb) of the targeted region of the e-5′NT/CD73 gene were generated by long-distance PCR (Expand Long Template; Hoffman-La Roche Inc.) and inserted into the targeting vector pPNT flanking the neomycin-resistance cassette. DNA isolated from 129SvEv ES cells was used as a template. The primers used for amplification of the homologous arms were 5′-GTTCAAAGACGTTCTCGGCTATGAAGC-3′ and 5′-GAGGCCAGCCCATTTTGGTGCCACTGG-3′ for the upstream arm and 5′-CTCCCACCTCTCAGGAGAATGGTAGGAC-3′ and 5′-CTTGCTGTACTAGCCTAGAGACCTGAG-3′ for the downstream arm. The targeting vector was linearized with NotI and transfected into 129SvEv ES cells by electroporation. Five out of 1,245 clones tested by PCR and Southern blotting were found to have undergone homologous recombination. Primers used for screening of the clones were 5′-CGCAGCGCATCGCCTTCTATCGCCTTC-3′ (inside the neomycin-resistance cassette, sense primer) and 5′-GTAGTTCAAGTCGGAGCCTG-3′ (3′ outside of the downstream homologous region, antisense primer), amplifying a 3.2-kb fragment for the correctly targeted allele only. For Southern hybridization, a 300-bp probe was generated 5′ of the upstream homologous arm, detecting a 15-kb SpeI fragment in the WT and a 8.5-kb fragment in the mutated allele. ES cells that had undergone homologous recombination were injected into blastocysts of C57BL/6J mice and implanted into pseudopregnant foster females. Four male chimeras were obtained and crossed to C57BL/6J females to test for germline transmission. Heterozygous progeny was intercrossed to obtain homozygous mutants and WT controls. Genotyping was performed on DNA from tail biopsies using PCR for the neomycin gene (5′-ACAACAGACAATCGGCTGCTCTGATG-3′ and 5′-TGCGCGCCTTGAGCCTGGCGAAC-3′) and for a fragment from WT exon 2 (5′-TGGGAAATCATGAATTTGATAAC-3′ and 5′-GTTGGATATACTTCAAAGGAAACC-3′). Experiments performed in this study were done in littermates derived from matings of heterozygous animals.
Figure 9.
Targeting strategy for e-5′NT/CD73. (A) Schematic drawing of the e-5′NT/CD73 gene consisting of nine exons spanning a total of 42.6 kb. (B) Exon 2 and 3 (WT) were replaced by a neomycin-resistance expression cassette (Vector). (C) Southern blots of homologous recombinants (Rec) using a probe (bar in B) generated to hybridize to genomic DNA outside the homologous region detect a 15-kb DNA fragment in the WT and a 8.5-kb DNA fragment in the recombinant allele after SpeI digestion. Het, heterozygous. (D) For detection by PCR, primers were designed (arrows in B) to amplify a DNA fragment spanning from inside of the neomycin-resistance cassette to outside the homologous region of the vector, generating a 3.2-kb PCR product in the correctly targeted allele only.
RT-PCR.
Total RNA was isolated from kidneys using TRIzol reagent (Gibco-BRL; Life Technologies Inc.). The cDNA was synthesized by Moloney murine leukemia virus RT (Superscript, Gibco-BRL; Life Technologies Inc.). Remaining genomic DNA was digested with RNase-free DNase I (Hoffman-La Roche Inc.), and PCR was performed without RT to test for the efficiency of the digestion. To evaluate the structure of a potential mutant transcript in the KOs, primers for PCR were chosen to amplify fragments from exon 1, 2, 3, and 8. PCR was performed under standard conditions. A fragment from the β-actin cDNA was amplified as a positive control.
Immunohistochemistry.
For immunohistochemical analysis mice were anesthetized and kidneys were fixed in situ by consecutive infusion with 330 mOsm sucrose/PBS (pH 7.4), followed by 3% paraformaldehyde dissolved in PBS as described (36). Fixative was rinsed by subsequent perfusion with sucrose/PBS. Immunolabeling was performed on 5-μm cryostat sections. After blocking with 5% skim milk in PBS, pH 7.4, sections were incubated with the anti-CD 73 Ab (BD Biosciences — Pharmingen) overnight at 4°C, followed by the incubation with an HRP-conjugated secondary Ab (DAKO A/S). Signal generation was performed using diaminobenzidine (KEM EN TEC Diagnostics A/S).
Blood pressure and heart rate.
Animals were kept on a normal rodent diet and had free access to tap water as drinking fluid. Blood pressure and heart rate in conscious mice were determined by tail cuff manometry (Visitech Systems). Animals were conditioned by placing them into the holding device on three consecutive days before the first blood pressure determination.
Blood collection and renin determination.
Tail blood was taken from conscious mice by nicking the tail with a razor blade and collecting the emerging blood into a 75-μl hematocrit tube that contained 1 μl 125 mM EDTA in its tip. Red cells and plasma were separated by centrifugation; the plasma was ejected into an Eppendorf tube and frozen until used for renin determinations. Using a 20-fold dilution of 12 μl of plasma, renin was measured by radioimmunoassay (Perkin-Elmer Life Sciences) as generation of Ang I following addition of excess rat substrate (PRC), with final plasma dilutions varying between 1:500 and 1:1,000. Ang I generation was determined for a 3-hour incubation period at 37°C and expressed as hourly average. In each assay, substrate without plasma was incubated for the same time, and any background Ang I formation was subtracted from the plasma-containing samples. In addition, background Ang I levels were determined in a plasma aliquot kept frozen without the addition of substrate until assaying.
Plasma chemistry.
Plasma chemistry was determined by standard methods in plasma collected from the vena cava of freshly anesthetized mice. The plasma volume obtained from a single mouse was between 200 and 300 μl. Plasma from two mice was pooled to obtain the volume necessary for the assays.
Urine collection.
Single mice were housed in metabolic cages, and urine was collected over a 24-hour period. Urine Na, K, Cl, and osmolarity were measured with standard methods.
Renal blood flow.
Measurements of renal blood flow (RBF) were performed in separate groups of e-5′NT/CD73+/+ and e-5′NT/CD73–/– mice. Mice (2–4 months old) were anesthetized with 100 mg/kg inactin intraperitoneally and 100 mg/kg ketamine intramuscularly. Cannulas were placed in the trachea; the jugular vein was cannulated for substance injection and the intravenous maintenance infusion of isotonic saline at a rate of 0.35 ml/h. The left femoral artery was used for blood pressure monitoring. The left renal artery was approached from a flank incision and carefully dissected free to permit placement of a 0.5PSB nanoprobe connected to a T402-PB flowmeter (Transonic Systems Inc.). The probe was held in place with a micromanipulator. The flow signal was digitized and analyzed using PowerLab software (ADInstruments). RBF was determined for 10 minutes, and values represent the 10-minute average. Following baseline RBF measurements, the response of RBF, heart rate, and blood pressure to intravenous bolus injections of 5, 10, 20, and 30 μg of 5′-AMP was determined in the same animals. The effect of 5′-AMP on heart rate was also assessed in a group of A1AR KO mice generated in our laboratory.
Micropuncture studies.
Experiments were performed in male e-5′NT/CD73+/+ and e-5′NT/CD73–/– mice (23–28 g weight range). Animals were anesthetized and prepared as described above. The left kidney was placed in a Lucite cup and covered with mineral oil. PSF as an index of glomerular capillary pressure was determined during loop perfusions at zero and 30 nl/min as described previously (37). To examine the stability of tubuloglomerular feedback responses over time, up to five successive flow challenges were performed in a given tubule when possible. In an additional series of studies, tubules were perfused uninterruptedly for 10 minutes to assess maintenance of responsiveness over time, and tubuloglomerular feedback responses were determined before and after the perfusion period. To assess the response of nephron filtration rate to a change in loop perfusion rate, timed collections of early proximal flow rate were performed for 2–3 minutes in front of a tubular wax block while the loop was perfused at 30 or 0 nl/min. Sample volumes were derived from fluid column length in constant bore capillaries. The sequence of the flow change was randomized. The following perfusion fluid was used in both experimental series (in mM/l): 136 NaCl, 4 NaHCO3, 4 KCl, 2 CaCl2, 7.5 urea, and 100 mg/100 ml FD&C green (Keystone Scientific Inc.).
Isolated perfused afferent arterioles.
Mouse afferent arterioles with attached glomerulus were microdissected from kidneys of e-5′NT/CD73+/+ and e-5′NT/CD73–/– mice and perfused as described in detail previously (38). In brief, arterioles from mice of either sex (23–32 g) were microdissected from kidney slices at 4°C, transferred to a thermoregulated chamber, cannulated, and perfused with a pipette (tip diameter 5–6 μm) mounted on a moveable track system. The perfusate consisting of physiological salt solution plus 1% BSA was driven from a reservoir pressurized to 60–90 mmHg. The temperature was increased to 37°C, and the vessel was allowed to recover for 30 minutes and then was challenged with potassium (100 mmol/l) to assure viability. Sequences of interest were recorded with a digital camera (CoolSNAP-Pro; Media Cybernetics Inc.) for later determination of luminal vessel diameters using imaging software (Image Pro-Plus; Media Cybernetics Inc.).
Acknowledgments
This work was supported by intramural funds from the National Institute of Diabetes and Digestive and Kidney Diseases. H. Castrop was the recipient of a Visiting Fellowship Grant from the Deutsche Forschungsgemeinschaft (CA278/3-1). We gratefully acknowledge the supply of the pPNT targeting vector by Richard Mulligan (Children’s Hospital, Boston, Massachusetts, USA).
Footnotes
See the related Commentary beginning on page 611.
Nonstandard abbreviations used: A1AR, A1 adenosine receptor; e-5′NT/CD73, ecto-5′-nucleotidase/CD73; EPFR, early proximal flow rate; JGA, juxtaglomerular apparatus; MD, macula densa; PRC, plasma renin concentration; PSF, stop flow pressure; PU, perfusion units; RBF, renal blood flow; SNGFR, superficial nephron glomerular filtration rate.Conflict of interest: The authors have declared that no conflict of interest exists.
References
- 1.Berne RM, Knabb RM, Ely SW, Rubio R. Adenosine in the local regulation of blood flow: a brief overview. Fed. Proc. 1983;42:3136–3142. [PubMed] [Google Scholar]
- 2.Sitkovsky MV, et al. Physiological control of immune response and inflammatory tissue damage by hypoxia-inducible factors and adenosine A2A receptors. Annu. Rev. Immunol. 2004;22:657–682. doi: 10.1146/annurev.immunol.22.012703.104731. [DOI] [PubMed] [Google Scholar]
- 3.Sun D, et al. Mediation of tubuloglomerular feedback by adenosine: evidence from mice lacking adenosine 1 receptors. Proc. Natl. Acad. Sci. U. S. A. 2001;98:9983–9988. doi: 10.1073/pnas.171317998. [DOI] [PMC free article] [PubMed] [Google Scholar]
- 4.Schnermann J, Weihprecht H, Briggs JP. Inhibition of tubuloglomerular feedback during adenosine1 receptor blockade. Am. J. Physiol. Renal Physiol. 1990;258:F553–F561. doi: 10.1152/ajprenal.1990.258.3.F553. [DOI] [PubMed] [Google Scholar]
- 5.Ren Y, Arima S, Carretero OA, Ito S. Possible role of adenosine in macula densa control of glomerular hemodynamics. Kidney Int. 2002;61:169–176. doi: 10.1046/j.1523-1755.2002.00093.x. [DOI] [PubMed] [Google Scholar]
- 6.Brown R, et al. Abolished tubuloglomerular feedback and increased plasma renin in adenosine A1 receptor-deficient mice. Am. J. Physiol. Regul. Integr. Comp. Physiol. 2001;281:R1362–R1367. doi: 10.1152/ajpregu.2001.281.5.R1362. [DOI] [PubMed] [Google Scholar]
- 7.Nishiyama A, Navar LG. ATP mediates tubuloglomerular feedback. Am. J. Physiol. Regul. Integr. Comp. Physiol. 2002;283:R273–R275. doi: 10.1152/ajpregu.00071.2002. [DOI] [PubMed] [Google Scholar]
- 8.Bell PD, et al. Macula densa cell signaling involves ATP release through a maxi anion channel. Proc. Natl. Acad. Sci. U. S. A. 2003;100:4322–4327. doi: 10.1073/pnas.0736323100. [DOI] [PMC free article] [PubMed] [Google Scholar]
- 9.Inscho EW, Cook AK, Navar LG. Pressure-mediated vasoconstriction of juxtamedullary afferent arterioles involves P2-purinoceptor activation. Am. J. Physiol. 1996;271:F1077–F1085. doi: 10.1152/ajprenal.1996.271.5.F1077. [DOI] [PubMed] [Google Scholar]
- 10.Inscho EW, Cook AK, Imig JD, Vial C, Evans RJ. Physiological role for P2X1 receptors in renal microvascular autoregulatory behavior. J. Clin. Invest. 2003;112:1895–1905. doi:10.1172/JCI200318499. doi: 10.1172/JCI18499. [DOI] [PMC free article] [PubMed] [Google Scholar]
- 11.Thomson S, Bao D, Deng A, Vallon V. Adenosine formed by 5′-nucleotidase mediates tubuloglomerular feedback. J. Clin. Invest. 2000;106:289–298. doi: 10.1172/JCI8761. [DOI] [PMC free article] [PubMed] [Google Scholar]
- 12.Schnermann, J., and Briggs, J.P. 2000. Function of the juxtaglomerular apparatus: control of glomerular hemodynamics and renin secretion. In The Kidney: Physiology and Pathophysiology. D.W. Seldin and G. Giebisch, editors. Lippincott Williams & Wilkins. Philadelphia, Pennsylvania, USA. 945–980.
- 13.Miki T, et al. Ecto-5′-nucleotidase is not required for ischemic preconditioning in rabbit myocardium in situ. Am. J. Physiol. 1998;275:H1329–H1337. doi: 10.1152/ajpheart.1998.275.4.H1329. [DOI] [PubMed] [Google Scholar]
- 14.Resta R, Thompson LF. T cell signalling through CD73. Cell. Signal. 1997;9:131–139. doi: 10.1016/s0898-6568(96)00132-5. [DOI] [PubMed] [Google Scholar]
- 15.Zimmermann H, Braun N. Ecto-nucleotidases — molecular structures, catalytic properties, and functional roles in the nervous system. Prog. Brain Res. 1999;120:371–385. [PubMed] [Google Scholar]
- 16.Ramos-Salazar A, Baines AD. Role of 5′-nucleotidase in adenosine-mediated renal vasoconstriction during hypoxia. J. Pharmacol. Exp. Ther. 1986;236:494–499. [PubMed] [Google Scholar]
- 17.van Waeg G, Van den Berghe G. Purine catabolism in polymorphonuclear neutrophils. Phorbol myristate acetate-induced accumulation of adenosine owing to inactivation of extracellularly released adenosine deaminase. J. Clin. Invest. 1991;87:305–312. doi: 10.1172/JCI114987. [DOI] [PMC free article] [PubMed] [Google Scholar]
- 18.Zimmermann H. Extracellular metabolism of ATP and other nucleotides. Naunyn Schmiedebergs Arch. Pharmacol. 2000;362:299–309. doi: 10.1007/s002100000309. [DOI] [PubMed] [Google Scholar]
- 19.Enjyoji K, et al. Targeted disruption of cd39/ATP diphosphohydrolase results in disordered hemostasis and thromboregulation. Nat. Med. 1999;5:1010–1017. doi: 10.1038/12447. [DOI] [PubMed] [Google Scholar]
- 20.Ren Y, Garvin JL, Liu R, Carretero OA. Role of macula densa adenosine triphosphate on tubuloglomerular feedback [abstract] J. Am. Soc. Nephrol. 2003;14:57A. doi: 10.1111/j.1523-1755.2004.00911.x. [DOI] [PubMed] [Google Scholar]
- 21.Sabirov RZ, Dutta AK, Okada Y. Volume-dependent ATP-conductive large-conductance anion channel as a pathway for swelling-induced ATP release. J. Gen. Physiol. 2001;118:251–266. doi: 10.1085/jgp.118.3.251. [DOI] [PMC free article] [PubMed] [Google Scholar]
- 22.Peti-Peterdi J, Morishima S, Bell PD, Okada Y. Two-photon excitation fluorescence imaging of the living juxtaglomerular apparatus. Am. J. Physiol. Renal Physiol. 2002;283:F197–F201. doi: 10.1152/ajprenal.00356.2001. [DOI] [PubMed] [Google Scholar]
- 23.Liu R, Pittner J, Persson AE. Changes of cell volume and nitric oxide concentration in macula densa cells caused by changes in luminal NaCl concentration. J. Am. Soc. Nephrol. 2002;13:2688–2696. doi: 10.1097/01.asn.0000033275.17169.67. [DOI] [PubMed] [Google Scholar]
- 24.Sandoval S, et al. ATP-diphosphohydrolase activity in rat renal microvillar membranes and vascular tissue. Int. J. Biochem. Cell Biol. 1996;28:591–599. doi: 10.1016/1357-2725(95)00153-0. [DOI] [PubMed] [Google Scholar]
- 25.Kishore BK, et al. Cellular localization of nucleotide pyrophosphatases/phosphodiesterases in rat kidney [abstract] FASEB J. 2004;18:A733. [Google Scholar]
- 26.Resta R, et al. Murine ecto-5′-nucleotidase (CD73): cDNA cloning and tissue distribution. Gene. 1993;133:171–177. doi: 10.1016/0378-1119(93)90635-g. [DOI] [PubMed] [Google Scholar]
- 27.Wu F, Li PL, Zou AP. Microassay of 5′-nucleotidase and adenosine deaminase activity in microdissected nephron segments. Anal. Biochem. 1999;266:133–139. doi: 10.1006/abio.1998.2951. [DOI] [PubMed] [Google Scholar]
- 28.Ardaillou R, Chansel D, Stefanovic V, Ardaillou N. Cell surface receptors and ectoenzymes in mesangial cells. J. Am. Soc. Nephrol. 1992;2(10 Suppl.):S107–S115. doi: 10.1681/ASN.V210s107. [DOI] [PubMed] [Google Scholar]
- 29.Le Hir M, Kaissling B. Distribution and regulation of renal ecto-5′-nucleotidase: implications for physiological functions of adenosine. Am. J. Physiol. 1993;264:F377–F387. doi: 10.1152/ajprenal.1993.264.3.F377. [DOI] [PubMed] [Google Scholar]
- 30.Ren Y, Carretero OA, Garvin JL. Role of mesangial cells and gap junctions in tubuloglomerular feedback. Kidney Int. 2002;62:525–531. doi: 10.1046/j.1523-1755.2002.00454.x. [DOI] [PubMed] [Google Scholar]
- 31.Zimmermann H. 5′-Nucleotidase: molecular structure and functional aspects. Biochem. J. 1992;285:345–365. doi: 10.1042/bj2850345. [DOI] [PMC free article] [PubMed] [Google Scholar]
- 32.Che M, Nishida T, Gatmaitan Z, Arias IM. A nucleoside transporter is functionally linked to ectonucleotidases in rat liver canalicular membrane. J. Biol. Chem. 1992;267:9684–9688. [PubMed] [Google Scholar]
- 33.Cunha RA, Sebastiao AM, Ribeiro JA. Inhibition by ATP of hippocampal synaptic transmission requires localized extracellular catabolism by ecto-nucleotidases into adenosine and channeling to adenosine A1 receptors. J. Neurosci. 1998;18:1987–1995. doi: 10.1523/JNEUROSCI.18-06-01987.1998. [DOI] [PMC free article] [PubMed] [Google Scholar]
- 34.Schwiebert EM, Kishore BK. Extracellular nucleotide signaling along the renal epithelium. Am. J. Physiol. Renal Physiol. 2001;280:F945–F963. doi: 10.1152/ajprenal.2001.280.6.F945. [DOI] [PubMed] [Google Scholar]
- 35.Knofel T, Strater N. X-ray structure of the Escherichia coli periplasmic 5′-nucleotidase containing a dimetal catalytic site. Nat. Struct. Biol. 1999;6:448–453. doi: 10.1038/8253. [DOI] [PubMed] [Google Scholar]
- 36.Theilig F, et al. Epithelial COX-2 expression is not regulated by nitric oxide in rodent renal cortex. Hypertension. 2002;39:848–853. doi: 10.1161/01.hyp.0000013082.99285.35. [DOI] [PubMed] [Google Scholar]
- 37.Schnermann JB, et al. Absence of tubuloglomerular feedback responses in AT1A receptor-deficient mice. Am. J. Physiol. Renal Physiol. 1997;273:F315–F320. doi: 10.1152/ajprenal.1997.273.2.F315. [DOI] [PubMed] [Google Scholar]
- 38.Hansen PB, Castrop H, Briggs J, Schnermann J. Adenosine induces vasoconstriction through Gi-dependent activation of phospholipase C in isolated perfused afferent arterioles of mice. J. Am. Soc. Nephrol. 2003;14:2457–2465. doi: 10.1097/01.asn.0000086474.80845.25. [DOI] [PubMed] [Google Scholar]


