Abstract.
Multipath scattering, or reverberation, takes a substantial toll on image quality in many clinical exams. We have suggested a model-based solution to this problem, which we refer to as aperture domain model image reconstruction (ADMIRE). For ADMIRE to work well, it must be trained with precisely characterized data. To solve this specific problem and the general problem of efficiently simulating reverberation, we propose an approach to simulate reverberation with linear simulation tools. Our simulation method defines total propagation time, first scattering site, and a final scattering site. We use a linear simulation package, such as Field II, to simulate scattering from the final site and then shift the simulated wavefront later in time based on the total propagation time and the geometry of the first scattering site. We validate our simulations using theoretical descriptions of clutter in the literature and data acquired from ex vivo tissue. We found that ex vivo tissue clutter had a mean speckle SNR of , which we could simulate with about 2 scatterers per resolution cell. Axial clutter distributions drawn from an exponential distribution with a mean of 5 mm and at least 0.5 scatters per resolution cell resulted in clutter that was statistically indistinguishable from the van Cittert–Zernike behavior predicted by literature.
Keywords: ultrasound, reverberation, multipath scattering, simulations, nonlinear
1. Introduction
Growing evidence indicates that reverberation-induced image degradation is a widespread problem in ultrasonic imaging.1–4 A handful of methods are the sources of this degradation. These include long-standing approaches, such as time-reversal, and newer approaches, such as second-order ultrasound field imaging and aperture domain coherence beamformers.4–8 We recently introduced a model-based approach called aperture domain model image reconstruction (ADMIRE).2,9 ADMIRE eliminates clutter using a received signal model, which includes modeling energy received from off-axis and reverberation scattering sites. For ADMIRE to work correctly, it needs to be trained with well characterized data. This means we need data where it is known exactly which aspects of the signal are clutter and which are clean signal from the receive focus.
To solve this training problem, we use simulated data. Excellent methods exist that simulate reverberation and other nonlinear effects, including the simulation tool developed by Pinton et al.10 and the open-source -wave tool developed by Treeby et al.11 These methods work well, are realistic, and allow input of physically meaningful parameters, but these tools do not differentiate the various sources of the received signal (i.e., there is no way to perfectly segment the linear scattering component from reverberation). These methods are also computationally slow compared to purely linear simulation tools such as Field II and Fast Object-Oriented C++ Ultrasound Simulator (FOCUS).12–14 To efficiently generate simulated data that mimics reverberation, we introduced a pseudononlinear simulation strategy that builds on existing efficient, linear simulation packages.15 This approach allows for the rapid simulation of many realizations of realistic clutter; furthermore, the clutter component is known precisely. We used a similar simulation approach in our previous work to train ADMIRE, but this early simulation tool was not robustly validated and did not maintain appropriate lateral correlation.2
As stated, the primary motivation for the proposed method is to generate training data for advanced beamforming algorithms; however, the method developed here may also provide insight into the properties of reverberation encountered clinically. Specifically, our results will show that there does not need to be a fundamentally different model for coherent and diffuse clutter, which are defined as distinct phenomena by Dahl and Sheth.1 Coherent clutter is defined as reverberation induced by distinct layers, mostly parallel to the surface of the probe, whereas diffuse clutter has a speckle-like appearance indistinguishable from tissue scattering. We will demonstrate that the only difference between the two types of clutter may be the varying number of multipath sources scattering arriving at the transducer simultaneously.
First, we will describe our algorithm for simulating reverberation using only existing, fast, linear simulation tools, and then we will validate the simulated results against theory and ex vivo tissue measurements.
2. Methods
2.1. Multiple Scattering
When conceptualizing the scattering from inhomogeneous media with low amplitude scatterers, the Born approximation is typically invoked.12 The approximation holds when the scattering amplitude from inhomogeneities within the medium is so low that scattering events beyond the first are inconsequential. The result is a linear scattering field. However, when some scatterers have sufficiently large impedance mismatches relative to the surrounding material, higher order scattering becomes relevant. In this case, pressure waves sampled by a transducer may have been scattered two or more times. A primary effect of these multiply scattered waves is to delay them in time relative to their arrival time after scattering only once, despite returning from the same location.9
2.2. Pseudononlinear Simulation Algorithm
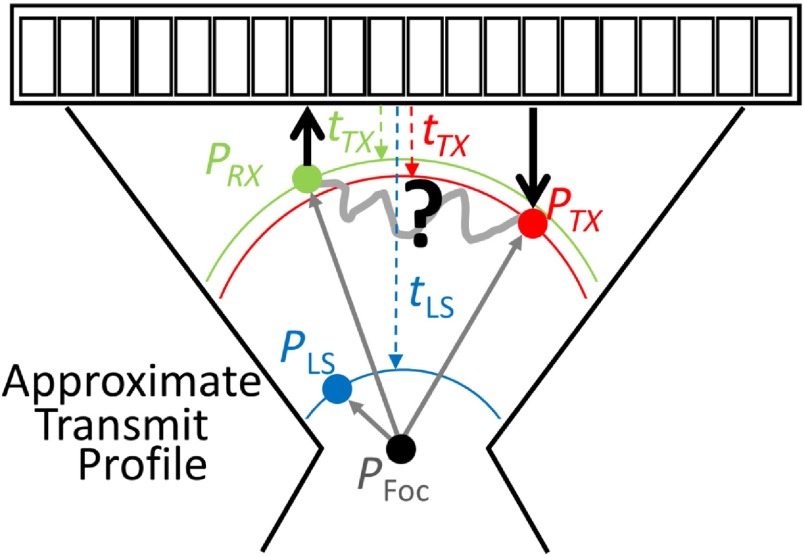
In typical linear simulations, tissue is approximated as discrete point scatterers at specified locations.12,13 Similarly, in our pseudononlinear simulations, reverberation is simulated based on a set of 3 point scatterers as shown in Fig. 1. The first point indicates the linear scattering arrival time location (), which fixes the propagation time of the multiply scattered pressure wave. (Scattering from is never directly simulated.) The total propagation time can be calculated as
| (1) |
where is the location of the transmit focus and is the unit vector in the axial direction. The point constrains the next two points, which are the first point of scattering () and the last point of scattering () of the multiply scattered pressure waves. The time from transmit to the first scattering site, is
| (2) |
Fig. 1.
A diagram is shown for the simulation geometry. is the point where the pressure wave is first scattered. is the final scattering location for the pressure wave returned to the transducer. is a reference point used to account for the unknown portion of the multiply scattered energy. denotes the position of the transmit focus and is important for determining propagation times.
The time from the final scattering site back to the transducer is
| (3) |
where is the location of the ’th element in the transducer, but for the purposes here, only the leading edge of the received wavefront is required. The time spent between and is computed as
| (4) |
The point is randomly sampled first and then points and are repeatedly and simultaneously sampled until . It is worth noting explicitly that we do not consider what might happen between and . The propagation between these two points could be direct or it could involve additional scattering, but this is not simulated. The vagaries of the propagation that may occur between these two points are accounted for by referencing the total multipath propagation time to the propagation time of the matched linear scattering site—.
Point was selected from uniform distributions covering the region of interest in the axial and lateral dimensions. The lateral positions of and were selected from a uniform distribution centered around the lateral location of . For the axial location, several different distributions were evaluated; for a given scenario, the same distribution was always used for and .
Once the three points have been selected, the points are used to simulate reverberation using a linear simulation tool. First, the wavefront from only the final scattering site, , is simulated using Field II in pulse–echo mode. The pulse–echo simulation introduces an unnecessary delay based on the transmit time to calculated as
| (5) |
Next, we use , , and to determine the appropriate time delay for the simulated wavefront. This time delay is calculated as
| (6) |
where is not considered when calculating because that delay is already present in the simulated data. Finally, we shift the simulated data later in time by . The time shift was implemented using cubic spline interpolation.
The simulated reverberation radio frequency channel data were normalized based on the energy impinging on . Channel data were simulated for a scatterer located along the transmit focal axis at the same depth as , referred to as . The peak magnitude of these data was compared to the peak magnitude of channel data from , referred to as . The scale factor applied to the time-shifted channel data returning from was calculated as
| (7) |
2.3. Algorithm Implementation
We implemented the algorithm using Field II and MATLAB® (Mathworks, Natick, Massachusetts),12,13 and we used the parameters in Table 1 unless specified otherwise.
Table 1.
Simulation parameters unless otherwise stated.
| Parameter | Value |
|---|---|
| Focal depth | 30 mm |
| Transmit | 1.5 |
| Receive | 1 |
| 3 MHz | |
| Lateral pitch | |
| Elevation height | 8 mm |
| Bandwidth | 60 % |
| Simulation | 80 MHz |
| Speed-of-sound |
For the set of points that determined each reverberant scatterer, we drew from a uniform distribution equal to the field of view, which was 3-cm wide and extended axially from 2.4 to 3.6 cm. For most cases, the axial depth of and was drawn from an exponential distribution with a mean of 5 mm. The lateral position was always uniformly distributed with a width of 1 cm centered about the lateral position of the corresponding .
2.4. Ex Vivo Clutter Measurements
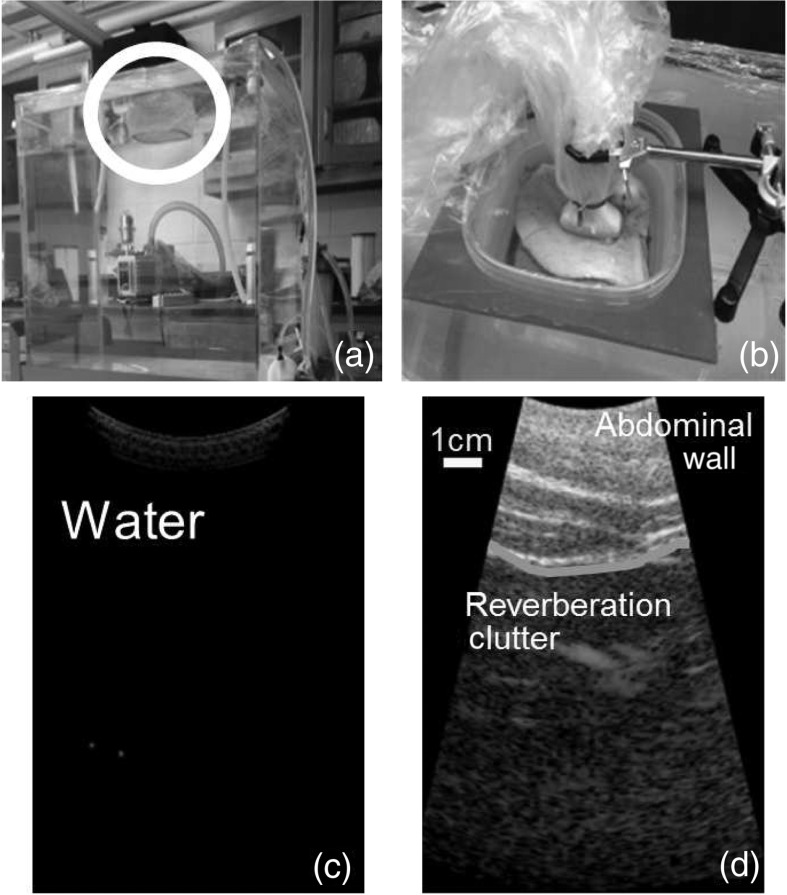
We compared simulated reverberation data to ex vivo measurements of reverberation. Ex vivo measurements were made using samples of porcine abdominal tissue obtained from other studies after sacrifice. We acquired eight measurements of ex vivo reverberation from six samples of porcine abdominal wall tissue. The ex vivo data were acquired by suspending tissue above a large water tank and imaging with a 50-Hz pulse repetition frequency (PRF). The low PRF ensured that reverberation measurements were not corrupted by reflections from the edges of the water tank. Signal that appears to arrive from below the tissue is considered energy that is time-delayed by multiple reflections and is analyzed as reverberation clutter. The experimental setup and acquired data resemble previous work by Hinkelman et al.16,17 used to measure wavefront distortion, but here we used a pulse–echo configuration.
The data were acquired with a custom 192 channel Cephasonics FirebirdTM ultrasound system and a 128 element curvilinear array (Cephasonics, Santa Clara, California). Data were acquired at 2.5 MHz with transmit and receive of 1.5 and 1, respectively. A picture of the water tank and examples of data with and without an abdominal wall sample of tissue are shown in Fig. 2. The relevant simulations were adapted to match the ex vivo measurement parameters.
Fig. 2.
The water tank used for measurements of reverberation is shown in (a), along with the Tegaderm bottomed container circled in white. A close up of the tissue container with an ex vivo porcine sample is shown in (b). An image with no tissue present is shown in (c), while the same image with tissue present is shown in (d). The image in (d) shows substantial energy returning from the water, which is actually acoustic energy from the tissue after scattering more than once.
2.5. Data Analysis
We evaluated the pseudononlinear simulation approach using three different measures. When possible, we tried to compare our simulated results to theoretical results in the literature. The primary theoretical expectation is the van Cittert–Zernike (VCZ) curve for multipath clutter described by Pinton et al.18 Because there are no other standard measures for multipath clutter, we used ex vivo measurements of reverberation and we quantified these outcomes with standard methods used to quantify B-mode image statistics—namely speckle SNR and speckle autocorrelation.19 The first measure—the VCZ curve—operated on the ultrasound channel data. The last two measures operated on the uncompressed B-mode data.
First, we compared our simulated data against theoretical expectations for the VCZ curve. The VCZ theorem provides an expectation of the spatial coherence of wavefronts scattered from incoherent media. For instance, the expectation for the VCZ curve of an incoherent object (i.e., a homogeneous diffuse scattering medium) insonified by a focused beam is a triangle function;20 whereas, others have shown that in the presence of multipath scattering the expectation of the VCZ curve is a delta function.18 The VCZ curve is calculated as
| (8) |
where is the data record for the ’th channel in the aperture, denotes the channel lag, and is the number of elements. We used Fisher’s -transform to convert the data to an approximately normal distribution to compute confidence intervals. To ensure stable VCZ behavior, we simulated 48 independent realizations of channel data for each scenario.
Next, we evaluated first- and second-order speckle statistics on the reverberant clutter. In this case, we compared the simulated statistics to ex vivo statistics. We determined the reverberation scatterer densities required to achieve fully developed speckle,19 and we examined the scatterer densities required to match the ex vivo results. The speckle SNR was calculated as
| (9) |
where and denote the mean and standard deviation of uniform regions of an uncompressed image, respectively. We quantified the lateral second-order speckle statistics using normalized autocorrelation
| (10) |
where denotes the uncompressed B-mode data with axial and lateral pixels. We only considered the behavior in the lateral dimension.
2.6. Computational Efficiency
To demonstrate the computational efficiency of the pseudononlinear approach, we conducted timing simulations using the full wave simulation tool developed by Pinton et al.10 and the pseudononlinear tool proposed here. The full wave code was written in C and compiled by Pinton at the University of North Carolina, while our implementation of the pseudononlinear tool used Field II with a MATLAB® wrapper to perform the additional computations previously described. We simulated the same size field of view for both the nonlinear and pseudononlinear methods. We also matched frequency, bandwidth, and other relevant imaging parameters. For the pseudononlinear simulations, three levels of reverberant field scattering densities were simulated: 0.05, 6, and 12 scatterers per resolution cell at the transmit focus. In all cases, the linear scattering field was simulated with 12 scatterers per resolution cell at the focus. For all methods, 12 independent realizations were timed.
3. Results
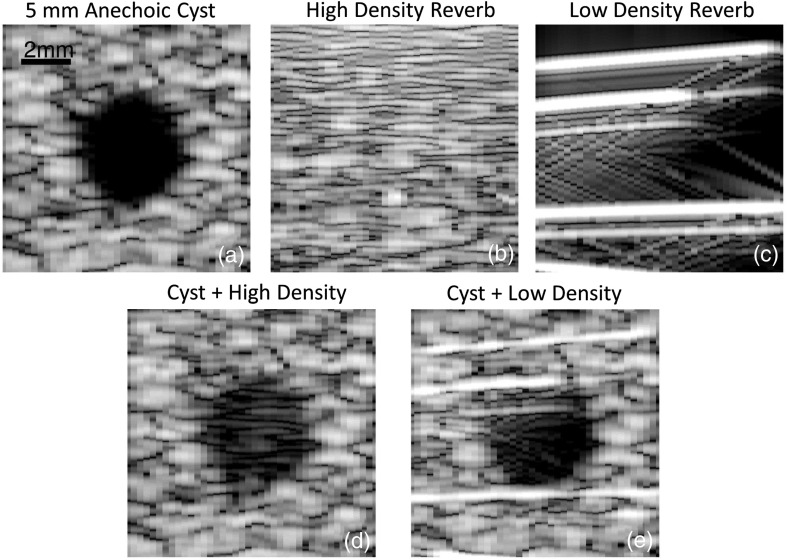
We start by highlighting example images and channel data of simulated reverberation clutter. Example image results from the simulation approach are shown in Fig. 3. A 5-mm anechoic cyst from only linear scattering is simulated and combined with two realizations of clutter. The clutter in Fig. 3 represents the signal generated by coherently summing the independently simulated reverberant scatterers as shown in Fig. 4 before beamforming, envelope detecting, and compressing the signal. The high-density realization of reverberation contains 16 scatterers per resolution cell, while the low-density reverberation contains 0.03 scatterers per resolution cell. Both cases produce realizations of clutter that mimic scenarios that can be found clinically. In the low-density example, the long lateral correlation length mimics the type of clutter often seen around parallel structures and in the extreme near-field. The high-density realization resembles the persistent haze that can cloud low-quality B-mode images.
Fig. 3.
Examples of simulated reverberation are shown individually and combined with a 5-mm anechoic cyst simulation. The cyst simulation is shown in (a). High and low scatterer density realizations of reverberation are shown in (b) and (c), respectively. Both cases are combined with the 5-mm lesion to produce simulations of a reverberation corrupted cyst, as shown in (d) and (e), respectively.
Fig. 4.
A simple example of the simulation process for a single reverberant scatterer is shown. In (a), a normal linear simulation of a shallow scatterer at is performed. Then, as described in our algorithm, the wavefield in (a) is time shifted to a later time as shown in (b). The time shift is determined by the locations randomly selected for and . The multiply scattered signal after beamforming delays are applied is shown in (c) along with a linearly scattered wavefront for comparison. The linearly scattered wave is flat after beamforming delays are applied but the multiply scattered wavefront remains curved.
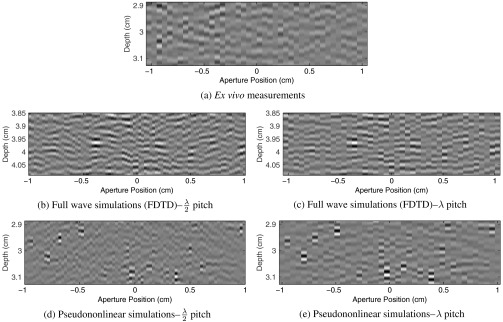
To invite comparison, we also show examples of channel data from the pseudononlinear simulation method and the two methods used for reference—namely, ex vivo data and simulation data from the finite difference method used for the timing comparison. The examples are shown in Fig. 5. The most striking qualitative difference between the various cases occurs when comparing the ex vivo data acquired with a large pitch () transducer to the fully sampled simulation data.21 In general, it is apparent that the reverberant echoes in all cases lead to channel data with short correlation lengths across the aperture.
Fig. 5.
Examples of the three different methods of generating or measuring reverberation clutter are shown. All three examples show delayed but unsummed channel data. In (a) channel data acquired below an ex vivo sample of porcine abdominal wall is shown. In (b) and (c) examples from the finite-difference time domain method using for the timing comparisons are shown. Finally, in (d) and (e) examples of the pseudononlinear simulations developed here are shown. Two matched realizations of the simulated data are shown because the simulations are conducted with a pitch corresponding to , but the ex vivo data have a pitch of . The full pitch in the simulations was accomplished by summing adjacent elements before applying delays.
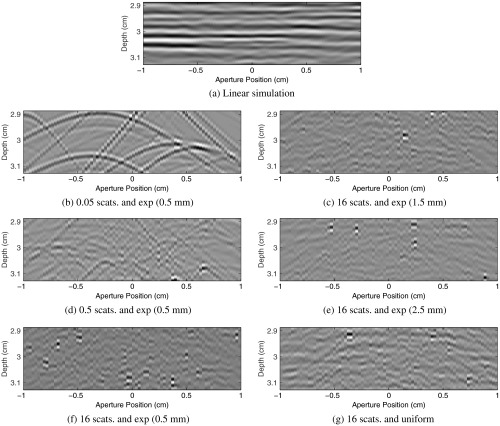
Examples of channel data are shown in Fig. 6. We show several levels of reverberation scattering density, and we include a linear scattering simulation for comparison. Later, we will show that the sampling distribution for the reverberation scatter position is important, so examples from four different distributions are shown. From these examples shown, only two cases [Figs. 6(d) and 6(f)] produce VCZ curves statistically indistinguishable from the expected delta function.
Fig. 6.
Examples of delayed channel data are shown for a linear simulation and six different example realizations of reverberation clutter generated from different scatterer densities and sampling distributions. Cases (d) and (f) are the only two that produce the VCZ delta function others have predicted analytically.18,20
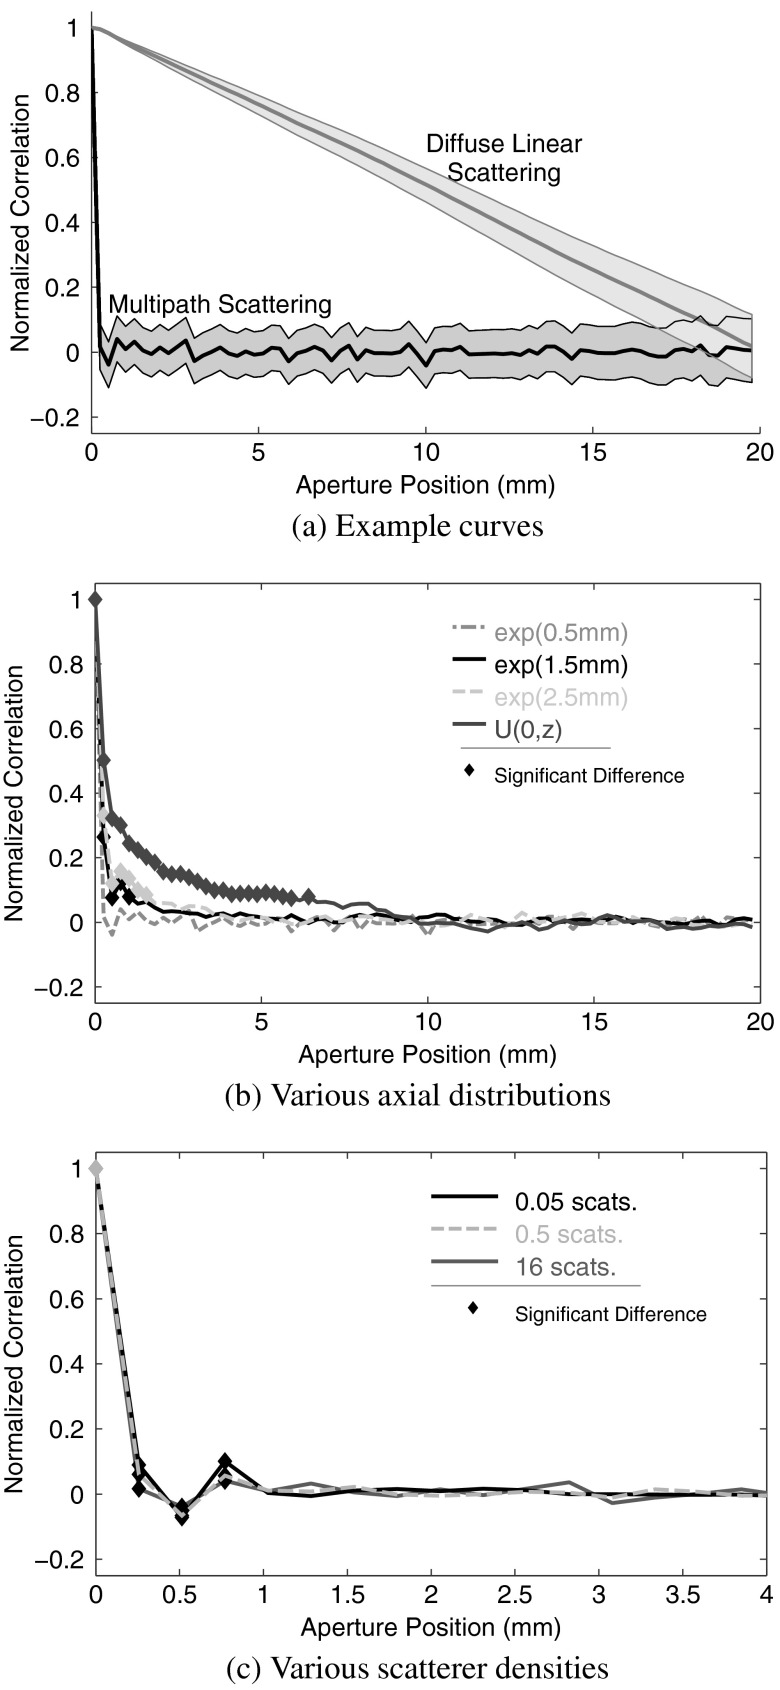
In Fig. 7, we demonstrate the VCZ curve for several scenarios corresponding to the examples shown in Fig. 6. First, we show the average VCZ curves for linear scattering and multipath scattering along with their respective 95% confidence intervals. For visual clarity, we exclude the confidence interval in the other plots, but the intervals are essentially the same for all the reverberation results. Second, we show the correlation curves generated from simulations using different sampling distributions for the axial position of and —all cases that varied the distribution used 16 scatterers per resolution cell. In the graphs, thick lines indicate portions of the VCZ curve that are statistically different from the expected delta function at the 5% level. The third plot shows the correlation curves for three different scatterer densities. Only the lowest density fails to achieve a curve that is statistically indistinct from the delta function. These results suggest the importance of shallow reverberation scattering sites over scatterer density in the development of completely decorrelated reverberation clutter.
Fig. 7.
The VCZ curve is shown for simulations of multipath scattering at the depth of the transmit focus (3 cm) for an of 1.5. Linear scattering is shown for comparison. In each case, the curves agree with the theory and observations from literature.18,20 The 95% confidence band is shown in (a). The width of the 95% confidence interval is nearly the same for the reverberation cases shown in (b) and (c). The VCZ curves in (b) show the results from several different axial sampling distributions with 16 scatterers per resolution cell. The VCZ curves in (c) show different scatterer densities for the exponential sampling distribution with mean of 5 mm. The thick portions of the curves denote statistical difference from the expected delta function.
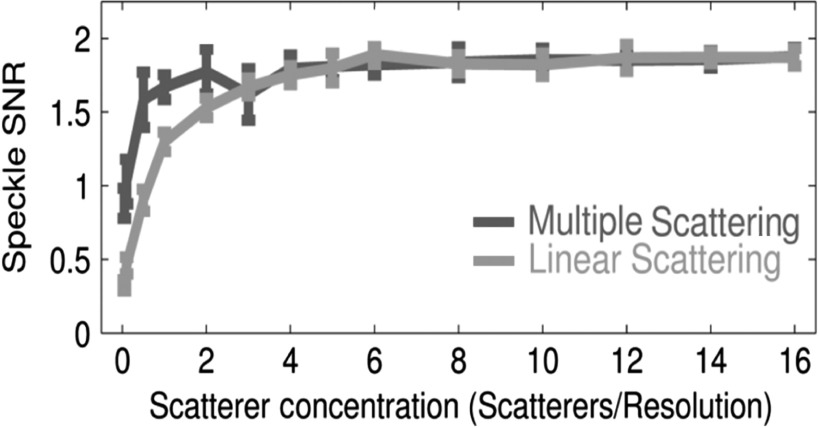
Speckle SNR is shown in Fig. 8 as a function of scatterer concentration for the reverberation simulation and comparison to the matched measures of linear scattering SNR. The figure shows that in both cases linear and multipath scattering converge to a speckle SNR of 1.91, which matches theoretical expectations.19 At low scatterer concentrations, the multipath SNR is much higher than that of linear scattering, which may be caused by the larger range of depths impacted by a reverberative scatterer compared to a linearly scattered wavefront that is appropriately delayed. An example of this is shown in Fig. 4(c).
Fig. 8.
Speckle SNR is demonstrated as a function of scatterer concentration for multipath and linear scattering. Both scenarios converge to 1.91 as expected, but multipath scattering converges more quickly. This is because the delayed multipath wavefronts can retain substantial curvature resulting in a longer depth of interaction. The increased depth of interaction increases the effective scatterer concentration for multiply scattered wavefronts.
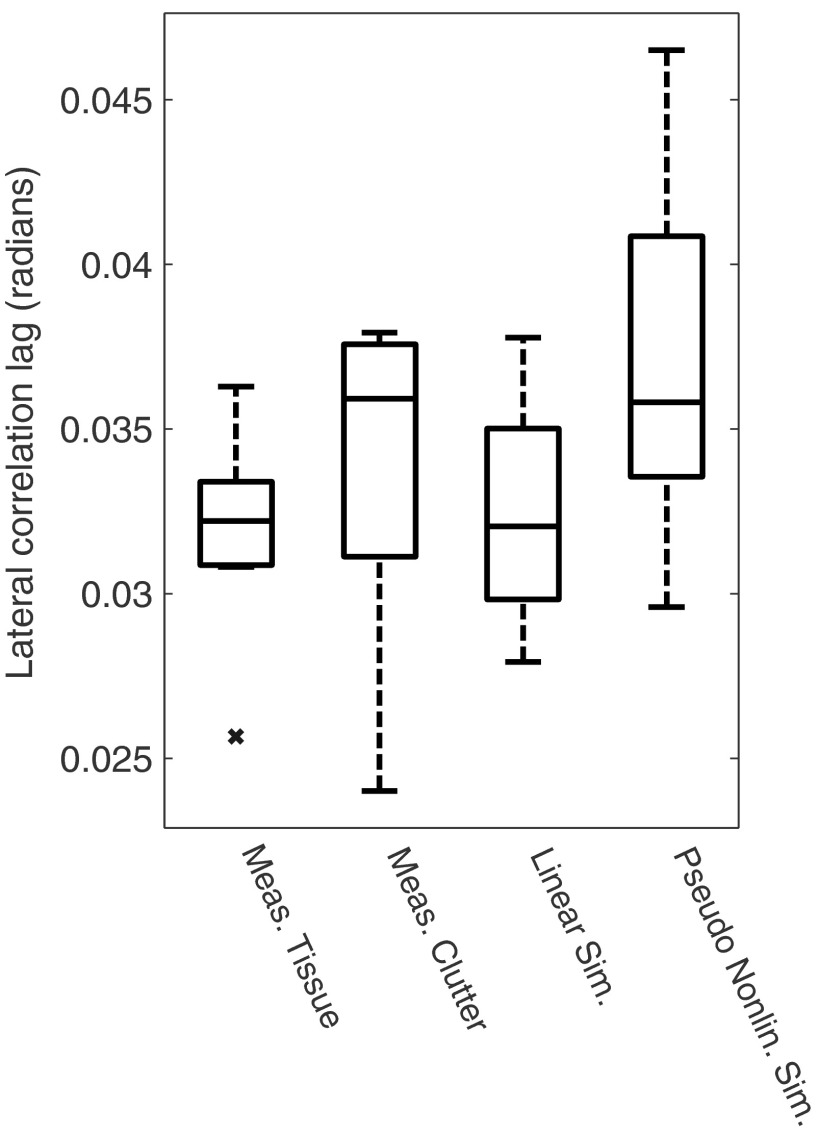
Next, we report results from the eight ex vivo abdominal tissue segments. We measured a speckle SNR of , with values between 1.00 to 1.60. From Fig. 8, these SNR values can be simulated using relatively low scatterer densities (about 2 scatterers/resolution cell) compared to what is required for fully developed first-order speckle in linear simulations. We also computed the lateral speckle autocorrelation full width half maximum in the ex vivo tissue and in the reverberant clutter present below the tissue. These results are shown in Fig. 9 along with matched simulations. The linear simulations use 12 scatterers per resolution cell and the pseudononlinear simulations use 6 scatterers per resolution cell. There is reasonable qualitative agreement between the ex vivo signal and the simulated signals. Finally, to support our claim that this method is an efficient way to generate a large number of simulated data sets, we show timing results in Table 2. The results demonstrate that the pseudononlinear method is faster than finite difference methods. This is not an unexpected result, but it does provide a quantitative context for the increase in efficiency. The pseudononlinear simulation’s run-time is proportionate with the number of simulated scatterers.
Fig. 9.
Boxplots are shown for the estimated lateral autocorrelation full width half maxima from linear data and multipath data generated using ex vivo samples and simulations. The linear simulated results contain 12 scatterers per resolution cell, while the pseudononlinear simulations contain 6 scatterers per resolution cell. The ex vivo tissue and linear data simulation results are comparable as are the ex vivo clutter and pseudononlinear simulation results. The variability in the clutter results is higher in both the water tank measurements and in the simulations.
Table 2.
Twelve simulation realizations were timed for each case in order to demonstrate the realized efficiency improvements with the pseudononlinear scheme. For the pseudononlinear simulations, the timing includes both the time for the linear scattering field and the reverberant scattering field.
| Method | Mean (s) | St. Dev. (s) |
|---|---|---|
| Full wave | 3830 | 190 |
| Pseudononlinear—0.05 scat. density | 52.8 | 2.4 |
| Pseudononlinear—6 scat. density | 283 | 2.8 |
| Pseudononlinear—12 scat. density | 511 | 4.2 |
4. Discussion
The proposed simulation method can be used to create bright, streaky reverberation that extends across the field of view and has been attributed to parallel abdominal tissue layers. The simulations can also be used to generate diffuse reverberation that presents as a distributed haze. Both of these limiting cases qualitatively mimic the degradation observed in many clinical images. It is relevant to note that both types of reverberation-based clutter can be formed from the same mechanism; the only difference being the number of echoes returning simultaneously. This may not reflect the actual underlying mechanism, but our results do support the hypothesis that all forms of clutter have the same root cause.
Our approach allows simulations of ultrasound B-mode and channel data that includes the impact of reverberation, while simultaneously maintaining our requirements of differentiating between linear and nonlinear scattering components. This is useful because it provides a means of precisely controlling the signal-to-clutter ratio, in addition to a true signal that can be used for training advanced beamforming methods, such as ADMIRE. In more realistic wave propagation simulation tools, identifying a true signal is problematic, because the modifications required to eliminate reverberation will also alter the linear signal returning from the region of interest.
Our approach is certainly ad hoc. Specifically, the approximations that allow us to simulate reverberation using linear tools are tenuous. However, we have validated our approach against theory and experimental measurements, and at the very least, we show that our approach provides data that is indistinguishable from our expectations of reverberation. So, while our simulations may not be mechanistically accurate, they are sufficient for our expressed purpose. Despite these caveats, we do use our results to hypothesize that “fully developed” clutter can be achieved with only a small number of reverberant sources and that the clutter encountered clinically is almost always fully developed.
Finally, in our description of the algorithm, we restrict ourselves to focused transmit sequences, because this still represents the majority of ultrasound image sequences. It is straightforward to extend these methods to modern full field insonification sequences. We anticipate that these extensions will be of interest to the broader ultrasound imaging community, because understanding and improving image quality in full field insonification is an active area of interest.
5. Conclusion
We have demonstrated a method for simulating qualitatively realistic reverberation. The proposed simulation is not as realistic as existing fully nonlinear simulation methods, but the approach provides complete control. We found that the multipath simulations match observed statistics of the VCZ curve for reverberation energy, and we have shown that we can simulate B-mode speckle statistics that match ex vivo data. Finally, by leveraging existing, efficient linear simulation tools, our pseudononlinear approach is faster than fully nonlinear simulations.
Acknowledgments
The authors thank the staff of the Vanderbilt University Advanced Computing Center for Research & Education computing resource including related support from National Institutes of Health (NIH) Grant No. S10RR026828. We thank NIH Grant No. R01EB020040 for supporting this work. We thank the Vanderbilt University School of Engineering’s summer support for undergraduate research. We thank the Vanderbilt Institute for Surgery and Engineering. Finally, we thank Kazuyuki Dei for various helpful comments.
Biographies
Brett Byram is an assistant professor at the Vanderbilt University School of Engineering. He received his BSE degree in biomedical engineering and mathematics from Vanderbilt University and his PhD in biomedical engineering from Duke University in 2011. He is affiliated with the Vanderbilt Institute in Surgery and Engineering (VISE) and the Vanderbilt University Institute of Imaging Science. He is a member of SPIE.
Jasmine Shu is an undergraduate pursuing her BSE degree in biomedical engineering with minors in engineering management and computer science. She is also affiliated with the VISE.
Disclosures
The authors report no conflicts of interest.
References
- 1.Dahl J. J., Sheth N. M., “Reverberation clutter from subcutaneous tissue layers: simulation and in vivo demonstrations,” Ultrasound Med. Biol. 40(4), 714–726 (2014). 10.1016/j.ultrasmedbio.2013.11.029 [DOI] [PMC free article] [PubMed] [Google Scholar]
- 2.Byram B., et al. , “A model and regularization scheme for ultrasonic beamforming clutter reduction,” IEEE Trans. Ultrason. Ferroelectr. Freq. Control 62(11), 1913–1927 (2015). 10.1109/TUFFC.2015.007004 [DOI] [PMC free article] [PubMed] [Google Scholar]
- 3.Pinton G. F., Trahey G. E., Dahl J. J., “Erratum: sources of image degradation in fundamental and harmonic ultrasound imaging: a nonlinear, full-wave, simulation study,” IEEE Trans. Ultrason. Ferroelectr. Freq. Control 58, 1272–1283 (2011). 10.1109/TUFFC.2011.1938 [DOI] [PMC free article] [PubMed] [Google Scholar]
- 4.Näsholm S. P., et al. , “Transmit beams adapted to reverberation noise suppression using dual-frequency SURF imaging,” IEEE Trans. Ultrason. Ferroelectr. Freq. Control 56, 2124–2133 (2009). 10.1109/TUFFC.2009.1295 [DOI] [PubMed] [Google Scholar]
- 5.Fink M., “Time reversal of ultrasonic fields. I. Basic principles,” IEEE Trans. Ultrason. Ferroelectr. Freq. Control 39, 555–566 (1992). 10.1109/58.156174 [DOI] [PubMed] [Google Scholar]
- 6.Rau J. M., et al. , “Methods for reverberation suppression utilizing dual frequency band imaging,” J. Acoust. Soc. Am. 134, 2313–2325 (2013). 10.1121/1.4817900 [DOI] [PubMed] [Google Scholar]
- 7.Camacho J., Parrilla M., Fritsch C., “Phase coherence imaging,” IEEE Trans. Ultrason. Ferroelectr. Freq. Control 56, 958–974 (2009). 10.1109/TUFFC.2009.1128 [DOI] [PubMed] [Google Scholar]
- 8.Lediju M. A., et al. , “Short-lag spatial coherence of backscattered echoes: imaging characteristics,” IEEE Trans. Ultrason. Ferroelect. Freq. Control 58, 1377–1388 (2011). 10.1109/TUFFC.2011.1957 [DOI] [PMC free article] [PubMed] [Google Scholar]
- 9.Byram B., Jakovljevic M., “Ultrasonic multipath and beamforming clutter reduction: a chirp model approach,” IEEE Trans. Ultrason. Ferroelectr. Freq. Control 61, 428–440 (2014). 10.1109/TUFFC.2014.2928 [DOI] [PMC free article] [PubMed] [Google Scholar]
- 10.Pinton G. F., et al. , “A heterogeneous nonlinear attenuating full-wave model of ultrasound,” IEEE Trans. Ultrason. Ferroelect. Freq. Control 56, 474–488 (2009). 10.1109/TUFFC.2009.1066 [DOI] [PMC free article] [PubMed] [Google Scholar]
- 11.Treeby B. E., et al. , “Modeling nonlinear ultrasound propagation in heterogeneous media with power law absorption using a k-space pseudospectral method,” J. Acoust. Soc. Am. 131, 4324–4336 (2012). 10.1121/1.4712021 [DOI] [PubMed] [Google Scholar]
- 12.Jensen J. A., “A model for the propagation and scattering of ultrasound in tissue,” J. Acoust. Soc. Am. 89, 182–190 (1991). 10.1121/1.400497 [DOI] [PubMed] [Google Scholar]
- 13.Jensen A., Svendsen N. B., “Calculation of pressure fields from arbitrarily,” IEEE Trans. Ultrason. Ferroelect. Freq. Control 39(2), 262–267 (1992). 10.1109/58.139123 [DOI] [PubMed] [Google Scholar]
- 14.Chen D., McGough R. J., “A 2D fast near-field method for calculating near-field pressures,” J. Acoust. Soc. Am. 124, 1526–1537 (2008). 10.1121/1.2950081 [DOI] [PMC free article] [PubMed] [Google Scholar]
- 15.Byram B., Shu J., “A pseudo non-linear method for fast simulations of ultrasonic reverberation,” Proc. SPIE 9790, 97900U (2016). 10.1117/12.2216839 [DOI] [Google Scholar]
- 16.Hinkelman L. M., et al. , “Measurement and correction of ultrasonic pulse distortion produced by the human breast,” J. Acoust. Soc. Am. 97(3), 1958–1969 (1995). 10.1121/1.412069 [DOI] [PubMed] [Google Scholar]
- 17.Hinkelman L. M., et al. , “The effect of abdominal wall morphology on ultrasonic pulse distortion. Part I. Measurements,” J. Acoust. Soc. Am. 104, 3635–3649 (1998). 10.1121/1.423946 [DOI] [PubMed] [Google Scholar]
- 18.Pinton G., Trahey G., Dahl J., “Spatial coherence in human tissue: implications for imaging and measurement,” IEEE Trans. Ultrason. Ferroelectr. Freq. Control 61, 1976–1987 (2014). 10.1109/TUFFC.2014.006362 [DOI] [PMC free article] [PubMed] [Google Scholar]
- 19.Wagner R. F., et al. , “Statistics of speckle in ultrasound B-scans,” IEEE Trans. Son. Ultrason. 30, 156–163 (1983). 10.1109/T-SU.1983.31404 [DOI] [Google Scholar]
- 20.Mallart R., Fink M., “The van Cittert–Zernike theorem in pulse echo measurements,” J. Acoust. Soc. Am. 90, 2718–2727 (1991). 10.1121/1.401867 [DOI] [Google Scholar]
- 21.Cobbold R. S. C., Foundations of Biomedical Ultrasound, Oxford University Press, New York: (2007). [Google Scholar]


