

Abstract
The electric characteristics of electric-double layer capacitors (EDLCs) are determined by their capacitance which is usually measured in the time domain from constant-current charging/discharging and cyclic voltammetry tests, and from the frequency domain using nonlinear least-squares fitting of spectral impedance. The time-voltage and current-voltage profiles from the first two techniques are commonly treated by assuming ideal SsC behavior in spite of the nonlinear response of the device, which in turn provides inaccurate values for its characteristic metrics. In this paper we revisit the calculation of capacitance, power and energy of EDLCs from the time domain constant-current step response and linear voltage waveform, under the assumption that the device behaves as an equivalent fractional-order circuit consisting of a resistance Rs in series with a constant phase element (CPE(Q, α), with Q being a pseudocapacitance and α a dispersion coefficient). In particular, we show with the derived (Rs, Q, α)-based expressions, that the corresponding nonlinear effects in voltage-time and current-voltage can be encompassed through nonlinear terms function of the coefficient α, which is not possible with the classical RsC model. We validate our formulae with the experimental measurements of different EDLCs.
The soaring demand for portable consumer electronic products and alternative energy vehicles created a unique market place for electrochemical energy storage in double-layer capacitors (EDLC). EDLCs are known for their high power density and high degree of reversibility, an energy density that bridges the gap between conventional electrostatic/electrolytic capacitors and rechargeable batteries, and long-term self-discharge, while remaining low cost and environmentally compatible devices1. Unlike batteries and fuel cells that harvest the energy stored in chemical bonds through faradic reactions, the outstanding properties of EDLCs are principally the result of the nanometer-sized electrostatic charge separation at the interface between the large surface area porous electrode material and the electrolyte2. However, Chmiola et al. showed that sub-nanometric pore size smaller than the solvated ions (such as carbide-derived carbon) can drastically increase the energy being stored in the device3, which challenges the widely accepted traditional charge storage mechanism4,5. It has also been proven that the hybrid configuration, in which the electrodes are made out of porous carbon material for surface-based double-layer capacitance combined with battery material for volume-based pseudocapacitance, is an effective approach to enhance the energy density of the storage devices6,7,8,9,10,11. Thus, because the energy and power performance of EDLCs are determined by the capacitance of its electrodes, and the ionic and electronic charge transports in the cell12, most of the research studies are focused on the rational design and optimization of nanostructured materials, electrolytes, and auxiliary components1,3,11,13,14.
Notwithstanding, in contrast with conventional capacitors that have been available for over a century, the measurement methods for determining the main metrics of EDLCs, i.e. capacitance, internal resistance, stored energy and power, are still not properly standardized15,16. As a result, we see that the estimation of such parameters from the commonly employed steady-state and impulse electroanalytical techniques15,16,17,18 are most of the time adapted from the formulae used for ideal capacitors. For instance, with galvanostatic charge/discharge, which consists of studying the transient voltage response of the device when a stepping current Icc is applied, the average capacitance is usually calculated from ref. 15:
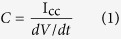 |
with dV/dt being the slope of the time-voltage curve. The capacitance is typically measured from the response of the device under different values of Icc. With cyclic voltammetry (CV) experiment, the current is recorded vs. a linearly changing cell voltage between the two terminals of the device, giving qualitative and quantitative information about the electrode processes. The integral capacitance C of the target electrode can be calculated from the CV curves as18:
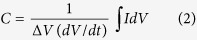 |
with the numerical integration of the current being over the half-cycle potential window (ΔV), and dV/dt is the voltage scan rate15. Since C depends on the sweep rates in the CV test, the device is usually charged and discharged at different rates and thus at different powers19. The stored energy is estimated from the dc capacitance and the voltage window as E = CΔV2/2, and the power from the ohmic drop as p = V2/4Rs, by assuming an ideal capacitive behavior11.
However, from the very specific name of EDLC devices (lossy capacitors, leaking capacitors, or pseudocapacitive devices), it is actually misleading to assume their ideality which is what is being done when using equations 1 and 2. In the frequency domain, EDLC devices exhibit constant phase or fractional power characteristics different from the response of ideal capacitors20. In Fig. 1(a) we show the Nyquist plot representation of impedance spectroscopy (EIS) for two EDLCs subject of this study, i.e. a Cooper Bussmann PowerStor supercapacitor (denoted PS, rated as 2.7 V with 3 F nominal capacitance and 0.060 Ω maximum equivalent series resistance (ESR) at 1 kHz) and a NEC/TOKIN supercapacitor (denoted NEC, rated as 5.5 V with 1 F nominal capacitance and 65 Ω maximum ESR at 1 kHz). The impedance response of the PS device is typical for an equivalent series resistance (Rs) in series with a constant-phase element (CPE) behavior21,22,23,24,25,26, as it consists of a straight line of slope 13.17 Ω/Ω (i.e. 85.6°) with Rs = 40 mΩ (Im(Z) = 0) at 5.3 kHz. Complex nonlinear least-squares fitting of the impedance response using the model Rs–CPE (ZCPE = 1/Qsα in which the pseudocapacitance Q is in units of F sα−1, s = jω, and the dispersion coefficient α can take on values between 1, for an element acting as an ideal capacitor, to 0, for a resistor24) resulted in (Rs, Q, α) = (50 mΩ, 2.04 F sα−1, 0.95). Although α is very close to one, the device cannot be considered ideal and energy dissipation is expected. The impedance response of the NEC EDLC, on the other hand, shows a nonlinear behavior with more deviation from ideality, including a depressed semi-circle of 3.44 Ω diameter representing, a 43.0°-inclined pseudo-Warburg region (824 Hz to 28 mHz), and a quasi-vertical line of 85.4° inclination vs. the real axis in the low frequency region 28 mHz to 5 mHz. The Rs-CPE fitting plot to the experimental data from 824 Hz to 5 mHz, and its parameters are shown in Fig. 1, although a double-dispersion model with two CPEs would be a better fit11. The dispersion coefficient α is found to be 0.70, further away from ideal capacitor. The Bode diagrams, i.e. phase angle shift of impedance vs. frequency, of both PS and NEC EDLCs are plotted in Fig. 1(b), and from which one can deduct more detail on the electric behaviors of the devices. The capacitive behavior manifests itself only close to the dc limit where the phase angle vs. log(|f|) tends to −90°. The PS EDLC shows a close-to-ideal capacitance over a wider frequency range. In an intermediary frequency region that spans a few decades, the devices show a tendency towards a resistive behavior with loss of capacitance, as the porous electrode material is not allowed to be fully charged.
Figure 1.

(a) Nyquist representation of impedance and (b) Bode diagrams for the NEC and PS EDLCs. Plots and parameters using complex nonlinear least-squares fitting to Rs–CPE(Q, α) model are also shown.
Now giving that in the frequency domain EDLCs exhibit constant phase behavior, it is incorrect to revert to RsC modeling for the analysis of their behavior in the time domain20. Furthermore, although EIS is a powerful characterization tool to evaluate the equivalent electric circuits of dynamic processes, frequency response analysis remains quite expensive from hardware and software viewpoints. In this study, we show how to accurately characterize an EDLC device by extracting its equivalent circuit element parameters from the time domain constant-current charge/discharge responses and cyclic voltammetry using fractional-order calculus. We adopted the Rs−CPE(Q, α) model which offers one extra degree of freedom when compared to the commonly used RsC model to better accommodate the response of the device. Our results on the time-domain responses of EDLCs have the merit to (i) provide additional and inexpensive alternatives to the standard EIS technique, while (ii) redefining the metrics of these devices (capacitance, power and energy) that are commonly and wrongly adopted from RsC models.
Constant-Current Charging/Discharging
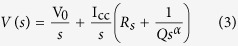
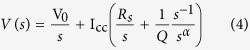
When the impedance Z(s) = Rs + 1/Qsα of an equivalent electric model Rs–CPE(Q, α) is excited by an input current step of amplitude Icc > 0 (note that the same analysis below can be applied for a constant-current discharging step), the output voltage is given by:
 |
where V0 is the initial voltage. V(s) can be re-arranged to:
 |
We now apply the inverse Laplace transform to equation 4 using the formula27:
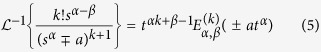 |
where E is the Mittag-Leffler function. Noting that k = 0, a = 0, and β = α + 1, this yields the time domain equation:
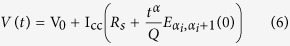 |
in which  , which reduces to the voltage-time characteristics of an Rs–CPE equivalent model as:
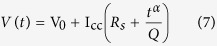 |
We verify that for an ideal capacitor (i.e. α = 1 and Q = C in Farads) we have the linear relationship:
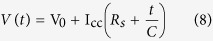 |
which leads to the capacitance expression in equation 1 by setting Rs = 0. Note that an effective capacitance28 in units of Farad can be defined for an EDLC by equating equations 7 and 8 giving:
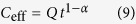 |
Figure 2(a) and (d) show in solid lines the fifth cycles of voltage-time response (the first few cycles are usually disregarded because of undefined initial conditions) collected at different dc charge/discharge currents for the PS and NEC EDLCs, respectively. All plots are practically symmetric showing first a steep increase of voltage due to dissipation in the equivalent series resistance Rs, followed by a second quasi-linear stage corresponding to the charging of the pseudocapacitive material of the device. The discharge curves are also nonlinear by exhibiting first a quick voltage drop that increases with the increase of current rate, followed by a nonlinear capacitive region until zero voltage. These nonlinearities in voltage-time curves are characteristic features of the electric behavior of porous electrode capacitors29, that can not be properly captured by an RsC model. The deviation from ideality can also be demonstrated from the discrete Fourier transform analysis of harmonics obtained from the decomposition of current waveforms, as shown in Fig. S1. In particular, for NEC (see Fig. S1(c) and (d) showing the spectral amplitude of measured charging and discharging current signals respectively), the non-fundamental components extending to a few tens of mHz contribute with relatively important weights (vs. the magnitude of the fundamental harmonic) to the overall signals. This is most noticeable with the increase of current charge/discharge rates (see frequency response from ±25 mA waveforms). The effect of these frequency components of the power system harmonics can be demonstrated in connection with the Nyquist plot of impedance shown in Fig. 1(a). Around the knee frequency of ca. 28 mHz the impedance of NEC changes from the pseudo-Warburg impedance ((Rs, Q, α) = (8.06 Ω, 0.15 F sα−1, 0.47) over the frequency range 28 mHz–824 Hz) to a close-to-ideal capacitive behavior ((Rs, Q, α) = (16.6 Ω, 0.56 F sα−1, 0.93) over the frequency range 5 mHz–28 mHz). This knee frequency is one of the harmonics resulting from the Fourier transform analysis shown in Fig. S1(c) and (d), which means that the electric characteristics of the device extracted from galvanostatic charge/discharge measurements are averaged integral values over the frequency domain that take into account the contributions of both capacitive and pseudo-Warburg regions. When the knee frequency is within the interval set for fitting in the Nyquist plot, we clearly see that both Q and α decrease consequently, e.g. (Rs, Q, α) is equal to (16.6 Ω, 0.56 F sα−1, 0.93) over the frequency range 5 mHz–28 mHz, (9.62 Ω, 0.29 F sα−1, 0.74) over the range 5 mHz–824 Hz, and (8.18 Ω, 0.25 F sα−1, 0.70) over the range 5 mHz–3 MHz (note that the device is not well fitted with the model of a series resistance associated with a CPE over extended ranges of frequency). This effect is not taken into account when the simple RsC model is used to analyze the voltage-time profiles of charging/discharging EDLCs.
Figure 2.

Constant-current time-voltage (a) and (d), time-energy (b) and (e), and power-energy (c) and (f) profiles of PS and NEC EDLCs respectively. The solid lines represent the experimental data, whereas the dash-dot lines and the dashed lines represent the fitted data using the RsC model and the Rs–CPE(Q, α) model, respectively.
We show in Fig. 2(a) and (d) using dash-dot lines the fitted data with equation 8 (the average capacitance values are shown in the second column of Tables S1 and S2 for PS and NEC EDLCs respectively, which were calculated from the slopes of the charge and discharge time-voltage curves using equation 1 and in which it is implicitly assumed that Rs = 0). The deviation from the experimental data is more pronounced for the NEC device characterized by a lower dispersion coefficient. In dashed lines we show the time-voltage plots of charging and discharging using equation 7, in which the parameters Rs, Q, and α (summarized in Tables S1 and S2) were extracted from the experimental data using nonlinear least-squares fitting with optimization search for global minimum. It is clear that the Rs–CPE (Q, α)-modeled data for both PS and NEC are in excellent agreement with the nonlinear behavior of the experimental charging/discharging of the devices. In contrast with the RsC model, the Rs–CPE model takes into account the nonlinear behavior of an EDLC through the dispersion coefficient α which cannot be one.
From equation 7, we derive the following expressions for the power of an EDLC:
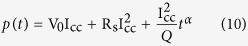 |
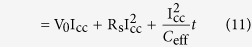 |
The energy is therefore given by:
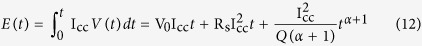 |
 |
For V0 = 0, Rs = 0 and α = 1, we verify that E(t) = q2/2C = CV2/2 (q is the stored charge in Coulomb). The accumulated energy under different constant-current charge/discharge rates for both PS and NEC devices are plotted in Fig. 2(b) and (e), respectively. The experimental and modeled data using RsC and Rs–CPE are shown in solid, dash-dot, and dashed lines, respectively. In contrast with the RsC-modeled data, the Rs–CPE model shows excellent agreement with the experiment as a consequence of the proper calculation of the effective capacitance of the devices given by Ceff = Qt1−α, and by taking into account their dispersion coefficients (see computed values in Tables S1 and S2). In particular, the dependence of maximum power vs. maximum energy (i.e. Ragone plot, using the expression of Ceff with t = tss the time needed for full charge (or full discharge)) which is plotted in Fig. 2(c) and (d) for PS and NEC respectively, shows a much better agreement with the measurements for the Rs–CPE-model when compared to the commonly used RsC model.
Cyclic Voltammetry
In this section we revisit the calculation of the metrics of an EDLC from its charging with constant positive dV/dt. The same procedure can be followed for discharging to simulate the EDLC dynamics in CV experiment. Consider first the general case of an applied voltage v(t) across an Rs–CPE(Q, α) model. The voltage v(t) can be written as:
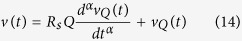 |
in which vQ(t) is the voltage across the pseudocapacitance Q. Applying the Laplace transform yields:
 |
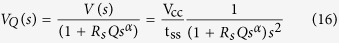
Thus, for v(t) = Vcct/tss;  (Vcc is the steady-state upper limit of the linear voltage scan that will be reached at time t = tss), we obtain:
 |
With a = 1/RsQ, we can write:
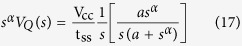 |
Using the inverse Laplace transform we get:
 |
where E is again the Mittag-Leffler function. Now if we define a = bα (i.e. b = (1/RsQ)1/α), then for significantly small Rs such that b → ∞, it is possible to write the following expansion30:
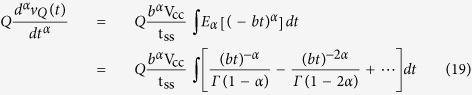 |
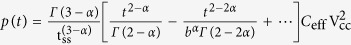
where Γ( · ) is Euler’s gamma function. The left-hand side of equation 19 is equal to the current i(t) = dq(t)/dt, which after integration with respect to time must be equal to the charge on a CPE alone if Rs → 0 (i.e. b → ∞):
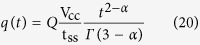 |
Note that at steady-state the charge  , where Ceff is an effective capacitance in units of Farad defined as:
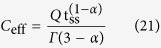 |
Then the current can be found to be:
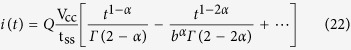 |
 |
We verify that for an ideal capacitor, i.e. Rs = 0, α = 1 and Q = C, the current-time relationship given by equation 23 reduces to i(t) = CVcc/tss. It is worth mentioning here that the effective capacitance is a quantity that depends on the way the EDLC device has been excited (compare equations 9 and 21) and eventually on the electric model being used.
In Fig. 3(a) and (d), we show in solid lines the fifth half-cycles of current-voltage responses measured at different positive voltage scan rates (i.e. 2, 5, 10, 20, and 50 mV s−1) for PS and NEC EDLCs respectively. The voltammograms are close, but not ideally rectangular in shape, which is characteristic of non-ideal capacitors (for pure voltage-independent capacitive behavior, the current is linear with the voltage sweep rate and the voltammograms are ideal rectangles with mirror-image symmetry with respect to the zero current axis31). The increase of distortion, i.e. increase of positive slope of voltammetric current responses, is more noticeable for NEC which exhibits further deviation from ideality (Fig. 3(d)), and increases with the increase of voltage sweep rate for both devices due to the porous nature of the electrode material and the manifestation of more resistive behavior31. This is also due, as discussed in the previous section, to the composition of Fourier spectral response of the used voltage waveforms as shown in Fig. S2. Specifically for NEC (see Fig. S2(b)), it is clear that the 50 mV/s excitation has components below and above the knee frequency of 28 mHz, which means that the voltammetric response is a weighted average of low frequency capacitive behavior and medium to high frequency pseudo-Warburg behavior.
Figure 3.

Current-voltage (a) and (d), time-energy (b) and (e), and power-energy (c) and (f) profiles at linear voltage scans for PS and NEC EDLCs respectively. The solid lines represent the experimental data, and the dashed lines represent the fitted data using Rs–CPE(Q, α) model.
In the same figures (i.e. Fig. 3(a) and (d)), we show using dashed lines the current-voltage relationship expressed by equation 22 using four terms (with v(t) = Vcct/tss;  ). The (Rs, Q, α) fitting parameters are summarized in Tables S3 and S4 for NEC and PS, respectively. It is clear that our model successfully accounts for the nonlinear behavior of the current which was not possible with the classical RsC circuit models based on the simple assumption that i = CdV/dt31,32,33. Other authors have simulated the CV measurements of EDLCs using the classical or modified Poisson–Nernst–Planck (PNP) models12,34,35, but in general these microscopic models still suffer from several limitations and assumptions for their validity, such as point charges instead of finite size of ions, or a maximum allowed ion concentration, or a maximum allowed potential19. Although in many recent papers attempts have been made to account for such limitations, the use of PNP-based models to characterize EDLCs is unlikely in practical situations. In contrast, our Rs–CPE -based model (equation 21) represents a simple holistic description of the device that encompasses the nonlinear behavior of the current-voltage profiles obtained from CV tests. The average capacitances calculated from equations 2 and 21 under the different scan rates are shown Tables S3 and S4 for PS and NEC EDLCs respectively. The RsC capacitance is overestimated by ca. 2% versus the one estimated from the Rs–CPE model for PS, which exhibits a close-to-ideal capacitive behavior, whereas it is as high as 10% in average for NEC EDLC. This discrepancy is not acceptable for practical design applications, which why our model is recommended instead.
From equation 22, we derive the power of an EDLC as:
 |
and the stored energy as:
 |
At steady-state, this energy is equal to:
 |
which, if Rs → 0, reduces to  . The latter gives
  for α = 1 as expected. Assuming two terms only in equation 26 we obtain
 |
from which it is clear that the existence of Rs reduces the amount of energy stored in an EDLC. To minimize this effect, it is required to minimize the ratio RsCeff/tss, which is equivalent to choosing a charging time tss such that:
 |
In Fig. 3(b) and (c) we show respectively the energy-time profiles at 2, 5, …, 50 mV/s scan rates, and the Ragone plot for the PS device. Our derived expressions are in excellent agreement with the experiment. The deviation from the measurements is more noticeable for the NEC device as shown in Fig. 3(e) and (f), but still the Rs–CPE model is more reliable than the commonly used RsC model.
Conclusions
In summary, we showed from the analysis of harmonics resulting from the fast Fourier transform of constant-current charge/discharge of an EDLC, and its frequency-dependent impedance that the time-voltage relationship can not be analyzed with the assumption of ideal RsC behavior as is commonly done. Instead, using the fractional-order Rs–CPE (Q, α) model, we showed excellent agreement with the experimental time-voltage responses using the derived equation V(t) = Icc(Rs + tα/Q). The term tα accounts for the nonlinear current evolution that the standard RsC model, giving by the expression V(t) = V0 + Icc(Rs + t/C), fails to simulate. An effective capacitance computed as Ceff = Qt1−α in proper units of Farad is proposed, and from which the power (equation 11) and energy (equation 13) characteristics of the device can be calculated. In particular we showed that the commonly used formula for the stored energy, i.e. q2/2C, has to be replaced by q2/[Ceff(α + 1)]. A recapitulation of the different expressions for calculating the metrics of an EDLC from galvanostatic charging using Rs-CPE model are compared to those using RsC in Table 1.
Table 1. Recapitulative table of the different metrics of EDLC computed from galvanostatic charge and linear voltage sweep using the standard R s C model and the R s –CPE model.
| RcC model (with Rs = 0 and V0 = 0) | Rs–CPE model | ||
|---|---|---|---|
| Galvanostatic charge (Icc > 0) | Voltage/V | V(t) = V0 + Icc(Rs + t/C) = Icct/C | V(t) = V0 + Icc(Rs + tα/Q) |
| Current/A | i = Icc | i = Icc | |
| Capacitance/F | C = Icctss/Vcc |
 * *
|
|
| Power/W |  |
 |
|
| Energy/J |  |
 |
|
| Cyclic voltammetry (forward voltage sweep) | Voltage/V | Vcct/tss | Vcct/tss |
| Current/A | i = CVcc/tss |
 ** **
|
|
| Capacitance/F |  |
 |
|
| Power/W |  |
 ** **
|
|
| Energy/J |  |
 ** **
|
*Q = Icctα/Vcc in F sα−1.
**b = (1/RsQ)1/α.
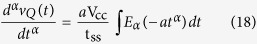
In the same way, from the expression of current through a fractional-order capacitance given by i(t) = Qdαv(t)/dtα instead of i(t) = C dv(t)/dt which is valid for ideal capacitance only, we derived the time-current relationship of an EDLC subjected to charging by linear voltage sweep (equation 23). Subsequently, we showed excellent agreement with the experiment of the voltage-current, time-energy, and power-energy profiles. The time domain expressions for CV profiles derived from the commonly used RsC model and the ones we propose here using the Rs–CPE are also summarized in Table 1.
Methods
Two commercial supercapacitors were selected for this study: a Cooper Bussmann PowerStor (denoted PS) carbon aerogel supercapacitor (part # HV0820-2R7305-R, rated as 2.7 V with 3 F nominal capacitance and 0.060 Ω maximum equivalent series resistance (ESR) at 1 kHz) and a NEC/TOKIN (denoted NEC) supercapacitor (part #FGR0H105ZF, rated as 5.5 V with 1 F nominal capacitance and 65 Ω maximum ESR at 1 kHz). All measurements were carried out by using a BioLogic VSP-300 electrochemical workstation at room temperature.
Additional Information
How to cite this article: Allagui, A. et al. Reevaluation of Performance of Electric Double-layer Capacitors from Constant-current Charge/Discharge and Cyclic Voltammetry. Sci. Rep. 6, 38568; doi: 10.1038/srep38568 (2016).
Publisher's note: Springer Nature remains neutral with regard to jurisdictional claims in published maps and institutional affiliations.
Supplementary Material
Acknowledgments
This work was supported by the University of Sharjah (Project #1602040634-P).
Footnotes
Author Contributions A.S.E., T.J.F. and A.A. derived the mathematical expressions. A.A. carried out the measurements. A.A. and A.S.E. analyzed the results and wrote the the manuscript. All authors reviewed the manuscript and provided feedback.
References
- Kötz R. & Carlen M. Principles and applications of electrochemical capacitors. Electrochim. Acta 45, 2483–2498 (2000). [Google Scholar]
- Simon P. & Gogotsi Y. Charge storage mechanism in nanoporous carbons and its consequence for electrical double layer capacitors. Philos. Trans. R. Soc. London, Ser. A 368, 3457–3467 (2010). [DOI] [PubMed] [Google Scholar]
- Chmiola J. et al. Anomalous increase in carbon capacitance at pore sizes less than 1 nanometer. Science 313, 1760–1763 (2006). [DOI] [PubMed] [Google Scholar]
- Skinner B., Chen T., Loth M. & Shklovskii B. Theory of volumetric capacitance of an electric double-layer supercapacitor. Phys. Rev. E 83, 056102 (2011). [DOI] [PubMed] [Google Scholar]
- Skinner B., Fogler M. & Shklovskii B. Model of large volumetric capacitance in graphene supercapacitors based on ion clustering. Phys. Rev. B 84, 235133 (2011). [Google Scholar]
- Wu Z.-S. et al. High-Energy MnO2 Nanowire/Graphene and Graphene Asymmetric Electrochemical Capacitors. ACS Nano 4, 5835–5842 (2010). [DOI] [PubMed] [Google Scholar]
- Wu Z. et al. Electrostatic Induced Stretch Growth of Homogeneous β-Ni(OH)2 on Graphene with Enhanced High-Rate Cycling for Supercapacitors. Sci. Rep. 4 (2014). [DOI] [PMC free article] [PubMed] [Google Scholar]
- Allagui A., Salameh T. & Alawadhi H. One-pot synthesis of composite NiO/graphitic carbon flakes with contact glow discharge electrolysis for electrochemical supercapacitors. Int. J. Energy Res. 39, 1689–1697 (2015). [Google Scholar]
- Wang R. & Yan X. Superior asymmetric supercapacitor based on Ni-Co oxide nanosheets and carbon nanorods. Sci. Rep. 4 (2014). [DOI] [PMC free article] [PubMed] [Google Scholar]
- Li P. et al. Core-double-shell, carbon nanotube@polypyrrole@MnO2 sponge as freestanding, compressible supercapacitor electrode. ACS Appl. Mater. Interfaces 6, 5228–5234 (2014). [DOI] [PubMed] [Google Scholar]
- Ramya R., Sivasubramanian R. & Sangaranarayanan M. Conducting polymers-based electrochemical supercapacitors—progress and prospects. Electrochim. Acta 101, 109–129 (2013). [Google Scholar]
- Biesheuvel P., Fu Y. & Bazant M. Z. Diffuse charge and faradaic reactions in porous electrodes. Phys. Rev. E 83, 061507 (2011). [DOI] [PubMed] [Google Scholar]
- Rudge A., Davey J., Raistrick I., Gottesfeld S. & Ferraris J. P. Conducting polymers as active materials in electrochemical capacitors. J. Power Sources 47, 89–107 (1994). [Google Scholar]
- Barisci J., Wallace G., MacFarlane D. & Baughman R. Investigation of ionic liquids as electrolytes for carbon nanotube electrodes. Electrochem. Commun. 6, 22–27 (2004). [Google Scholar]
- Stoller M. D. & Ruoff R. S. Best practice methods for determining an electrode material’s performance for ultracapacitors. Energy Environ. Sci. 3, 1294–1301 (2010). [Google Scholar]
- Zhang S. & Pan N. Supercapacitors performance evaluation. Adv. Energy Mater. 5, 1401401 (2015). [Google Scholar]
- Kierzek K., Frackowiak E., Lota G., Gryglewicz G. & Machnikowski J. Electrochemical capacitors based on highly porous carbons prepared by koh activation. Electrochim. Acta 49, 515–523 (2004). [Google Scholar]
- Arulepp M. et al. Influence of the solvent properties on the characteristics of a double layer capacitor. J. Power Sources 133, 320–328 (2004). [Google Scholar]
- Wang H. & Pilon L. Physical interpretation of cyclic voltammetry for measuring electric double layer capacitances. Electrochim. Acta 64, 130–139 (2012). [Google Scholar]
- Sadkowski A. Time domain responses of constant phase electrodes. Electrochim. Acta 38, 2051–2054 (1993). [Google Scholar]
- Halsey T. C. Frequency dependence of the double-layer impedance at a rough surface. Phys. Rev. A 35, 3512 (1987). [DOI] [PubMed] [Google Scholar]
- Zoltowski P. On the electrical capacitance of interfaces exhibiting constant phase element behaviour. J. Electroanal. Chem. 443, 149–154 (1998). [Google Scholar]
- Freeborn T. J., Maundy B. & Elwakil A. S. Fractional-order models of supercapacitors, batteries and fuel cells: a survey. Mater. Renewable Sustainable Energy 4, 1–7 (2015). [Google Scholar]
- Montella C. LSV/CV modelling of electrochemical reactions with interfacial CPE behaviour, using the generalised Mittag–Leffler function. J. Electroanal. Chem. 667, 38–47 (2012). [Google Scholar]
- Allagui A., Elwakil A. S., Maundy B. J. & Freeborn T. J. Spectral capacitance of series and parallel combinations of supercapacitors. ChemElectroChem 3, 1429–1436 (2016). [Google Scholar]
- Fouda M., Elwakil A., Radwan A. & Allagui A. Power and energy analysis of fractional-order electrical energy storage devices. Energy 111, 785–792 (2016). [Google Scholar]
- Podlubny I. Fractional Differential Equations: An Introduction to Fractional Derivatives, Fractional Differential Equations, to Methods of Their Solution and Some of Their Applications. Mathematics in Science and Engineering (Elsevier Science, 1998). [Google Scholar]
- Orazem M. E. et al. Dielectric properties of materials showing constant-phase-element (CPE) impedance response. J. Electrochem. Soc. 160, C215–C225 (2013). [Google Scholar]
- Conway B. & Pell W. Power limitations of supercapacitor operation associated with resistance and capacitance distribution in porous electrode devices. J. Power Sources 105, 169–81 (2002). [Google Scholar]
- Gorenflo R. & Mainardi F. Fractional calculus: Integral and differential equations of fractional order. arXiv:0805.3823 (2008).
- Pell W. & Conway B. Voltammetry at a de levie brush electrode as a model for electrochemical supercapacitor behaviour. J. Electroanal. Chem. 500, 121–133 (2001). [Google Scholar]
- Lajnef W., Vinassa J.-M., Briat O., Azzopardi S. & Woirgard E. Characterization methods and modelling of ultracapacitors for use as peak power sources. J. Power Sources 168, 553–560 (2007). [Google Scholar]
- Fabregat-Santiago F., Mora-Seró I., Garcia-Belmonte G. & Bisquert J. Cyclic voltammetry studies of nanoporous semiconductors. capacitive and reactive properties of nanocrystalline TiO2 electrodes in aqueous electrolyte. J. Phys. Chem. B 107, 758–768 (2003). [Google Scholar]
- Bazant M. Z., Thornton K. & Ajdari A. Diffuse-charge dynamics in electrochemical systems. Phys. Rev. E 70, 021506 (2004). [DOI] [PubMed] [Google Scholar]
- Biesheuvel P. & Bazant M. Nonlinear dynamics of capacitive charging and desalination by porous electrodes. Phys. Rev. E 81, 031502 (2010). [DOI] [PubMed] [Google Scholar]
Associated Data
This section collects any data citations, data availability statements, or supplementary materials included in this article.