

Abstract
Antioxidant peptide enriched casein hydrolysate (AO–CH) are receiving increasing attention due to their potential as functional ingredient. Encapsulation of AO–CH using maltodextrin–gum arabic (MD/GA) as wall material could represent an attractive approach to overcome the problems related to their direct application. Encapsulation parameter were optimized using different ratio of core to coat and proportion of coating material (10:0, 8:2, 6:4) under varying pH (2–8) for encapsulation efficiency (EE).The preparation P3 resulted in maximum EE (87%) using core to coat ratio 1:20, at pH 6.0 with 8:2 MD/GA ratio. The encapsulated preparation showed reduced bitterness (p < 0.05) compared to the casein hydrolysate together with maximum retention of antioxidant activity (93%). Further, the narrow range of particle size, indicates their better stability and represents a promising food additive for incorporation in food.
Keywords: Antioxidant peptides, Bitter taste, Casein hydrolysate, Gum arabic, Maltodextrin, Microencapsulation
Introduction
In recent past, there has been a lot of interest in functional foods and nutraceuticals. Bioactive peptides derived from milk proteins offer a new means to promote health. These peptides can be released by enzymatic hydrolysis during gastrointestinal digestion, fermentation or proteolysis by food-grade enzymes derived from microorganisms, animals or plants (Phelan et al. 2009). The bioactive peptides range in size from 2 to 20 amino acid residues and exhibit different activities, such as antimicrobial, antioxidant, antithrombotic, antihypertensive, immunomodulatory, opioid, and antiproliferative activities (Meisel and Fitzgerald 2003; Lopez-Exposito et al. 2007). The potential of these bioactive peptides to reduce the risk of chronic diseases and to promote human health has aroused increasing scientific and commercial interest over the past decade (Hartmann and Meisel 2007). Recently, there has been a particular focus on milk protein derived bioactive peptides; as a source of antioxidants.
Antioxidant activity of the bioactive peptides can be attributed to their radical scavenging activity, inhibition of lipid peroxidation and metal ion chelation properties. Antioxidant peptides have characteristic amino acid sequence of usually 5–11 amino acid residue; the most reactive are either sulfur-containing side chains (cysteine and methionine) or aromatic side chains (tryptophan, tyrosine, and phenylalanine) from which hydrogen is easily abstracted. Histidine’s imidazole-containing side chain is also oxidatively labile (Power et al. 2012). Though peptides have excellent potential as antioxidant but its practical use in food systems is hindered due to bitter taste, salty off flavour and problem with respect to the stability during processing and storage (Saha and Hayashi 2001). Bitterness arises during hydrolysis is due to the presence of low molecular weight peptides composed mainly of hydrophobic amino acids while salty off flavour is due to the pH adjustments using sodium hydroxide (Hernandez-Ledesma et al. 2011).
In this respect, encapsulation of bioactive peptide enriched preparations may provide an alternative food ingredient to overcome some of the problems related to their direct application in food. Limited studies are available on encapsulation of the casein hydrolysate for masking their bitter taste using different polysaccharides and protein (Ortiz et al. 2009; Mendanha et al. 2009; Trindade et al. 2010; Subtil et al. 2012) and a few reports on bioactive peptides derived from whey proteins (Ma et al. 2014) for stabilization of immunomodulatory peptides. The aim of this work was to investigate the potential of maltodextrin/gum arabic (MD/GA) mixture as wall materials to encapsulate antioxidant peptide enriched casein hydrolysate to provide stability with respect to their antioxidant activity and mask bitterness associated with the peptides for their application in food.
Materials and methods
Materials
The edible grade acid casein sample was supplied by Modern Dairies Limited (Karnal, India). Papain (Carica Papaya, 3U/g protein) was purchased from Sigma–Aldrich Corp.(St. Louis, MO, USA), while Maltodextrin and Gum arabic from Hi-Media (Mumbai, India). Unless noted otherwise, chemicals were of analytical grade.
Preparation of hydrolysates
Fresh solution of acid casein (5% w/v on protein basis) was prepared in distilled water and heated at 85 °C for 15 min to inactivate the native proteases. The pH of the protein solution was adjusted to 6.5 and the papain was added corresponding to 1 and 4% enzyme substrate ratio. The reaction mixture was incubated in a shaking water bath (Jeiotech BS-11), set at 65 °C and 110 rpm for 240 min. During hydrolysis the pH was maintained at 6.5 by continuous addition of 1 N NaOH. Aliquots of the hydrolysates were collected after 120 and 240 min and the enzyme activity was terminated by heating at 90 °C for 10 min. The samples were subjected to centrifugation (Kubota centrifuge, Tokyo, Japan) at 12,000 rpm for 15 min to remove insoluble contents. The supernatant portion was collected, freeze dried (Hansil Science Industrial Co Ltd, South Korea) and stored at −20 °C for subsequent analysis.
Degree of hydrolysis (DH)
The degree of hydrolysis (DH) of the casein hydrolysates samples at different time interval was analyzed by O-Phthalaldehyde method (Nielsen et al. 2001) with a slight modification and calculated using the following equations:
| 1 |
where, Serine-NH2 is meqv serine NH2 g−1 protein; S is sample volume in litre; D is dilution volume; P is protein content in the volume of the sample; V is sample volume in assay.
| 2 |
where,
| 3 |
α, β and htot constants for casein are 1.039, 0.383 and 8.2, respectively (Aldler-Nissen 1986).
Characterization of peptide profile of casein hydrolysate
The peptide profiling of the casein hydrolysates was carried out by size exclusion chromatography (AKTA purifier (GE Healthcare Biosciences, Hong Kong) mounted with a column HiLoad™ 16/60 Superdex™ 30 prep grade, 120 mL (16 × 600 mm, GE Healthcare bio-science, Uppsala, Sweden). 1 mL of the casein hydrolysate sample (10 mg/mL) was injected and isocratic elution was performed at a flow rate of 1.0 mL min−1 for 1.5 column volume using 100 mM ammonium bicarbonate buffer, pH 7.8 (Tauzin et al. 2003). An internal standards mixture of six components having cytochrome C (13,000 Da; Sigma cat no-C3131), aprotinin from bovine lung (6511.44 Da; Sigma cat no-A1153), insulin chain-β oxidized (3495.89 Da; Sigma cat no-I6383), angiotensin I human acetate (1296.48 Da; Sigma cat no-A9650), L-glutathione oxidized (612.63 Da; Sigma cat no-G4376), l-tryptophan methyl ester (254.71 Da; Sigma cat no-364517) was used to obtain a calibration curve. The calibration curve was plotted between Kav and molecular weight (Y = −0.4544x + 1.875; R2 = 0.9016). Kav for each component was calculated by Eq. (4). This calibration curve was used for calculating molecular weight distribution of peptides in the casein hydrolysate by interpolation of Kav. The curve was fitted by linear regression using Graphing software (Graph Pad Prism 5.03; Graph Pad Software, San Diego, CA, USA).
| 4 |
where, Kav is the partition coefficient, Ve is the elution volume for sample, Vo is void volume and Vt is the total volume.
Free radical scavenging activity
The antioxidant activity was determined using ABTS + {2, 2-azinobis-(3-ethylbenzothiazoline-6-sulfonic acid) diammonium salt} radical cation de colorization assay developed by Re et al. (1999) with some modifications described by Tachakittirungrod et al. (2007). To create ABTS•+, 5 ml solution of ABTS (7 mM) was first allowed to react overnight with 88 μL of 140 mM potassium persulphate (final concentration of 2.45 mM)) in water and incubated at room temperature for 12–16 h in amber colour bottle. The ABTS•+ solution was diluted with phosphate buffer saline, pH 7.4 to an absorbance of 0.70 ± 0.02 at 750 nm and equilibrated at 30 °C.180 µL of ABTS working solution and 20 µL of trolox solution (60–400 µM) were added in a well using 96 well micro plate. The initial absorbance was recorded at 750 nm for 10 min over 1 min interval after initial mixing against the appropriate solvent blank, using microplate reader (Model: Infinite F200 Pro, Tecan, Austria). The percentage of inhibition of absorbance at 750 nm was calculated using the following formula:
| 5 |
x: μM concentration of trolox
The standard curve was prepared by plotting concentration (µM) of trolox (X-axis) v/s % inhibition (Y-axis). The samples were diluted such that 20 µL of each dilution in the assay produce inhibition between 20 and 80% of the blank absorbance. The results were expressed as µM trolox equivalent or μM trolox equivalence per mg of the peptide.
Preparation of freeze dried microcapsule
Maltodextrin (MD) and gum arabic (GA) were used as coating materials. The MD solution (16% w/w) was previously hydrated overnight, while GA solution (8% w/w) was prepared fresh before use. The prepared coating solution and the casein hydrolysates samples were mixed over magnetic stirrer to obtain total solid content of 30% by weight. Further the mixtures were subjected to ultrasonication at 750 W power, 40 kHz frequency, 12 mm diameter tip and with 50% pulse (Sonic, Vibra cell USA) for 20 min, while keeping the sample in ice bath. Finally the formulations were freeze dried (Hansil Science Industrial Co Ltd.). Effect of coating material on encapsulation efficiency (EE) was evaluated at 10:0, 8:2 and 6:4 MD/GA ratios on weight basis. Effect of pH (2–8) and different proportion of casein hydrolysate was assessed for EE.
Encapsulation efficiency
The protein content of encapsulated preparations (expressed as free protein content, FPC) was determined by dispersing them in distilled water at a concentration of 10 mg/ml, followed by centrifugation (4000 rpm/10 min) and measured in supernatant using Lowry et al. (1951).The EE of encapsulated preparations was calculated according to following equation:
| 6 |
Where, EPC is encapsulated protein content and TPC is total protein content.
Surface morphology analysis
The morphology of microspheres was observed under a scanning electron microscope (SEM; carlzeiss EV018) at an acceleration voltage of 15 kV and the micrographs were recorded on ORWO 35 mm panchromatic film (Tomar and Prasad 1987).
Particle size analysis
The samples of encapsulated preparations (P1, P2, P3) were suspended in distilled water (1 mg/mL), and the particle size distribution was monitored using particle size analyzer (Zetasizer Nano ZS, Malvern Instruments, UK). The particle size was expressed as mean diameter over the volume distribution.
Release mechanism of microencapsulated powder
The evaluation of protein release from microcapsules was carried out under simulated gastrointestinal (GI) conditions by suspending 3 g of encapsulated powder into 15 mL 0.1 M hydrochloric acid solution (pH 2) at 37 °C for 2 h; followed by incubation at pH 7.5 (adjusted using 5 M NaOH) for 2 h. 0.5 mL aliquot was drawn at 30 min interval and assayed for protein content using the method of Lowry et al. (1951). The total volume was maintained with buffer solution and the released protein was calculated based on corresponding value obtained after 4 h.
Bitterness evaluation
The bitterness of the samples was evaluated based on comparison with standard compound caffeine (1–5 mM) prepared in distilled water. Panellists were first trained for evaluation of bitterness using caffeine solution of different concentration for three sessions after which the samples were assessed. The panellists received 4 samples (HP, P1, P2 and P3) served at random in glass beaker (corresponding to 0.5% casein hydrolysate concentration) and rinsed their mouth with water between samples. The evaluation of samples was repeated three times and average value of the score recorded. The panellists were asked to assign the score value based on 100 percentage score of most bitter standard. The bitterness score of the sample was expressed isotonic to caffeine concentration, with the level corresponding to 1, 2, 3, 4 and 5 mM assigned score value as 20, 40, 60, 80 and 100%, respectively.
Statistical analysis
All the analysis was performed in triplicate and the results obtained were subjected to analysis of variance (ANOVA). Duncan’s new multiple range test was performed to determine the significant difference between samples within the 95% confidence interval using Graph pad prism 6 software.
Results and discussion
Hydrolysis of sodium caseinate using papain
The effect of enzyme substrate (E/S) ratio and incubation period on DH and antioxidant activity of casein hydrolysate is presented in Table 1. After 120 min a significant effect (p < 0.05) of E/S ratio was observed on degree of hydrolysis with corresponding increase in antioxidant activity. However, after 240 min, no significant effect (p > 0.05) of E/S ratio on DH was observed although a significant difference (p < 0.05) on antioxidant activity occurred.
Table 1.
Effect of time and E/S ratio on degree of hydrolysis (% DH) and antioxidant activity of casein hydrolysate
| Hydrolysis time (min) | Degree of hydrolysis (% DH) | Antioxidant activity TEAC (µM of trolox eq.) |
||
|---|---|---|---|---|
| E:S 1% | E:S 4% | E:S 1% | E:S 4% | |
| 120 | 18.64 ± 0.18aA | 24.35 ± 0.67bA | 62,413 ± 81.69aA | 63,950 ± 30.59bA |
| 240 | 19.86 ± 0.31aA | 25.20 ± 0.47bA | 68,930 ± 27.13aB | 68,720 ± 55.42aB |
Mean ± SEM (n = 3)
a, bMeans within rows with different lowercase superscript are significantly different (P < 0.05) from each other
A, BMeans within columns with different uppercase superscript are significantly different (P < 0.05) from each other
Peptide profile of the casein hydrolysate
The casein hydrolysate preparation (HP) obtained after 120 min hydrolysis at E/S ratio 4% was selected for further characterization for peptide profile by fractionating using size exclusion chromatography (SEC) over HiLoad™ 16/60 Superdex™ 30 prep grade column. Based on molecular peptide profile of casein hydrolysate (Fig. 1a), majority of peptides (88.66%) corresponded to 1–3 kDa molecular size. It was observed that peak P-4 corresponding to 2.32 kDa represented maximum area of chromatogram (38.35%) while that of peak P-3 represented 25.8% area (2.87 kDa), and the P-5 fraction of molecular size 1.65 kDa represented 13.96% chromatogram area. On evaluating the antioxidant activity of different fractions (Fig. 1b), using ABTS radical scavenging assay, the fraction corresponding to 1.65 kDa (Peak no P-5) showed maximum antioxidant activity.
Fig. 1.

a SE-HPLC profile (280 nm) of papain hydrolysed sodium caseinate. b Antioxidant activity of peak fractions. Bars represents Mean ± SEM. Bars with different superscripts are significantly different at p < 0.05. c Molecular weight distribution (%) of peptides in papain hydrolysed sodium caseinate
Van der Ven et al. (2002) reported that during hydrolysis, continuous formation and degradation of peptides depends on their molecular structure, which is primarily affected by hydrolysis conditions. Thus the greater proportion of short peptides (1–3 kDa), formed during hydrolysis of sodium caseinate with papain (E/S 4%) after 120 min might be responsible for their antioxidant activity. Earlier studies have also reported that the antioxidant activity of hydrolysate is dependent on the molecular weight (<3 kDa) (Moure et al. 2006; Kim et al. 2007; Li et al. 2008).The casein hydrolysate preparation (AO–CH) obtained after hydrolysis time of 120 min with 24.3% DH and antioxidant activity corresponding to 64,000 μM of trolox eq. was selected as core material for encapsulation.
Effect of wall material (maltodextrin—gum arabic) on microencapsulation of casein hydrolysate
The effect of different ratio of MD/GA at 1:20 core to coat ratio is shown in Fig. 2a. Based on free protein content, the EE was found to be maximum at 6:4 MD/GA ratio. Further, no significant difference (p > 0.05) on EE was observed between MD/GA ratio of 8:2 and 6:4 (Fig. 2a). Thus, the results indicated that the combination of MD with GA caused a decrease in the surface protein content and increased EE. Barbosa et al. (2005) reported higher stability of carotenoid bixin on encapsulation with GA than with MD. Our results were in agreement with Krishnan et al. (2005) which shows that the use of MD/GA as coat material for encapsulation of cardamom oleoresin resulted in better EE which might be due to the film forming property and stabilizing effect of gum arabic (Alftren et al. 2012).The improvement of EE at 8:2 ratio of MD/GA was the basis for its further evaluation for effect of pH and core to coat ratio on encapsulation of the casein hydrolysate.
Fig. 2.
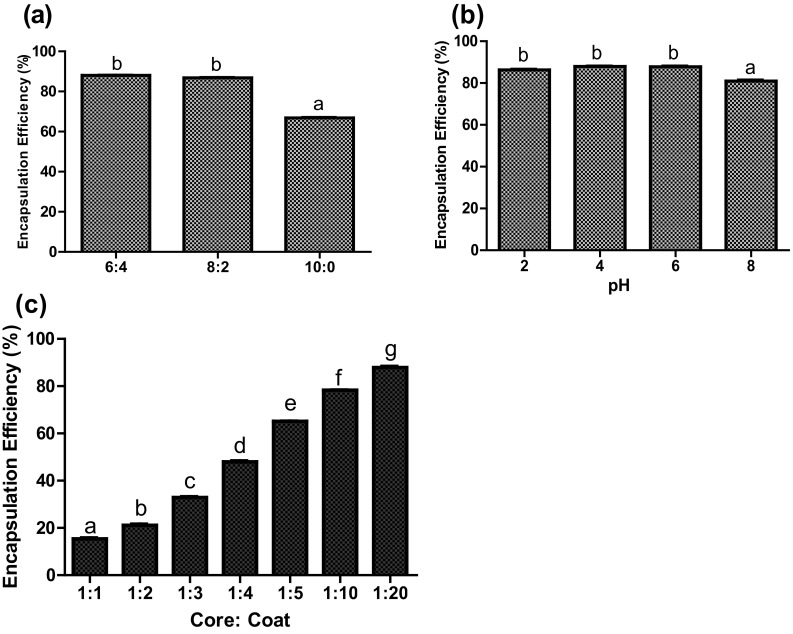
Bars represents Mean ± SEM. Bars with different superscripts are significantly different at p < 0.05 a Effect of different ratio of maltodextrin to gum arabic on encapsulation efficiency. b Effect of pH of maltodextrin—gum arabic on encapsulation efficiency. c Effect of different proportion of casein hydrolysate on encapsulation efficiency
Effect of pH on encapsulation efficiency
Effect of pH of wall material (MD/GA) on EE is presented in Fig. 2b. It was observed that the mixing of MD with GA (8:2) at 1:20 core to coat ratio have no effect on EE in the pH range 2–6. However, a significant decrease (p < 0.05) in EE was observed at pH 8.0. It has been reported that the change in pH of GA affected its viscosity, being maximum at very acidic/basic pH, while lower in pH 5–6, due to compact molecules (Anderson et al. 1990). Hence, the further evaluation of casein hydrolysate proportion on EE was conducted at pH 6.0.
Effect of casein hydrolysate proportion on encapsulation efficiency
The effect of variation in the proportion of casein hydrolysate on EE was analysed by preparing seven formulations with varying proportion of casein hydrolysate (5–50%) and assessed for their EE. The results depicted in Fig. 2c clearly show that the formulation with higher proportion of casein hydrolysate as core material (20–50%) had low EE. At core to coat ratio 1:5 (P1), 1:10 (P2) and 1:20 (P3), the EE corresponded to 65, 78.4 and 87.18%, respectively. Higher efficiency observed at 1:20 core to coat ratio might be due to the greater proportion of coating material. Previous studies have also shown high EE for collagen hydrolysate (Peres et al. 2011) and sour cherry pomace (Cliek 2012) using MD/GA as coat material.
Characterization of encapsulated and non encapsulated casein hydrolysate
Surface morphology
The SEM micrographs highlighted the effects of freeze drying on surface morphology of the particles. It was observed that at 1000× (Fig. 3), the surface morphology of freeze dried encapsulated casein hydrolysate was similar to that of coating material MD/GA but different from that of core material (casein hydrolysate). Further, the results indicate the addition of wall materials affect the structure of freeze dried product. It was observed that the preparation P3 with maximum EE, resulted in morphology resembling close to coat material (Fig. 3a). Overall the particles resembled broken glass or flake-like structure. Similar surface morphological properties have been reported for freeze dried powder (Anandharamakrishnan et al. 2010; Ezhilarasi et al. 2013).
Fig. 3.

Scanning electron micrograph of the freeze dried encapsulated preparations (×1000). a Core (HP). b Preparation P1. c Preparation P2. d Preparation P3. e Coat (MD/GA)
Antioxidant activity
Antioxidant activity of the encapsulated samples was evaluated by measuring their radical scavenging activity using ABTS method. It was observed that core to coat ratio had a significant (p < 0.05) effect on antioxidant activity (Fig. 4). As compared to core material, reduction in antioxidant activity of encapsulated sample P1, P2 and P3 was observed corresponding to 85, 90 and 93%, respectively, which might be due to the difference in effective concentration of hydrolysate. The trend on changes in antioxidant activity following encapsulation was similar to that reported earlier for other bioactive components (Cliek 2012).
Fig. 4.
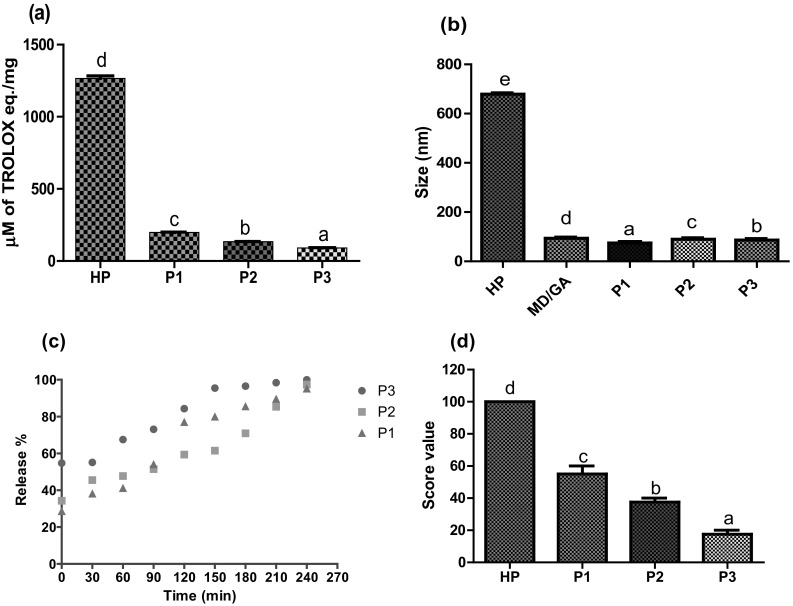
Characterization of encapsulated preparations. a Antioxidant activity. b Particle size distribution. c pH based release mechanism. d Bitterness score. Bars represents Mean ± SEM. Bars with different superscripts are significantly different at p < 0.05
Particle size analysis
The average particle size of casein hydrolysate and coating material MD/GA expressed as the volume mean diameter corresponded to 678 and 92.46 nm, respectively, while on encapsulation preparation P1, P2 and P3 resulted in particle size as 175.4, 90.62 and 86.27 nm, respectively (Fig. 4b). The results indicate that as the core to coat ratio increases, there is a decreases (4–7 times) in particle size as compared to core material. The ion–dipole and hydrogen bond interactions between gum arabic and maltodextrin might be responsible for the formation of small sized particle populations (Peres et al. 2011). The encapsulated preparation (P1, P2 and P3) showed a single modal distribution (Fig. 5) which might be responsible for better stability of the core (Finotelli and Rocha-Leao 2005). Bimodial distribution has been reported for encapsulated spray dried chicken meat hydrolysates using MD/GA (Kurozawa et al. 2009).
Fig. 5.

Particle size distribution of the freeze dried encapsulated preparations. a Core (HP). b Coat (MD/GA)
Release mechanism
Effect of time period on release of peptides from freeze dried encapsulated preparation at pH 2.0 and 7.5 is presented in Fig. 4c. The result shows high and instant release of casein hydrolysate at pH 2.0 after 120 min with maximum at 1:20 core to coat ratio (84%) while, at pH 7.5 nearly 100% release was observed after 240 min. The effect might be due to weak interaction between the core and coat material. Further the relatively high water solubility of coating material (MD/GA) on contact with water may destroy the structure of the particles. Erdinc and Neufeld (2011) also reported the release profile of protein microencapsulated within glycol-chitosan-alginate matrix by spray drying and showed 35% release of the initial protein content in the simulated stomach environment within 2 h and 100% release at pH 6.8.
Bitterness evaluation
The average score attributed by the panellists were 55, 37.5 and 17.5 for encapsulated preparation P1, P2 and P3 respectively (Fig. 4d). Based on the score value, a significant differences (p < 0.05) was observed among the encapsulated samples, with the P3 preparation being less bitter, as compared to preparations P1 and P2. The result demonstrates that the highest concentration of coating material MD/GA in the sample resulted in a lower perception of the bitter taste. Antioxidant peptides are hydrophobic in nature due to their amino acid composition and gives bitterness (Power et al. 2012). The decrease in bitterness suggests that hydrophobic peptides of casein hydrolysate became less exposed in the presence of wall material. These results are in agreement with earlier reports (Ortiz et al. 2009; Trindade et al.2010) for encapsulated casein hydrolysate with soy protein isolate/gelatine.
Conclusion
Encapsulation of the casein hydrolysate enriched in antioxidative peptides of molecular size 1–3 kDa was optimized with high loading capacity using MD/GA combination. The encapsulated preparation obtained with retention of antioxidative peptides together with masking of their bitter taste. The release mechanism of microcapsules indicated weaker interaction between casein hydrolysates and wall material. The prepared encapsulated preparation represents a promising food additive for incorporation into functional foods, due to the retention of their antioxidative activity.
Acknowledgements
This work was supported by the SERB-MOFPI Project (SERB/MOFPI/0028/2013), Department of Science and Technology, Govt. of India, New Delhi, India.
Compliance with ethical standards
Conflict of interest
The authors declare that they have no conflict of interest.
References
- Aldler-Nissen J. Enzymic hydrolysis of food proteins. New York: Elsevier Applied Science Publishers; 1986. pp. 110–169. [Google Scholar]
- Alftren J, Penarrieta J, Bergenstahl B, Nilsson L. Comparison of molecular and emulsifying properties of gum arabic and mesquite gum using asymmetrical flow field-flow fractionation. Food Hydrocolloids. 2012;26(1):54–62. doi: 10.1016/j.foodhyd.2011.04.008. [DOI] [Google Scholar]
- Anandharamakrishnan C, Rielly C, Stapley A. Spray-freeze-drying of whey proteins at sub-atmospheric pressures. Dairy Sci Technol. 2010;90(2–3):321–334. doi: 10.1051/dst/2010013. [DOI] [Google Scholar]
- Anderson D, Douglas D, Morrison N, Weiping W. Specifications for gum arabic (Acacia Senegal); analytical data for samples collected between 1904 and 1989. Food Addit Contam. 1990;7(3):303–321. doi: 10.1080/02652039009373896. [DOI] [PubMed] [Google Scholar]
- Barbosa M, Borsarelli C, Mercadante A. Light stability of spray-dried bixin encapsulated with different edible polysaccharide preparations. Food Res Int. 2005;38(8–9):989–994. doi: 10.1016/j.foodres.2005.02.018. [DOI] [Google Scholar]
- Cliek B (2012) Microencapsulation of phenolic compounds extracted from sour cherry (Prunuscerasus l.) pomace. The graduate school of natural and applied sciences of Middle East technical university, 1–187
- Erdinc B, Neufeld RJ. Protein micro and nanoencapsulation within glycol-chitosan/Ca2 +/alginate matrix by spray drying. Drug Dev Ind Pharm. 2011;37(6):619–627. doi: 10.3109/03639045.2010.533681. [DOI] [PubMed] [Google Scholar]
- Ezhilarasi PN, Indrani D, Jena BS, Anandharamakrishnan C. Freeze drying technique for microencapsulation of garcinia fruit extract and its effect on bread quality. J Food Eng. 2013;117:513–520. doi: 10.1016/j.jfoodeng.2013.01.009. [DOI] [PubMed] [Google Scholar]
- Finotelli PV, Rocha-Leao M (2005) Microencapsulation of ascorbic acid in maltodextrin and capsule using spray drying. http://www.enpromer2005.eq.ufrj.br/nukleo/pdfs/0022_aa pdf Paper. Accessed 08th July 2016
- Hartmann R, Meisel H. Food-derived peptides with biological activity: from research to food applications. Curr Opin Biotechnol. 2007;18:163. doi: 10.1016/j.copbio.2007.01.013. [DOI] [PubMed] [Google Scholar]
- Hernandez-Ledesma B, del Mar Contreras M, Recio I. Antihypertensive peptides: production, bioavailability and incorporation into foods. Adv Colloid Interface Sci. 2011;165(1):23–35. doi: 10.1016/j.cis.2010.11.001. [DOI] [PubMed] [Google Scholar]
- Kim G, Jang H, Kim C. Antioxidant capacity of caseinophosphopeptides prepared from sodium caseinate using Alcalase. Food Chem. 2007;104(4):1359–1365. doi: 10.1016/j.foodchem.2007.01.065. [DOI] [Google Scholar]
- Krishnan S, Bhosale R, Singhal R. Microencapsulation of cardamom oleoresin: evaluation of blends of gum arabic, maltodextrin and a modified starch as wall materials. Carbohydr Polym. 2005;61(1):95–102. doi: 10.1016/j.carbpol.2005.02.020. [DOI] [Google Scholar]
- Kurozawa LE, Park KJ, Hubinger MD. Effect of carrier agents on the physicochemical properties of a spray dried chicken meat hydrolysate. J Food Eng. 2009;94:326–333. doi: 10.1016/j.jfoodeng.2009.03.025. [DOI] [Google Scholar]
- Li Y, Jiang B, Zhang T, Mu W, Liu J. Antioxidant and free radical-scavenging activities of chickpea protein hydrolysate (CPH) Food Chem. 2008;106(2):444–450. doi: 10.1016/j.foodchem.2007.04.067. [DOI] [Google Scholar]
- Lopez-Exposito I, Quiros A, Amigo L, Recio I. Casein hydrolysates as a source of antimicrobial, antioxidant and antihypertensive peptides. Lait. 2007;87:241–249. doi: 10.1051/lait:2007019. [DOI] [Google Scholar]
- Lowry OH, Rosebrough NJ, Farr AL, Randall RJ. Protein measurement with the Folin’s phenol reagent. J Biol Chem. 1951;193(1):265–275. [PubMed] [Google Scholar]
- Ma J, Mao X, Wang Q, Yang S, Zhang D, Chen S, Li Y. Effect of spray drying and freeze drying on the immunomodulatory activity, bitter taste and hygroscopicity of hydrolysate derived from whey protein concentrate. LWT Food Sci Technol. 2014;56(2):296–302. doi: 10.1016/j.lwt.2013.12.019. [DOI] [Google Scholar]
- Meisel H, Fitzgerald RJ. Biofunctional peptides from milk proteins: mineral binding and cytomodulatory effects. Curr Pharm Des. 2003;9:1289–1295. doi: 10.2174/1381612033454847. [DOI] [PubMed] [Google Scholar]
- Mendanha D, Molina Ortiz S, Favaro-Trindade C, Mauri A, Monterrey-Quintero E, Thomazini M. Microencapsulation of casein hydrolysate by complex coacervation with SPI/pectin. Food Res Int. 2009;42(8):1099–1104. doi: 10.1016/j.foodres.2009.05.007. [DOI] [Google Scholar]
- Moure A, Domanguez H, Paraja J. Antioxidant properties of ultrafiltration-recovered soy protein fractions from industrial effluents and their hydrolysates. Process Biochem. 2006;41(2):447–456. doi: 10.1016/j.procbio.2005.07.014. [DOI] [Google Scholar]
- Nielsen P, Petersen D, Dambmann C. Improved method for determining food protein degree of hydrolysis. J Food Sci. 2001;66(5):642–646. doi: 10.1111/j.1365-2621.2001.tb04614.x. [DOI] [Google Scholar]
- Ortiz MS, Mauri A, Monterrey-Quintero E, Trindade M, Santana A, Favaro-Trindade C. Production and properties of casein hydrolysate microencapsulated by spray drying with soybean protein isolate. LWT Food Sci Technol. 2009;42(5):919–923. doi: 10.1016/j.lwt.2008.12.004. [DOI] [Google Scholar]
- Peres I, Rocha S, Gomes J, Morais S, Pereira M, Coelho M. Preservation of catechin antioxidant properties loaded in carbohydrate nanoparticles. Carbohydr Polym. 2011;86(1):147–153. doi: 10.1016/j.carbpol.2011.04.029. [DOI] [Google Scholar]
- Phelan M, Aherne A, Fitzgerald RJ, O’Brien NM. Casein-derived bioactive peptides: biological effects, industrial uses, safety aspects and regulatory status. Int Dairy J. 2009;19:643. doi: 10.1016/j.idairyj.2009.06.001. [DOI] [Google Scholar]
- Power O, Jakeman P, FitzGerald R. Antioxidative peptides: enzymatic production, in vitro and in vivo antioxidant activity and potential applications of milk-derived antioxidative peptides. Amino Acids. 2012;44(3):797–820. doi: 10.1007/s00726-012-1393-9. [DOI] [PubMed] [Google Scholar]
- Re R, Pellegrini N, Proteggente A, Pannala A, Yang M, Rice-Evans C. Antioxidant activity applying an improved ABTS radical cationdecolorization assay. Free Radic Biol Med. 1999;26(9–10):1231–1237. doi: 10.1016/S0891-5849(98)00315-3. [DOI] [PubMed] [Google Scholar]
- Saha BC, Hayashi K. Debittering of protein hydrolysates. Biotechnol Adv . 2001;19:355. doi: 10.1016/S0734-9750(01)00070-2. [DOI] [PubMed] [Google Scholar]
- Subtil S, Rocha-Selmi G, Thomazini M, Trindade M, Netto F, Favaro-Trindade C. Effect of spray drying on the sensory and physical properties of hydrolysed casein using gum arabic as the carrier. J Food Sci Technol. 2012;51(9):2014–2021. doi: 10.1007/s13197-012-0722-z. [DOI] [PMC free article] [PubMed] [Google Scholar]
- Tachakittirungrod S, Okonogi S, Chowwanapoonpohn S. Study on antioxidant activity of certain plants in Thailand: mechanism of antioxidant action of guava leaf extract. Food Chem. 2007;103(2):381–388. doi: 10.1016/j.foodchem.2006.07.034. [DOI] [Google Scholar]
- Tauzin J, Miclo L, Roth S, Molla D, Gaillard J. Tryptic hydrolysis of bovine αS2-casein: identification and release kinetics of peptides. Int Dairy J. 2003;13(1):15–27. doi: 10.1016/S0958-6946(02)00127-9. [DOI] [Google Scholar]
- Tomar SK, Prasad DN. Effect of pre-heat treatment on microstrucutre of cow whole milk yoghurt as revealed by scanning electron microscopy. Microbiol Aliments Nurtr. 1987;5:345–350. [Google Scholar]
- Trindade FC, Santana A, Monterrey-Quintero E, Trindade M, Netto F. The use of spray drying technology to reduce bitter taste of casein hydrolysate. Food Hydrocolloids. 2010;24(4):336–340. doi: 10.1016/j.foodhyd.2009.10.012. [DOI] [Google Scholar]
- Van der Ven C, Gruppen H, de Bont D, Voragen A. Optimization of the angiotensin converting enzyme inhibition by whey protein hydrolysates using response surface methodology. Int Dairy J. 2002;12(10):813–820. doi: 10.1016/S0958-6946(02)00077-8. [DOI] [Google Scholar]