Abstract
The Mouse Genome Informatics (MGI, http://www.informatics.jax.org/) resource provides the research community with access to information on the genetics, genomics and biology of the laboratory mouse. Core data in MGI include gene characterization and function, phenotype and disease model descriptions, DNA and protein sequence data, gene expression data, vertebrate homologies, SNPs, mapping data and links to other bioinformatics databases. Semantic integration is supported through the use of standardized nomenclature, and through the use of controlled vocabularies such as the Mouse Developmental Anatomy Ontology, the Mammalian Phenotype Ontology and the Gene Ontologies. MGI extracts and organizes data from primary literature and these data are shared with and widely displayed from other bioinformatics resources. The database is updated weekly with curated annotations and regularly adds new datasets and features. This unit provides a guide to using the MGI bioinformatics resource.
Key terms: mouse, genome, phenotypes, expression, genetics, gene ontology, gene, disease models, alleles
I. Unit Introduction
The Mouse Genome Informatics (MGI) community resources (http://www.informatics.jax.org/) provide public access to integrated information on the genetics, genomics and biology of the laboratory mouse (Eppig et al., 2015a). MGI integrates data from on-line genomic resources and curates experimental data from published literature; MGI currently cites over 220,000 publications. This integration enables complex queries on over 140,000 mouse feature types (protein and RNA coding genes, QTLs and chromosomal rearrangements), their molecular functions, phenotypic variants, expression patterns and mapping data.
Controlled vocabularies for the description of mutant phenotypes, and for the molecular functions, biological processes, and cellular components of gene products extend the ability to search, compare and explore genetic data. Over 46,000 alleles in mice, including spontaneous, targeted, transgene, and conditional mutants, have been catalogued. Another MGI resource, the International Mouse Strain Resource (IMSR, Eppig, et al. 2015b) provides contact information on mouse stocks available through public repositories. A new research tool, the Human–Mouse: Disease Connection, explores gene–phenotype–disease relationships between human and mouse. Vertebrate Homology Class data for human, chimpanzee, rhesus macaque, rat, dog, cattle, chicken, western clawed frog and zebrafish are curated from HomoloGene and link to EntrezGene, Comparative GO Graphs, sequences and HomoloGene multiple sequence alignments. A Mouse JBrowse Genome Browser permits displaying and manipulating genome annotations.
MGI compiles and integrates gene expression information for mouse embryonic development. Researchers can find information about the expression profiles of transcripts and proteins in different mouse strains and mutants and also can query gene expression data detailing when and where a gene is expressed and what genes are expressed in specific tissues and at specific developmental stages (Smith et al., 2014).
The Basic Protocol introduces the MGI Home Page and describes a simple search and illustrates the search results. The Alternate Protocols portray more complex means of searching using multiple search parameters.
Necessary Resources List
Software: MGI works well with most web browsers.
II. Basic Protocol
Introduction to the MGI Home Page and quick search for gene information.
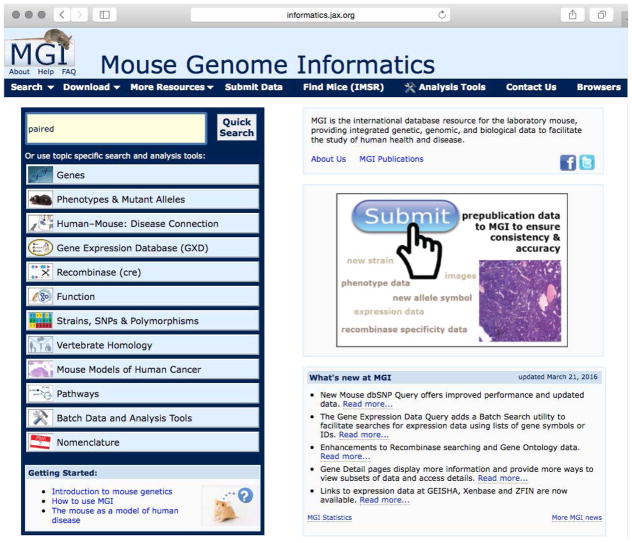
The MGI Home Page (Figure 1.7.1) organizes search tools by topic and features a banner with drop-down access to most MGI resources and search forms. The banner is present on most MGI web pages so new searches can be easily initiated without returning to the Home Page. As an example, you could select Genes → Genes & Markers Query from the drop-down Search menu on the top left side of the banner on most MGI web pages (Figure 1.7.1). Search forms permit the designation of multiple search parameters and take advantage of the extensive data integration of MGI (Eppig et al., 2015a). Each search form permits the construction of complex queries from different perspectives. For example, the search form for Phenotypes, Alleles & Disease Models includes query parameters such as mutation type, map position, and phenotype ontology term. Simple searches of a gene symbol or name or an accession ID are supported by the Quick Search field on most MGI web pages.
Figure 1.7.1.
The MGI Home Page organizes search tools by topic and permits simple searches. Here the partial gene name “paired” has been entered for a default search for gene symbols, names and synonyms. Note that MGI web searches are case-insensitive. The drop-down Search menu shows how to access the Gene & Markers Query Form.
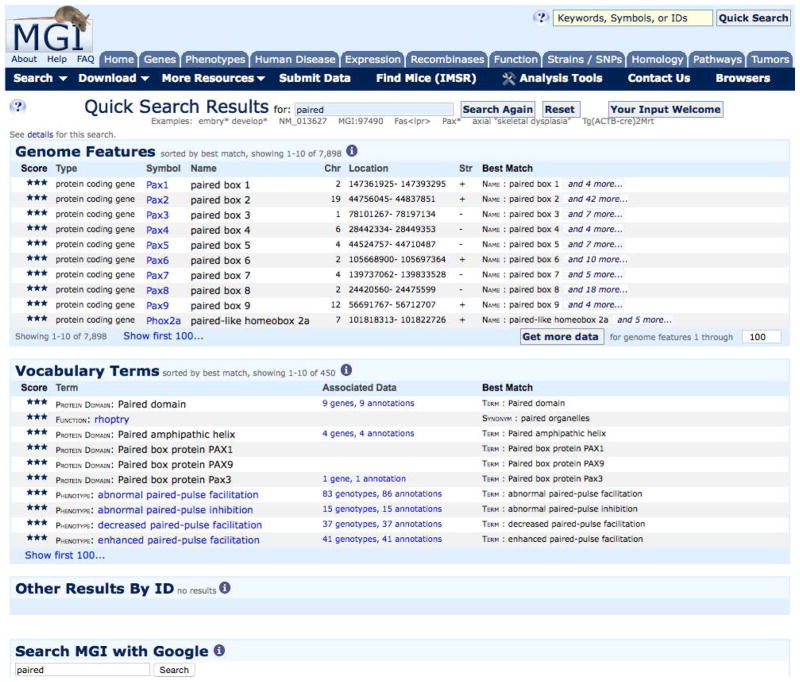
In response to a query, a Summary Page is generated (Figure 1.7.2). This summary page includes all the results that meet the search criteria. The user can then select a record (such as gene) to access the record detail page. There the major components for the record are displayed and links to the experimental data and other details are available.
Figure 1.7.2.
Search results for gene symbols, names and synonyms containing “paired” and showing the matching text. See text for details.
Click on the blue question mark icon on any page to access related help documentation.
IIa. Quick Search
If, for example, you are interested in the Pax (paired box) family of genes you can simply type paired into the Quick Search field and click the Quick Search button or use your keyboard’s return/enter key. Alternately, you could search for pax*. The asterisk serves as a wild-card and turns this into a “begins” search. The results of the paired search are shown in Figure 1.7.2.
IIb. Search Results
The Quick Search results summary page shows the first 10 results of three separate searches. The first section shows the results of a search of Genome Features: including mouse gene and marker official symbols and names and synonyms, and their homologs in several species. MGI is the authoritative source of official names for mouse genes, alleles, and strains and also catalogs synonyms used in publications. The Genome Features results provides a list of gene and allele symbols, names, map positions and the text matching your search string.
The Genome Features section also offers a button to “Get more data.” This will forward the marker symbols from your results to the MGI Batch Query. The Batch Query allows you to get additional information about these genome features, such as associated sequence IDs and GO terms, and to export your results as a text or spreadsheet file.
The second section of the Quick Search results searches several defined vocabularies and provides links to their associated data. The Gene Ontology, Mammalian Phenotype, OMIM Disease terms, Mouse Anatomy, and Protein Domains and Families are searched.
The third section shows the results of accession ID searches.
A final section on the results page offers the ability to perform a Google search of MGI. Included in this search are reference abstracts and curator notes.
IIc. Gene Detail Page
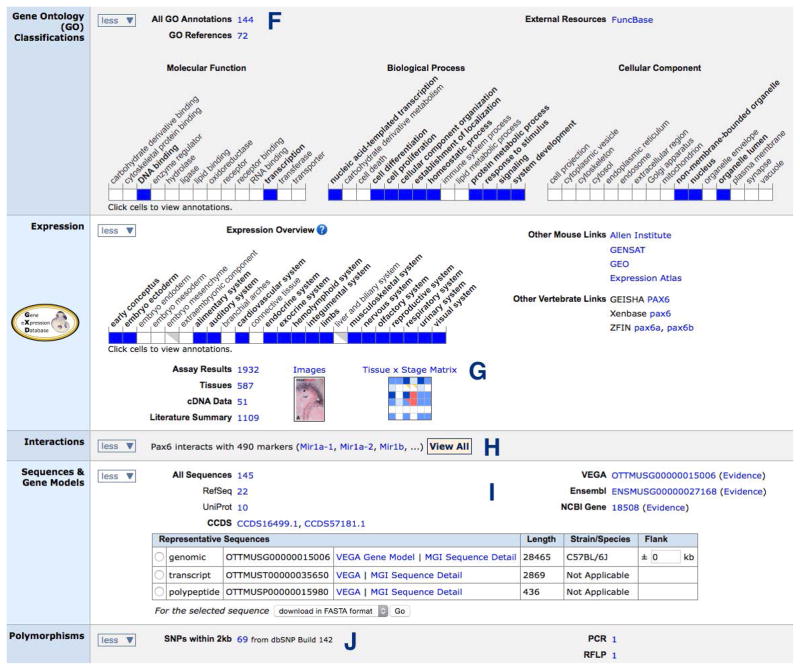
To find more information on a gene, click on its symbol. This will take you to the “Gene Detail” page—the page with links to all the information MGI has curated for that gene. Blue-celled grids now highlight gene function and phenotype annotations and expression data. The Pax6 Gene Detail page is shown in Figures 1.7.3 and 1.7.4. Note that each component has links to further information. Below are some examples of the information found on gene detail pages. The letters below, A – I, designate the appropriate section on the Gene Detail page shown in Figures 1.7.3 and 1.7.4. Sections will be absent when we have no data of of that type.
Figure 1.7.3.
The top portion of the Pax6 Gene Detail page. This page offers links to all the information MGI has curated for Pax6, including map location, a summary of expression data, orthologs, GO annotations and references. See text for details.
Figure 1.7.4.
The middle portion of the Pax6 Gene Detail page.
Near the top of the page is the “Your Input Welcome” button. Use this button to inform our User Support group of any omissions, errors or to ask questions related to this gene.
The Location & Maps section provides the genome coordinates for the gene from the latest build of the mouse C57BL/6J genomic sequence along with strand information. Click the more> button to find links to genome browsers. You can also get the genomic sequence in FASTA format and include additional flanking sequence.
The Homology section allow you to access sequences and mapping information for human, chimpanzee, rhesus macaque, rat, dog, cattle, chicken, western clawed frog and zebrafish homologs.
A new section, Human Diseases, provides a table of human diseases OMIM has associated with the human gene as well human diseases modeled in mice with mutations in the gene. Click more> to expand the section to see the table and less to collapse the view.
The Mutations, Alleles and Phenotypes section provides a brief summary of phenotypes produced by mutant alleles and links to allele information and associated human disease models. A Phenotype Overview displays the highest-level terms from the Mammalian Phenotype (MP) Ontology and uses blue cells to mark those with phenotypic annotations to genotypes with alleles of the gene.
The Gene Ontology (GO) Classifications section shows selected defined vocabulary terms for the Molecular Function, Biological Processes and Cellular Components of this gene’s products. This section also provides a link to all GO classifications associated with this gene. Follow that link and then click on a term to view its place in the vocabulary hierarchy and to find all genes annotated to that term.
Pax6 Expression data can be viewed by developmental Theiler Stage, tissue or assay type. These pages summarize expression data and link to the underlying experimental details such as images of in situ figures. A new feature is a tissue-by-developmental stage matrix that provides an overview of the spatio-temporal expression patterns of the gene. When available, links are provided to model organism databases for chicken, frog and zebrafish gene expression data.
A new Interactions section describes predicted and verified gene targets of known mouse microRNAs, as these are genes whose expression is potentially regulated by the microRNAs. The section links to a table of all the interacting features, including the type of interaction and whether it is validated or predicted.
The Sequences section offers information on representative genome, transcript and polypeptide sequences, a link to all sequences curated for this gene and the ability to download sequences in FASTA format.
The Polymorphisms section provides a link to all SNPs from NCBI’s dbSNP within 2 kb of the gene.
III. Alternate Protocol
Using the Gene Expression Data search form to search for gene expression data by tissue and assay type.
IIIa. Introduction
A major strength of MGI is the extensive integration of biological data from literature and on-line genomic sources. Integration is accomplished through a combination of algorithmic and manual curation approaches. All data are supported with experimental evidence and citations. The extensive integration facilitates complex querying over diverse data types. Suppose, for example, you were interested in cell adhesion genes that are expressed in the lung. The following subsections describe how this search may be accomplished.
IIIb. Expression Search Procedure
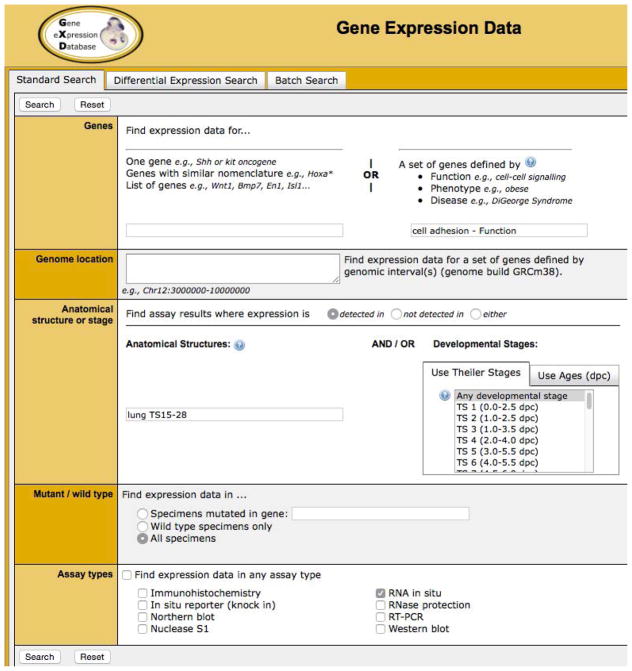
Go to Search beneath the MGI logo on the upper left hand side of an MGI web page and select Expression → Gene Expression Data Query. This query form offers three tabbed forms: a Differential Expression Search to find genes expressed in some anatomical structures but not others, a Batch Search for searching with lists of genes or IDs, and a Standard Search. This example uses the default tab, the Standard Search.
In the Genes section of the page, use the right hand field and type: cell adhesion and select the term from the list. Note that the number of genes annotated to the term is shown.
In the Anatomical structure or stage section, Find assay results where expression is “detected in.”
In the Anatomical Structures field, type: lung and select the term from the list.
To reduce the number of results for this example, we are going to limit the search to Assay type: RNA in situ. An easy way to do this is to click the check mark for “Find expression data in any assay type” to uncheck all assay types and then select RNA in situ.
Click the Search button.
Figure 1.7.5 shows the Gene Expression Data Query Form with the fields filled out as above.
Figure 1.7.5.
The Gene Expression Data query form filled out for a search of cell adhesion genes shown to be expressed in mouse lungs. See text for details.
IIIc. Search Results
The tabbed results of this search provide different ways to view your results. The Genes, Assays and Assay Results tabs offer progressively detailed views of your expression search results. The two matrices provide interactive high-level overviews of temporal and spatial expression patterns and offer the ability to drill down to more detail. The Assay Results tab is selected by default and lists the RNA in situ assay results that meet the search criteria and provides links to each assay’s details, reference and the relevant gene detail page. To view the assay details, click on the data link a Result Detail for a gene. Each assay has a unique MGI accession ID, such as MGI:2450660, an assay that detected expression of Adam12 in lung. The assay details provide information on how the assay was performed, images and details on the expression for the different structures and developmental stages (TS, Theiler Stages) examined.
IV. Vocabulary Browsers
IVa. Introduction
MGI uses and develops structured vocabularies describing gene function, mouse anatomy and mammalian phenotypes. Vocabularies are developed and used throughout MGI to facilitate data curation, consistency and computational analysis. The browsers can be accessed from the drop-down Search menu’s Phenotype, Expression and Function sections.
Gene Ontology
MGI is an active participant in the multi-species Gene Ontology Project (http://www.geneontology.org. UNIT 7.2). The objective of the GO project is to provide controlled vocabularies for the description of the molecular function, biological process, and cellular component of gene products. The GO vocabularies have a networked hierarchical structure that permits a range of detail from high-level, broadly descriptive terms to very low-level, highly specific terms. Each term is carefully defined and is represented in relationship with other terms in the hierarchy (Ashburner et al., 2000).
The GO terms are used as attributes of gene products by collaborating databases. The uniform use of defined, structured vocabularies facilitates robust queries across multiple diverse species information systems. In MGI, the Gene Ontology Browser can be used to browse or search the vocabulary and find genes annotated to each term (Drabkin et al., 2012).
Mouse Developmental Anatomy
Expression patterns in MGI are described using an extensive dictionary of standardized anatomical terms, facilitating searches of expression data from assays with differing spatial resolution in a consistent manner. The developmental biology of the mouse is delineated by 28 Theiler Stages and for each stage a dictionary of anatomical structures has been developed (Bard et al., 1998). The Mouse Developmental Anatomy Browser permits searching and browsing of expression data by Theiler Stage, the anatomical structures present at each stage and their substructures.
Phenotypes
MGI’s Mammalian Phenotype Ontology provides standard descriptors of phenotype terms that permit phenotype data to be accessible to computational analysis. Term definitions and examples are provided and assist in searching, grouping, comparing, and analyzing phenotype data. The Mammalian Phenotype Browser is also available for viewing the complete ontology (Smith et al. 2012).
Mouse Models
The Human Disease (OMIM) Browser contains human disease, syndrome, and condition terms from Online Mendelian Inheritance in Man (OMIM). You can use the vocabulary browser to browse for potential mouse models of human diseases. For each disease term, the number of different mouse models discussed in the literature is indicated.
IVb. GO Browser Search Procedure
In this example, we will use one of the vocabulary browsers, the Gene Ontology browser.
Go to Search beneath the MGI logo on the upper left hand side of an MGI web page and select Function → GO Browser.
Type cardiac conduction in the Query field and click the Search button.
By default, this will search all three GO categories.
IVc. Search Results
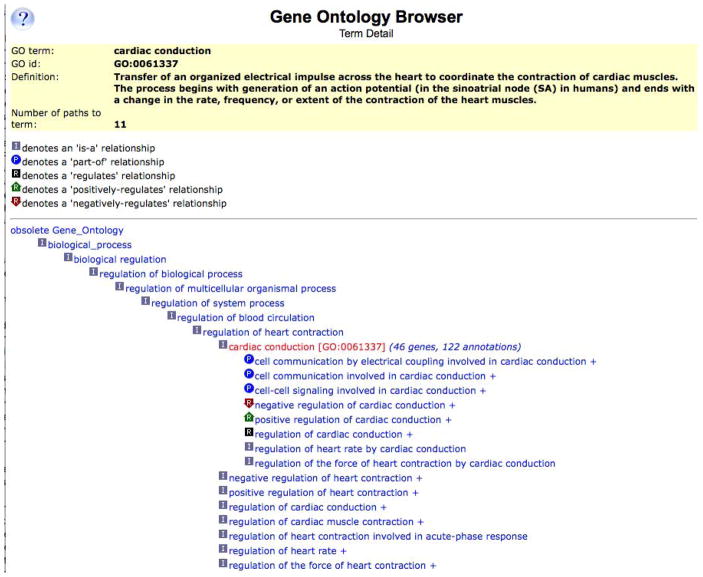
The results show all the vocabulary terms in each category that contain the phrase, “cardiac conduction” and any terms that are lower in the ontology hierarchy. Click on “cardiac conduction” in the Biological Process section to view a definition of this term and the term’s place in the vocabulary hierarchy. Since the ontology is built on a DAG (directed acyclic graph) structure, a term can have more than one parent term. The resulting page shows cardiac conduction as a child term under two parent terms, regulation of heart contraction and multicellular organismal signaling. A plus (+) sign following a term indicates that it has one or more child terms of its own (Figure 1.7.6). More information on GO browser results can be found by clicking on the blue question mark at the top of the page.
Figure 1.7.6.
The top portion of a Gene Ontology detail page for the biological process term, cardiac conduction, showing the hierarchical structure.
Click on the number of cardiac conduction genes to see all mouse genes annotated to this term. Each gene in the resulting list has a link to its detail page and a link to the references that support the annotation of the term to the gene.
V. Phenotype search
Va. Introduction
Mouse models of mammalian diseases are important tools for examining the biological processes involved in the development of disease. These mice help researchers understand how genotypes lead to disease or predisposition to disease. MGI provides robust methods for searching disease phenotypes and their underlying genetic defects (Smith et al., 2012). Weekly updates of high-throughput phenotyping data from the International Mouse Phenotype Consortium (IMPC) are integrated with curated data from scientific publications, providing comprehensive comparative phenotypes for mouse mutants. To date, over 46,000 phenotypic alleles, representing over 11,000 genes have been cataloged. Phenotype information is associated with genes through their alleles.
Vb. Phenotype Search Procedure
Using the Phenotypes, Alleles & Diseases Query form to find conditional knockout alleles associated with cataracts.
Go to Search beneath the MGI logo on the upper left hand side of an MGI web page and select Phenotypes → Phenotypes, Alleles & Diseases Query.
In the Mouse phenotypes & mouse models of human disease section of the form, type cataract.
In the Categories section of the form, check the Allele Attributes: Conditional ready and Null/knockout.
Click the Search button at either the top or bottom of the form.
Vc. Search Results
This search returns a list of conditional ready null/knockout alleles annotated to the Mammalian Phenotype Ontology term, cataract. To see details on any of the alleles:
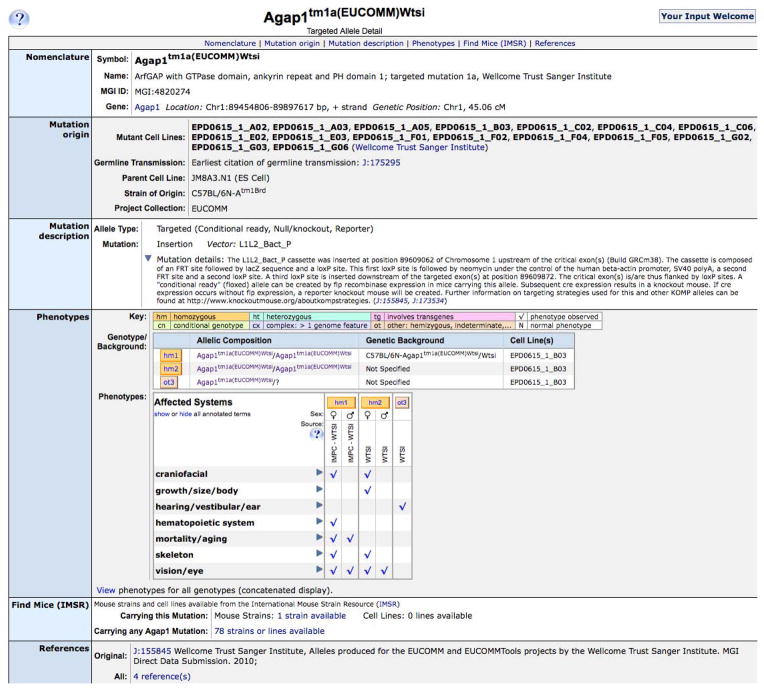
Click on an allele symbol, such as Agap1 tm1a(EUCOMM)Wtsi1, to access the allele detail page, shown in Figure 1.7.7.
Figure 1.7.7.
The Agap1 tm1a(EUCOMM)Wtsi1 MGI Allele Detail page, showing a description of the mutation and high-level Mammalian Phenotype terms annotated to the different genotypes. Clicking on a genotype button, such as hm2, provides detailed phenotype descriptions.
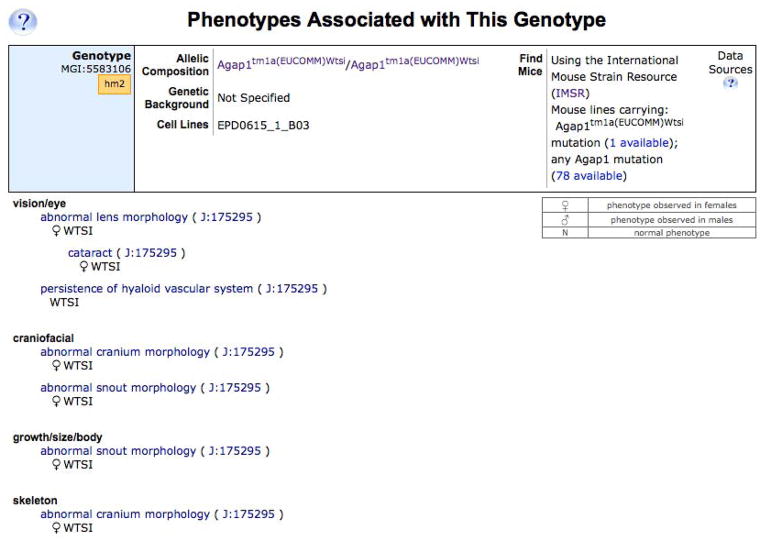
Each phenotypic allele record includes its origin and the strain on which the mutation occurred. A description of the molecular alteration in this mutation is also provided. A large section of the record contains high level phenotype terms based on the Mammalian Phenotype Ontology. These terms can be expanded to show sub-terms by clicking on a blue triangle. The lower level terms link to the Mammalian Phenotype Ontology Browser where you can find the terms’ definitions and links to all alleles annotated to each term. Each phenotype term is associated with a reference and the genotype of the mouse analyzed (genotype = the mutant allele pair(s) plus the genetic background on which the phenotype was analyzed). More detailed phenotype descriptions can be viewed by clicking on a genotype button, such as hm2 (for the second homozygous genotype described), shown in Figure 1.7.8.
Figure 1.7.8.
A portion of the expanded phenotype descriptions for one Agap1tm1a(EUCOMM)Wtsi1 homozgous genotype, showing the Mammalian Phenotype terms and notes.
MGI curates data from publications and integrates these with data from the high-throughput phentotyping projects. All references describing the mutant and its phenotype are found at the bottom of the allele detail page.
In the Find Mice (IMSR) section near the bottom of the web page, there are links to the International Mouse Strain Resource (IMSR, http://www.findmice.org/index.jsp) that will search the IMSR for available stocks carrying the Agap1 tm1a(EUCOMM)Wtsi1 allele and for stocks carrying any mutation in the Agap1 gene. The IMSR is an online database of mouse strains and stocks available worldwide from multiple repositories.
VI. Mouse Models of Human Diseases Search
VIa. Introduction
As discussed in section V, inbred strains of mice are valuable tools for studying the genetics and biology of mammalian diseases. MGI integrates data on mouse models of human disease and human disease etiology from Online Mendelian Inheritance in Man (OMIM) with existing data for mouse genes and strains in MGI and links to OMIM descriptions of human diseases, syndromes, and conditions.
VIb. Human Disease Models Search Procedure
The MGI Human - Mouse: Disease Connection tool supports querying mouse genetic and comparative data from the human or mouse perspective. Users can begin to explore data by searching for genes (symbols, names, IDs) or genome locations from human or mouse, or by searching with phenotype or human disease terms.
This tool provides clinical researchers with an easy way to explore the mouse genome for experimentally determined models of human phenotypes and diseases; as well as to find potential candidate models where well-characterized, genetically defined mice display a spectrum of phenotypes similar to humans. Likewise, mouse geneticists can readily explore relationships between mouse phenotypes and human diseases.
This example uses the Human - Mouse: Disease Connection to find the genes in two regions of the human genome, their mouse homologs, phenotypes associated with the mouse genes and, phenotypes and diseases associated with the human genes (via OMIM and the Human Phenotype Ontology (HPO)) and diseases modeled using the mouse genes.
Click on the blue Human Disease tab at the top of an MGI web page.
Toggle "Please select a field" to "Genome Location."
Select the species and build: Human (GRCh38).
Enter the region: 19:43341000-44910000 (This format is also supported: Chr19:43341000-44910000)
Click the Add button.
Toggle the second "Please select a field" to "Genome Location."
Select the species and build: Human (GRCh38).
Enter the region: 21:25001000-26971000
Toggle the default Boolean from AND to OR.
Click the Search button.
Scroll out to the right to see diseases associated with the human genes and disease models of the mouse genes.
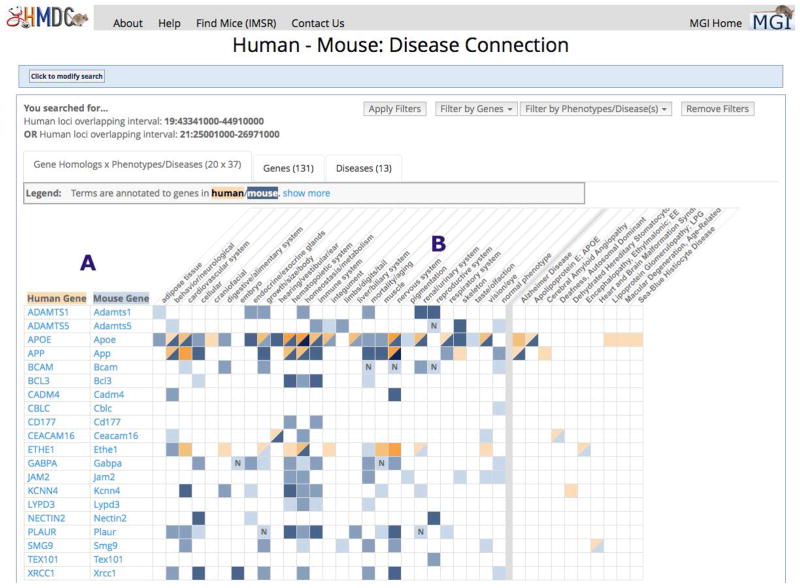
Click on the blue and tan square at the intersection of APP and nervous system to see the mouse App alleles with nervous system abnormalities and human phenotypes and diseases associated with the human APP gene.
VIc. Search Results
Any Human - Mouse: Disease Connection search (by genes, location, phenotype term or disease) returns an initial grid of human/mouse gene homologs x phenotype/disease terms that matches the search parameters. Within the grid, colors specify the presence of relevant human and mouse data. Each colored cell is an active link leading to more detail. This grid is only the first of three tabs presented on the result page. Also available are a Genes tab, which provides information and links about each human or mouse gene returned by your search, and a Diseases tab, leading to information and links about each human disease returned by your search. Data on the Genes and Diseases tabs are downloadable.
Figure 1.7.9 shows the default view of this search.
Figure 1.7.9.
The Human – Mouse Disease Connection results for a search of 2 human genome regions. A grid of genes in the human regions and their mouse orthologs, and the associated mouse and human phenotypes and diseases, is shown. See text for details.
The official human gene symbols mapped to the search coordinates and their mouse homologs. Mouse gene symbols link to MGI Gene Detail pages (Section IIc.) and human gene symbols link to MGI homology pages that offer sequence downloads and links to EntrezGene for human, mouse and other vertebrate homologs. Only genes with phenotype or disease data are displayed in this tab.
This section shows the high level Mammalian Phenotype terms annotated to the mouse genes. Listed to the right, after a vertical grey bar, are human diseases associated with the human gene in OMIM or through mouse models described in publications. Some of the human disease terms have been shortened. If you hover your cursor over the term, a pop-up will display the full term name. The colors, blue for mouse data and tan for human data, get progressively darker with more supporting annotations. You can hover your cursor over a colored square to see that row’s genes and column heading in a pop-up. Click on a colored square for information on mouse genotypes and lower level phenotype terms for human and mouse. The mouse genotypes link to even more detailed phenotype information. A bold N in a phenotype column indicates that no abnormal phenotypes of that type were observed in any allele of the gene.
VII. Batch Searches
VIIa. Introduction
MGI provides several means of retrieving data in bulk, such as weekly database reports, database downloads via FTP, direct SQL access, an easy to use Batch Query Form, and many query forms support exporting results in text and spreadsheet formats. This example showcases MouseMine (Motenko et al., 2015), based on the InterMine open source data warehouse system.
VIIb. MouseMine Search Procedure
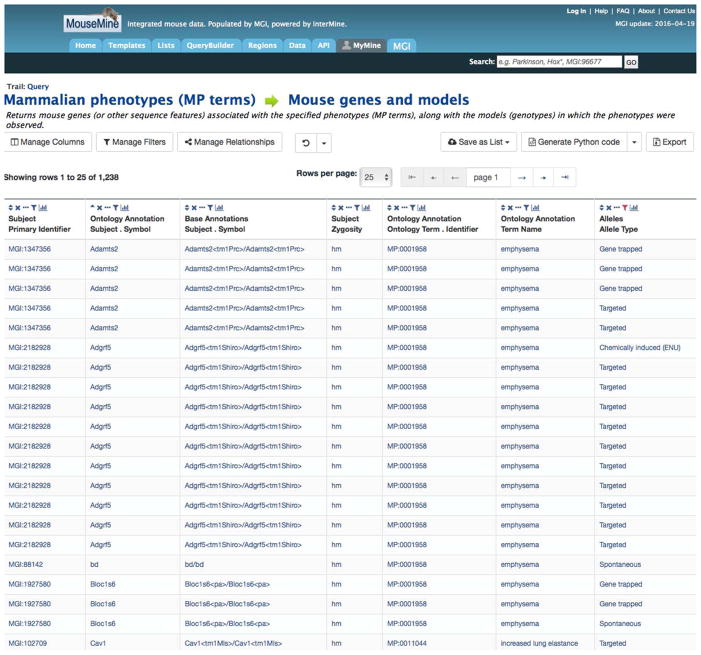
We have seen that MGI makes it easy to find genotypes associated with particular phenotypes (Section Vb) but the search results from the web form currently shows you only the high level phenotype terms. If you used the Mammalian Phenotype (MP) Browser to find genotypes associated with emphysema (MP:0001958) and abnormal lung elastance (MP:0011043), how can you get a text file of those genotypes and show the lower level phenotype terms annotated to each genotype along with the homozygosity and allele type?
You can do this (and much more) with MouseMine, http://www.mousemine.org/.
Go to Search beneath the MGI logo on the upper left hand side of an MGI web page and select MouseMine.
Click on the Templates tab near the top of the page.
Click on Mammalian phenotypes (MP terms) --> Mouse genes and models.
Enter MP:0001958, MP:0011043 in the LOOKUP field and click the Show Results button.
VIIc. MouseMine Search Results
This returns a list of genes and transgenes and alleles associated with these phenotypes terms and their subterms. Now we can modify the query:
Click on the Manage Columns button and then click on Add a new Column.
Scroll down and click on Alleles and then click on Allele Type. Click Add 1 new Column. This will add a column of information about the allele type, such as Spontaneous, Targeted (knockout), Targeted (Floxed/Frt) and Radiation induced. The Manage Columns window should show this as “Alleles≫Allele Type.”
Click Apply Changes.
You can remove unwanted columns by clicking the X above the column heading and you can filter a column by clicking on the last icon above the column heading, the graph. A portion of the results of this query are shown in Figure 1.7.10.
Click the Export button to select your formatting options.
Figure 1.7.10.
A portion of the results of a MouseMine search for emphysema and abnormal lung elastance alleles.
VIII. Commentary
The broad scope of MGI’s datasets and the number of search forms available to mine these data can be intimidating at first. Beginners may wish to start searches from the Quick Search field or one of the Vocabulary Browsers rather than using the integrated search forms, such as those for Expression Data or Phenotypes, Alleles & Disease Models. MGI’s gene detail pages (Figures 1.7.3 and 1.7.4) offer various links that can lead to the categorical data you may be seeking, such as expression or phenotype. Once familiar with MGI data content, users will find that more specific queries on a particular data area can be made through integrated search forms that center on the “root” data of interest. For example, if you are interested in expression data in a particular developmental stage or tissue, use the Gene Expression Data Query form.
MGI continues to evolve, expanding its data coverage, improving data handling, and providing new data manipulation and display tools to meet the needs of the scientific community.
Acknowledgments
MGI is supported by NIH grants HG000330, HD062499, HG002273, CA089713, HG004834.
Footnotes
Key Reference
Nucleic Acids Research’s annual Database Issue offers an overview of MGI:
Eppig JT, Blake JA, Bult CJ, Kadin JA, Richardson JE; the Mouse Genome Database Group. 2015. The Mouse Genome Database (MGD): facilitating mouse as a model for human biology and disease. Nucleic Acids Res. Jan 28;43(Database issue):D726–36.
Internet Resources
Weekly data reports such as those associating gene symbols with MGI Accessions IDs, map positions and GenBank Accession IDs are available by ftp: ftp://ftp.informatics.jax.org/pub/reports/index.html
MGI offers a Batch Query tool that allows you to retrieve data about many genes in MGI all at once. You can paste or upload a file containing a column of gene symbols or IDs into the batch query tool. You can specify the output you want in the results, such as nomenclature, genome location, gene ontology or mammalian phenotype data. http://www.informatics.jax.org/batch
MGI resources are thoroughly documented: http://www.informatics.jax.org/mgihome/homepages/help.shtml#UserDocs
MGI accepts electronic data submissions of any type of data that MGI maintains. Information on submitting your data is available: http://www.informatics.jax.org/submit.shtml
An electronic version of the book, Biology of the Laboratory Mouse by the Staff of The Jackson Laboratory, edited by Earl L. Green is available online, along with versions of these out-of-print books: The Anatomy of the Laboratory Mouse by Margaret J. Cook, Mouse Genetics by Lee Silver, The Coat Colors of Mice by Willys K. Silvers and Origins of Inbred Mice, edited by Herbert C. Morse III. The books are thoroughly indexed and linked to Gene Detail pages at MGI, as well as to references at MGI and PubMed. Links to all online books can be found here: http://www.informatics.jax.org/resources.shtml#books
MGI maintains and moderates an E-mail bulletin board, mgi-list, for the mouse genetics research community. You can subscribe to the list and search the list archives through a web interface: http://www.informatics.jax.org/mgihome/lists/lists.shtml
The International Mouse Strain Resource (IMSR) is a searchable online database of mouse strains and stocks available worldwide from several providers. http://www.findmice.org/index.jsp
User Support: Please send questions and comments to our User Support group: mgi-help@jax.org.
Literature Cited
- Ashburner M, Ball CA, Blake JA, Botstein D, Butler H, Cherry JM, Davis AP, Dolinski K, Dwight SS, Eppig JT, Harris MA, Hill DP, Issel-Tarver L, Kasarskis A, Lewis S, Matese JC, Richardson JE, Ringwald M, Rubin GM, Sherlock G. Gene Ontology: tool for the unification of biology. Nat Genet. 2000;25:25–29. doi: 10.1038/75556. [DOI] [PMC free article] [PubMed] [Google Scholar]
- Bard JBL, Kaufman MH, Dubreuil C, Brune RM, Burger A, Baldock RA, Davidson DR. An internet-accessible database of mouse developmental anatomy based on a systematic nomenclature. Mech Dev. 1998;74:111–120. doi: 10.1016/s0925-4773(98)00069-0. [DOI] [PubMed] [Google Scholar]
- Drabkin HJ, Blake JA for the Mouse Genome Informatics Database. Manual Gene Ontology annotation workflow at the Mouse Genome Informatics Database. Database (Oxford) 2012 Oct 29;:bas045. doi: 10.1093/database/bas045. [DOI] [PMC free article] [PubMed] [Google Scholar]
- Eppig JT, Blake JA, Bult CJ, Kadin JA, Richardson JE the Mouse Genome Database Group. The Mouse Genome Database (MGD): facilitating mouse as a model for human biology and disease. Nucleic Acids Res. 2015a Jan 28;43(Database issue):D726–36. doi: 10.1093/nar/gku967. [DOI] [PMC free article] [PubMed] [Google Scholar]
- Eppig JT, Motenko H, Richardson JE, Richards-Smith B, Smith CL. The International Mouse Strain Resource (IMSR): cataloging worldwide mouse and ES cell line resources. Mamm Genome. 2015b Oct;26(9–10):448–455. doi: 10.1007/s00335-015-9600-0. [DOI] [PMC free article] [PubMed] [Google Scholar]
- Motenko H, Neuhauser SB, O’Keefe M, Richardson JE. MouseMine: a new data warehouse for MGI. Mamm Genome. 2015 Aug;26(7):325–30. doi: 10.1007/s00335-015-9573-z. [DOI] [PMC free article] [PubMed] [Google Scholar]
- Smith CL, Eppig JT. The Mammalian Phenotype Ontology as a unifying standard for experimental and high-throughput phenotyping data. Mammalian Genome. 2012 Oct;23(9–10):653–68. doi: 10.1007/s00335-012-9421-3. [DOI] [PMC free article] [PubMed] [Google Scholar]
- Smith CM, Finger JH, Kadin JA, Richardson JE, Ringwald M. The gene expression database for mouse development (GXD): Putting developmental expression information at your fingertips. Dev Dyn. 2014 Oct;243(10):1176–1186. doi: 10.1002/dvdy.24155. [DOI] [PMC free article] [PubMed] [Google Scholar]


