Abstract
We report here realization of ferroelectricity, ferromagnetism and magnetocapacitance effect in singleSrFe12O19ceramic at room temperature. The ceramics demonstrate a saturated polarization hysteresis loop, two nonlinear I-V peaks and large anomaly of dielectric constant near Curie temperature, which confirm the intrinsic ferroelectricity of SrFe12O19 ceramicswith subsequent heat-treatment in O2atmosphere. The remnant polarization of the SrFe12O19 ceramic is estimated to be 103μC/cm2. The ceramic also exhibits strong ferromagnetic characterization, the coercive field and remnant magnetic moment are 6192Oe and 35.8emu/g, respectively. Subsequent annealing SrFe12O19 ceramics in O2 plays a key role on revealing its intrinsic ferroelectricity and improving the ferromagnetism through transforming Fe2+ into Fe3+. By applying a magnetic field, the capacitance demonstrates remarkable change along with B field, the maximum rate of change in ε (Δε(B)/ε(0)) is 1174%, which reflects a giant magnetocapacitance effect in SrFe12O19. XPS and molecular magnetic moment measurements confirmed the transformation of Fe2+ into Fe3+ and removal of oxygen vacancies upon O2 heat treatment. These combined functional responses in SrFe12O19 ceramics opens substantial possibilities for applications in novel electric devices.
Introduction
Multiferroics is a class of functional materials that simultaneously exhibit ferroelectricity and ferromagnetism in a single structure [1–3]. They can demonstrate not only the magnetic or electric polarization but also the desired magnetoelectric (ME) coupling between the two orders leading to multifunctional performance, such as electric field controlled magnetic data storage or vice versa [4]. This unique coupling feature has a tremendous impact on technology, with potential application for spintronic devices, solid-state transformers, high sensitivity magnetic field sensors, and actuators [5]. As part of the technological drive toward device miniaturization, considerable effort has been devoted to the combination of electronic and magnetic properties into one multifunctional material, i.e., a single device component that can perform more than one task [5–9]. Such idea of combining two orders in one single compound has stimulated a vast research of new multiferroic materials [10–16]. Except the most heavily reported multiferroic compounds, such as BiFeO3 [1, 4, 5], TbMnO3 [17] and DyMnO3 [18], some ferrites with hexagonal structures, termed as hexaferrites, have been found to show such ME effects as magnetic field induced ferroelectrics and drawn our attention [19–21]. Although several Y-type and Z-type hexaferrites were reported to demonstrate some ME effects and remarkable changes in polarization upon a magnetic field [22–25], the ME effect in these ferrites is small, their pure electric polarization or ferroelectric features (P-E loops) arestill absent and the magnetism is weak [26]. For applications, however, it will be necessary to generate simultaneously ferroelectricity and ferromagnetism, together with giant ME effects in one single compound at room temperature. Hence, it is a long standing challenge in the research of multiferroics to improve the operating temperature [26] and the ME sensitivity [21, 27].
M-type lead hexaferrite (PbFe12O19) has demonstrated coexistence of large ferroelectricity and strong ferromagnetism at room temperature [28. 29]. However, lead (Pb) is a kind of toxic element and PbFe12O19 is not an environment-friendly material. SrFe12O19, instead, is a lead-free M-type hexaferrite and environment-friendly. It has attracted a lot of attention because of its non-toxicity, excellent magnetic properties and wide application in various fieldsuch as magnetic recording and high-frequency devices [30, 31]. Recently, the dielectric and ferroelectric features of M-type hexaferrites, such as BaFe12O19 single crystal, have attracted some attentions [32–34]. However, the authors claimed that M-type barium hexaferrite, belongs to quantum paraelectrics due to the electric dipole of a FeO5 bipyramid [32,33]. This kind of conclusion conflicts with the reported intrinsic ferroelectricity of PbFe12O19 [29]. After careful analysis of the structure data of the BaFe12O19 and SrFe12O19 single crystals [32–34], we found that the XRD patterns of the BaFe12O19 and SrFe12O19 single crystals are not consistent with that of magnetoplumbite-5H structure for M-type hexaferrites, i.e., the strong diffraction peaks from {110}, {007} and {114} lattice planes are absent. Those single crystals exhibited much higher symmetric structure than M-type hexaferrites. In addition, the single crystals were grown in a sealed furnace, which could result in heavy oxygen deficiency and induce the formation of large amountof oxygen vacancies and Fe2+ inside the crystals. Such crystals could producelarge current leakage during the electronic measurement and would appear a pseudo paraelectric phenomenon. Therefore the conclusion of quantum paraelectrics in those BaFe12O19 and SrFe12O19 single crystals [32–34] are not comparable with the ferroelectric behavior of PbFe12O19 specimen with magnetoplumbite structure. Actually, the doubtful ferroelectric property of SrFe12O19 ceramics with magnetoplumbite structure had already been reported several years ago in our previous study [35]; however, its ferroelectric hysteresis loops differ significantly from classic ferroelectric counterparts and resembled “bananas” due to the current leakage. Its ferroelectricityremains controversial and the banana-shaped P-E loops are not convincing evidence for its ferroelectricity [36]. The ME effect of SrFe12O19 has also not been investigated yet. Under this consideration,we optimized the fabrication process of the specimen by subsequent annealing SrFe12O19 specimen in oxygen atmosphere so as to remove the oxygen vacancies and transform Fe2+ into Fe3+. In this way, the current leakagewould be greatly reduced and a saturated P-E loop could appear as we did in PbFe12O19 specimens [29]. In this paper, we will then present the improved ferroelectric feature, enhanced impedance property, large dielectric anomaly near the Curie temperature, nonlinear I-V peaks, remarkable ME response, together with strong ferromagnetism in the M-type hexaferrite of SrFe12O19 ceramic specimen with subsequent O2 annealing process.
Materials and Methods
We started with the preparation of nano-crystalline SrFe12O19 powders by polymer precursor procedure. Strontium acetate (Sr(CH3COO)2•3H2O) (99.0%, Aladin) and ferric acetylacetonate (C15H21FeO6)(99.9%, Alfa Aesar) were used as starting material. First of all, 0.2467g strontium acetatewas dissolved in 15 mL glycerin to form a clear solution. The solution was distilled in a rotary evaporator at 120°C for 1 h to remove the water trapped in Sr(CH3COO)2•3H2O. The distilled solution was transferred into a 50 mL flask, which was moved into a glove box. In order to avoid hydrolysis of the C15H21FeO6 compound in air, the following chemical process was carried out inside a glove box with argonatmosphere. 4.026 g of ferric acetylacetonate was weighed and dissolved in a mixture solution of 100 mL anhydrous ethanol and 70 mL acetone in a 250 mL three-neck flask inside the glove box. The solution was stirred at 70°C for 6 hours to ensure that ferric acetylacetonate was fully dissolved. Subsequently, the strontium and ferric precursor solutions were mixed together. Here, the molar ratio of strontium to iron was set to 1:9.5~10 to balance the Sr loss during the heat treatment process. Afterwards, 45 mL ammonia solution and 15 mL solution of polyethylene glycol were poured into the above mixture solution. The dispersion solution was maintained at 70°C under stirring for 24 hours and then moved out of the glove box. The water and organic molecules were removed by centrifuging the dispersion solutionat 12000 rpm for 30 minutes. The remaining colloid powders were calcined at 450°C for 1 hour. The powders were grinded in a agate mortar for 1 hour and then calcined again at 800°C for another hour to ensure total removal of organic molecules. In this way, pure SrFe12O19 powders in a single phase were obtained. 0.060 g of SrFe12O19 powders were weighed and pressed in a module into a pellet, which was then sintered at 1150°C for 1 hour into a solid ceramic specimen. The ceramic pellet was subsequently annealed in pure O2 at 800°C for 3 hours. Then the ceramic pellet was turned over with upside down and the annealing process was repeated again for another 3 hours. After the furnace was cooling down to room temperature, the ceramic was heat-treated in pure O2 once more at 700°C for 3 hours. In this way, the oxygen vacancies could be removed and Fe2+ would be fully transformed into Fe3+, so as to greatly enhance the resistance of the ceramics and reduce the current leakage during the following ferroelectric measurement. Phase identification of the SrFe12O19 powder and ceramic was performed by X-ray powder diffraction (XRD) with Cu–Kα radiation. Magnetization was measured using a physical property measurement system (PPMS). For dielectric and ferroelectric measurement, both surfaces of the ceramic pellets were coated with silver paste as electrodes which was heat treated at 820°C for 15 min; the P-E hysteresis loop was measured using a lab-constructed instrument, referred to ZT-IA ferroelectric measurement system. The temperature-dependent dielectric properties were measured by an LCR instrument (HP 8248A). The complex impedance spectrum was measured upon a electrochemical station (Chenghua) within the frequency range of 0.01Hz ~ 1MHz. The magnetocapacitance parameters of the SrFe12O19 pellet were measured using a Wayne Kerr 6500B LCR station by applying a variable magnetic field.
Results and Discussion
1. Structure Identification of SrFe12O19 compound
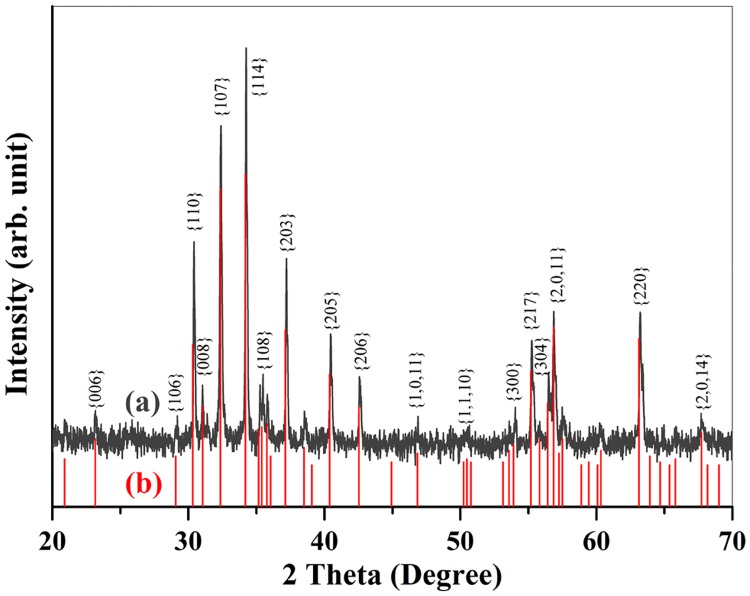
Fig 1a shows the X-Ray diffraction (XRD) pattern of the as-preparedSrFe12O19 specimen, the underneath lines in red color are the standard diffraction spectrum of SrFe12O19 (PDF#33–1340). The single-phase SrFe12O19 powders has been fabricated by sintering at 1150°C for 1h and subsequently annealed in O2 by 3 steps for a total duration of 9 hours with 3 steps wise.
Fig 1.
(a) XRD pattern of SrFe12O19 with O2 annealing process. (b) the standard diffraction pattern of the SrFe12O19(PDF#33–1340) being marked by discrete red lines.
It can be seen from Fig 1 that all the diffractions peaks of the oxygen annealed specimen match well with the corresponding ones from the standard cards (PDF#33–1340), indicating the formation of pure SrFe12O19. No diffraction peaks from any second ferrite phases or impurity compounds have been indexed in the pattern, revealing the stability of the magnetoplumbite structure SrFe12O19 being sintered at 1150°C. This diffraction pattern is completely different from that of reported SrFe12O19 single crystals [32–34], which exhibit much higher symmetry and is lacking the strongest diffraction peaks form {110}, {007} and {114} lattice planes of typical M-type hexaferrites. Since the structure of our fabricated SrFe12O19 ceramics is different from those SrFe12O19 crystals reported in the literatures [32–34], the symmetry and electric properties should also differ significantly.
2. Electric Properties of SrFe12O19 Ceramics
In order to check out if oxygen annealing process could remove the oxygen vacancies and transform Fe2+ into Fe3+, we measured the complex impedance spectrum of the SrFe12O19 ceramics with and without O2 annealing by an electrochemical station. The annealing process was carried out in 3 steps, firstly the sintered ceramic was heat treated in O2 atmosphere in a sealed tube furnace at 800°C for 3 hours, then the specimen was turning over with upside down and once again annealed at the same temperature for another 3 hours, finally the annealed specimen was heat treated at 700°Cfor 3 hours. The complex impedance of PbFe12O19 can be expressed as follows:
| (1) |
and the module of the complex impedance is expressed as:
| (2) |
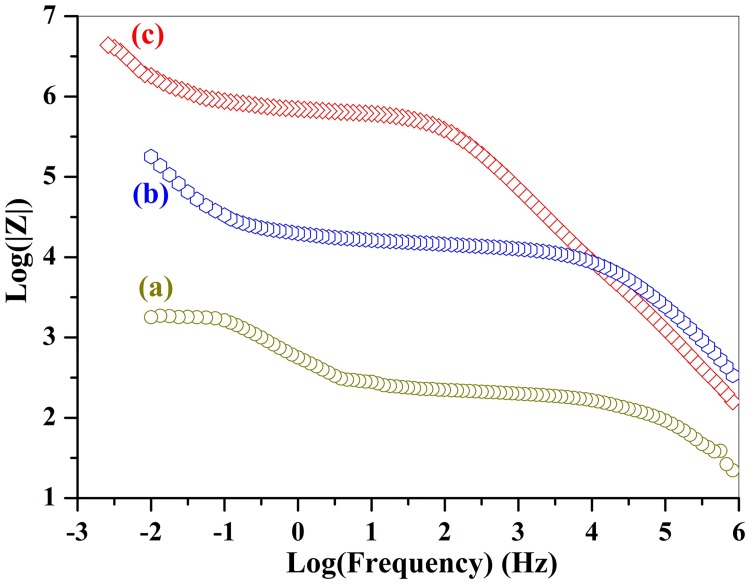
Then we measured the complex impedance spectra of the specimens at each annealing step to show how the properties continually improve as the Fe2+ transforms to Fe3+. Fig 2 exhibits the modules of complex impedance for the SrFe12O19 ceramics without and with oxygen heat-treatment, respectively. The modules represents the magnitude of the impedance or electric resistance, which reflects concentration of oxygen vacancies and Fe2+ in SrFe12O19 ceramics. The higher is the module, the lower is the concentration of these charge carriers.
Fig 2. Modules of the complex impedance for (a) the conventional SrFe12O19 ceramics being sintered at 1150°C in air only, (b) the sintered ceramic was subsequently annealed in pure oxygen atmosphere at 800°Cfor 3 hours, (c) the annealed ceramic was flipping over and once again heat treated in O2at 800°C for another 3 hours.
The impedance module or electric resistance of the specimen with O2 heat-treatment is much higher than that of the ceramic without O2 treatment within the whole frequency region. The electric resistance (impedance module) of the SrFe12O19 ceramic without O2 annealing process is only 1.8×10³ Ω, which is enhanced to 1.82×10⁵ Ω after first step O2 treatment. The electric resistance is further promoted to 7.9×10⁶ Ω at a frequency of 0.01 Hz after the second step O2 annealing process. The third step annealing process didn't change the module of impedance very much. The total electric resistance (impedance module) of the SrFe12O19 ceramic was enhanced by a factor of 4389 after annealing in O2 in 3 steps wise. The great enhancement of the resistance reveals the drastic reduction of the concentration of the oxygen vacancies and full conversion of Fe2+ into Fe3+, since the current leakage from oxygen vacancies and electronic hopping between Fe2+ and Fe3+ has been precluded.
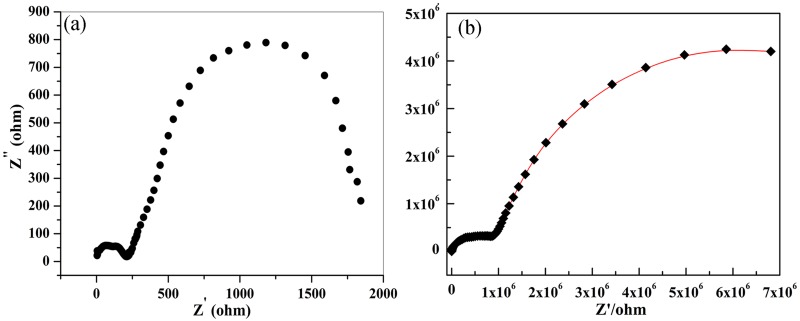
Fig 3a represents the complex impedance spectrum of SrFe12O19 ceramic without subsequent O2 annealing process. The spectrum is composed of a small Cole circle with a diameter of 215 and a large Cole one with a diameter of 1627. Each circle represents a circuit composed of a capacitor and a resistor which are connected in parallel. The two linked Cole circles could then be expressed as two such equivalent series connected circuits, as being shown in Fig 4. The small Cole circle contributes from the grain boundaries and the large one from the grains in SrFe12O19 ceramics. Fig 3(b) demonstrates a more complicated impedance spectrum for SrFe12O19 ceramics after O2 annealing process. The equivalent circuitfor the spectrum could also be expressed as two series linked circuits, each one is composed of a capacitor and a resistor being parallel connected (Fig 4). Each Cole circle corresponds to one individual circuit, one for grains and the other one for grain boundaries. Similarly, the spectrum is composed of a small Cole circle and a big half Cole circle, the diameter of the small one is estimated to be 9.0×10⁵ and that of large one is 9.8×10⁶. Obviously, the contribution of the impedance from both grain boundaries and grains in SrFe12O19 ceramics with subsequent O2 heat-treatment have been greatly enhanced in comparison with that without O2 annealing process. Both real and imaginary parts of the impedance have been promoted more than 1000 times after O2 heat-treatment.
Fig 3. Complex impedance spectrum of the SrFe12O19 ceramic within the frequency range of 0.01 Hz to 1 MHz, (a) for the ceramic being sintered at 1150°C in air only; (b) for the sintered ceramic with subsequent annealing in O2.
Fig 4. The equivalent circuit for the complex impedance of SrFe12O19 ceramics, the scheme is composed of two series linked sub-circuits with a capacitor and a resistor parallelly connected.
3. The Impact of O2 Treatment on Charge Transfer by XPS
The heat treatment of the sintered SrFe12O19 ceramics in oxygen atmosphere plays a key role on enhancement of their electric resistance through removal of oxygen vacancies and transformation of Fe2+ into Fe3+. The change in concentration of these charge carriers could be detected by X-ray photoemission spectrum (XPS). We collected XPS data for two specimens, one is sintered SrFe12O19 ceramic without O2 heat treatment, the other one is the SrFe12O19 ceramic with subsequent O2 heat treatment at 3 steps wise. We did analysis on Fe 2p energy levels and shallow region of the valence bands for the two specimens.
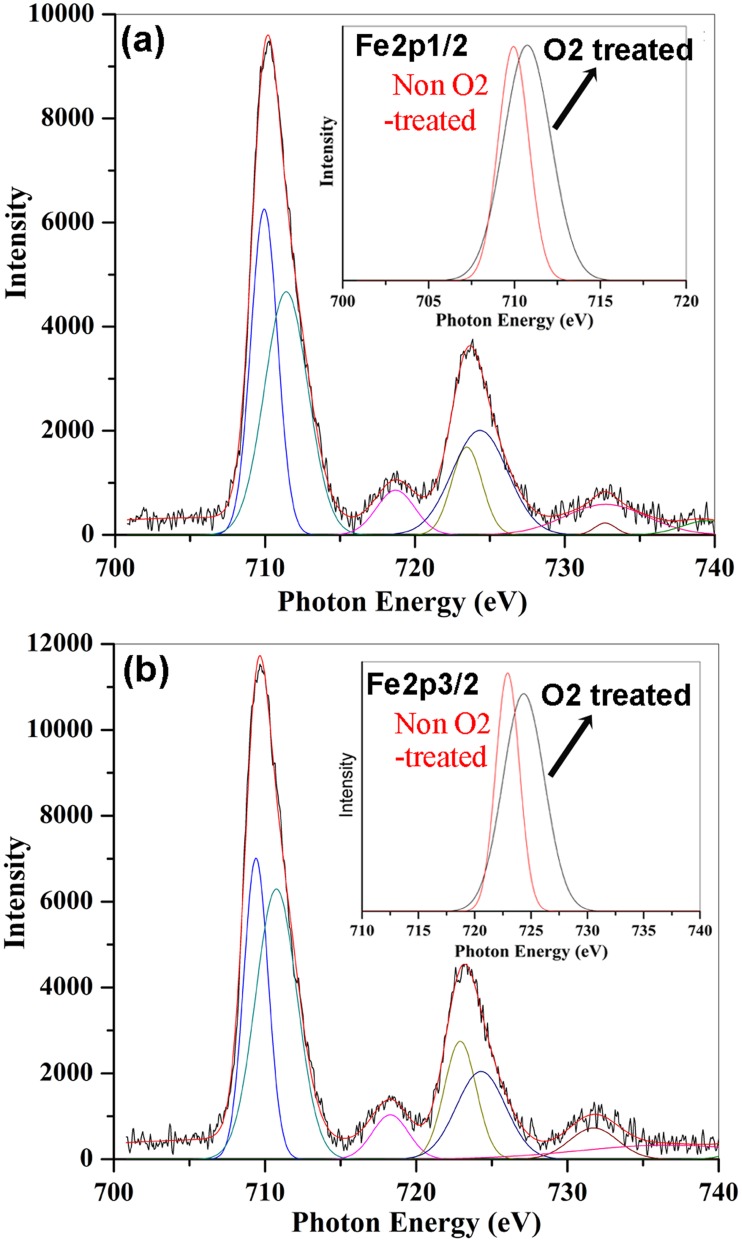
Fig 5 shows the spectra of Fe 2p energy levels for sintered SrFe12O19 ceramics with and without subsequent O2 annealing process. The Fe 2p3/2 peaks are centered at 710.4 eV and 709.68 eV for O2 treated specimen and non-O2 treated specimen, while that of Fe 2p1/2 peaks are positioned to 723.84 eV and 723.09 eV for O2 and non-O2 treated specimens, respectively. There appear chemical shifts of 0.72eV and 0.75 eV for Fe 2p3/2 and 2p1/2 lines between the two specimens, respectively. Both Fe 2p1/2 and 2p3/2 spectra are asymmetric and could be fitted into two symmetric peaks (Fig 5). The binding energies of the upper Fe 2p3/2 and 2p1/2 lines are fitted to be 711.41 eV and 710.5 eV, while that of lower fitting lines are positionedto 709.94 eV and 709.4 eV for O2 and non-O2 treated specimens, respectively. The chemical shifts of the fitting Fe 2p lines are displayed in the insets of Fig 5. Usually, the binding energies of 2p states of Fe2+ are lower than that of Fe3+. For example, the binding energy of Fe 2p3/2 in FeCl3 was measured to be 711.3 eV [37], while that in FeCl2 was 710.6 eV [37]. There was a chemical shift of 0.7 eV for the Fe 2p3/2 state between FeCl3 (Fe3+) andFe Cl2 (Fe2+). In our case, the binding energy of upper Fe 2p3/2 lines hifts from 710.5 eV to 711.41 eV after SrFe12O19 ceramic was heat treated in O2. The chemical shift of 0.91 eV appears between two specimens. The binding energy of upper Fe 2p3/2 line at 711.41 eV for O2 treated specimen is consistent with the value of Fe 2p3/2 line in FeCl3 (Fe3+) compound [37], indicating the existence of full Fe3+ in O-treated specimen. The lower binding energy of upper Fe 2p3/2 line at 710.5 eV indicates the existence of Fe2+ in non-O2 treated specimen. Both upper and lower Fe 2p3/2 and 2p1/2 states in non-O2 treated SrFe12O19 ceramic specimen indicates the existence of Fe2+ due to the chemical shifts. The binding energies of Fe 2p3/2 and 2p1/2 states shift toward higher energy side after the SrFe12O19 ceramics were subsequently annealed in O2 atmosphere, indicating the transformation of Fe2+ ions into Fe3+ ions with O2 treatment.
Fig 5. XPS spectrum for Fe 2p energy levels of the sintered SrFe12O19 ceramics (a) with O2 treatment and (b) without O2 treatment.
The insets display the upper Fe2p1/2 and Fe 2p2/3 lines for the two specimens, respectively.
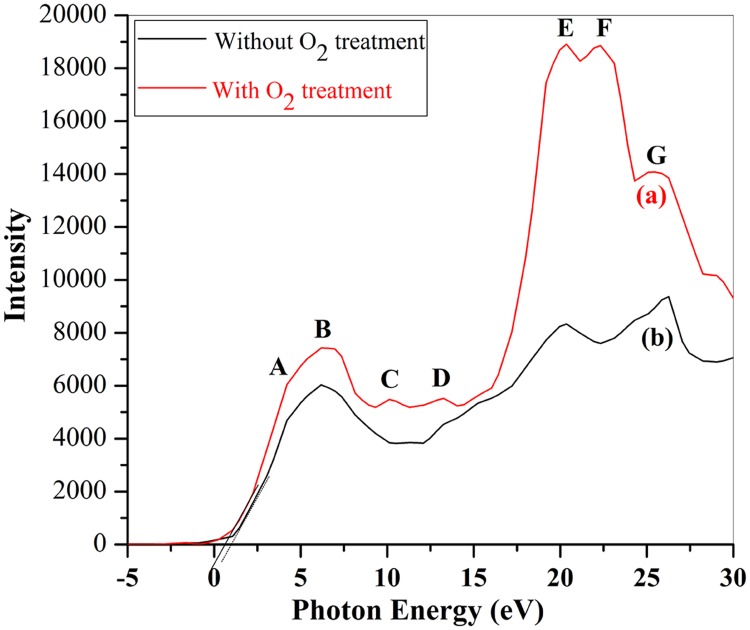
Such charge transfer in Fe ions could be further confirmed by the Fe 3d states within the valence band region. Fig 6 shows valence band structure of SrFe12O19 ceramic with and without O2 treatment. There is large difference between the two spectra either in peak positions or the density of states. There are 7 peaks being marked by A, B,…,G in Fig 6. The binding energies and attribution of each peak are summarized in Table 1. Considering calculated electron density of states (DOS) of BiFeO3 and SeFe12O19 [38,39], we may assign both peaks A and B to the hybridized Fe 3d-O 2p states, peaks C and D to O 2p levels, peaks E, F and G to O 2s state which splits into 3 sub-energy levels. By comparing with the two valence band spectra, we could find that the density of hybridized Fe 3d-O 2p states (peaks A&B) has been enhanced after the specimen was O2 heat treated. The increment in density of Fe 3d state indicates more Fe3+ ions existing in the O2 treated specimen than that in non-O2 treated one, since Fe3+ions have one more unpaired 3d electron to be hybridized with O 2p electrons than Fe2+ ions. Both Fe 2p and 3d states in XPS spectra of SrFe12O19 ceramics confirmed the transformation of Fe2+ into Fe3+ after the ceramics were subsequently annealed in pure O2 atmosphere.
Fig 6. Valence band spectra of SrFe12O19 ceramics (a) with O2 heat treatment and (b) without O2 heat treatment.
The dotted lines marked the top of the valence band.
Table 1. Valence band states assignment.
| Peak | A | B | C | D | E | F | G |
|---|---|---|---|---|---|---|---|
| Binding Energy | 4.18(eV) | 6.22(eV) | 10.06(eV) | 13.27(eV) | 20.32(eV) | 22.37(eV) | 25.73(eV) |
| Assignment | Fe3d+O2p | Fe3d+O2p | O 2p | O 2p | O 2s | O 2s | O 2s |
It can be seen from Fig 6 that there appear full O 2p and 2s states in O2-treated SrFe12O19 ceramic, while two O 2p states of peaks C and D are absent in non-O2 treated SrFe12O19 ceramic. The density of O 2s states (peaks E, F and G) in O2-treated specimen are much higher than that of SrFe12O19 ceramic without O2 heat treatment, the intensity of peaks E and F increases from around 8306 (Fig 6b) for the non-O2 treated specimen to around 18922 (Fig 6a) for the O2 treated specimen. The great enhancement of density of O 2s and O 2p states indicates largely reduction of oxygen vacancies for the SrFe12O19 ceramics after O2 heat treatment. When the SrFe12O19 pellet was sintered inside a sealed furnace into ceramics, large numbers of Fe2+ would be formed and the excess oxygen would exist in the form of oxygen vacancies due to oxygen deficiency. The oxygen vacancies, however, are positively charged only and have no such 2s and 2p electrons as those around the atomic nucleus in oxygen ions. Therefore the density of O 2s and 2p states are much more depressed in the valence spectrum (Fig 6b) of non-O2 treated SrFe12O19 ceramics due to the appearance of high concentration of oxygen vacancies. The higher is the content of oxygen vacancies, the lower is the valence electron density. After the SrFe12O19 ceramics are subsequently heat treated in pure O2 atmosphere, Fe2+ ions are oxidized to Fe3+ and oxygen vacancies could be greatly reduced and be replaced by oxygen ions, as such the density of O 2s and 2p states are greatly improved. Therefore, the appearance of additional two O 2p states (peaks C and D) as well as the great enhancement of the density of O 2s states confirm the removal or great reduction of oxygen vacancies after the specimen was annealed in O2 atmosphere. This result is consistent with the enhancement of electric resistance after the specimen was heat treated in O2. Meanwhile, the valence band edge of SrFe12O19 shifts upwards 0.39 eV after it was annealed in O2 atmosphere.
4. Dielectric Relaxation of O2-Treated SrFe12O19 Ceramics
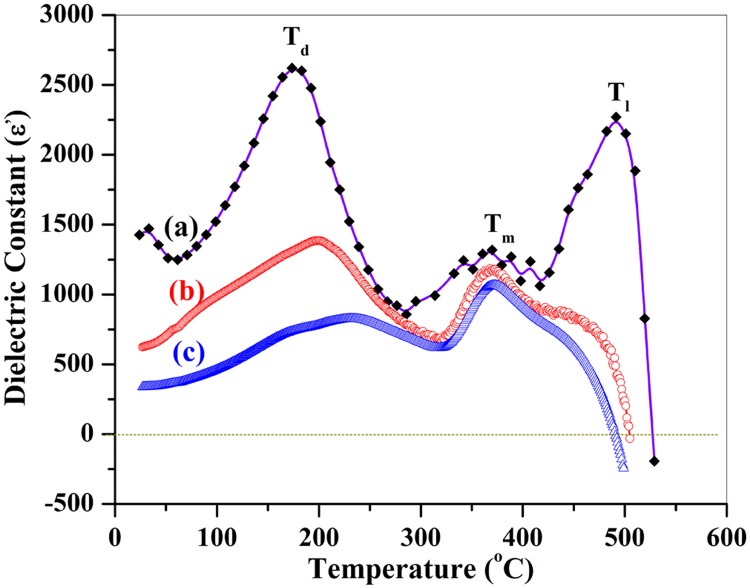
We then measured the dielectric relaxation behavior of O2 treated SrFe12O19 ceramicsby a HP4284A LCR instrument. Fig 7 shows the temperature-dependent dielectric constants of the specimen at different frequencies of 1kHz, 10kHz and 100 kHz. At 1kHz, there appear three peaks, locating at 174°C, 368°C and 490°C (Fig 7a), the first two peaks are similar to that of PbFe12O19 corresponding to two kinds of phase-transitions [29]. Similarly, the first peak Td could be assigned to the ferroelectric to anti-ferroelectric phase transition, while the second one (Tm) to the anti-ferroelectric to para-electric phase transition. The maximum dielectric constant at Td is 2621. The third peak is attributed from a complicated phase transition. Since the dielectric constant (ε) becomes negative when temperature is higher than 527°C (Fig 7), the phase structure could then be assigned to a so-called "left hand materials (LHM)" whose dielectric constant is less than 0. Therefore the third peak (Tl = 527°C) is proposed to be the phase transition from para-electric phase to LHM.
Fig 7. Plot of dielectric constant as a function of temperature for SrFe12O19 ceramics with O2 treatment at frequencies of (a) 1kHz, (b) 10kHz and (c) 100 kHz.
The first transition peak is sensitive to the frequency, the larger is the frequency, the higher is the transition temperature. When the frequency increases from 1 kHz to 10 kHz, the first transition peak shifts from 174°C to 199°C and the maximum dielectric constant drops from 2261 to 1394. Further increasing the frequency from 10 kHz to 100 kHz, this peak shifts to 239°C and the maximum dielectric constant decreases from 1394 to 847. However, the second transition peaks didn't move accordingly, while the third peak (Tl) moves to the opposite direction, the higher is the frequency, the lower is the transition temperature.
The temperature of the first dielectric constant peak show large shifts with frequencies, suggesting that SrFe12O19 is a relaxor ferroelectric compound with a diffuse phase transition. At 1kHz, the maximum ε-T peak (490°C) demonstrates a strong ferroelectric to antiferroelectric phase transition, associated with a broad ε (T) anomaly near the vicinity of the transition temperature. These kinds of dielectric anomalies at different frequencies provides additional evidence for the ferroelectricity of SrFe12O19.
Upon the anomalies of the dielectric constants, we then made the calculation of the reciprocal dielectric constants as a function of temperature using modified Curie-Weiss law, being expressed as follows:
| (3) |
where γ is the critical exponent, representing the degree of diffuseness of the transition, and C is a Curie–Weiss-like constant. εm is the maximum dielectric constant at temperature of transition peak Tm. For a sharp transition, γ = 1, the materials are called normal ferroelectrics. Diffuse transitions lie in the range 1 <γ< 2 [40], whereas at γ = 2 the materials correspond to a so-called “complete” diffuse phase. When γ> 2, the materials would take a diffuse phase transition from ferroelectrics to anti-ferroelectrics or antiferroelectrics to paraelectricity [29].
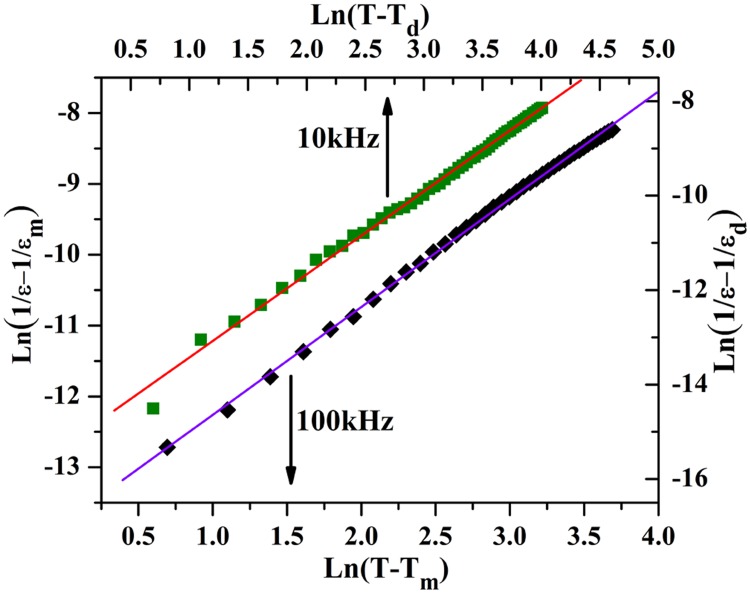
Fig 8 shows plots of Ln(1/ε-1/εd) as a function of Ln(T-Td) at 10 kHz and Ln(1/ε-1/εm) as a function of Ln(T-Tm) at 100kHz for SrFe12O19 ceramic, respectively. Linear fitting to the experimental datausing Curie-Weissformula derives out the slope of the fitting lines, which were determined to be γ = 2.3 and 2.2 at frequencies of 10 KHz and 100kHz, respectively. The calculated lines following Curie-Weiss formula fit well with the experimental data points. The linear relationship between Ln(1/ε-1/εm) and Ln(T-Tm) reveals that the temperature dependence of the dielectric constant obeys the Curie–Weiss law, providing additional evidence for the relaxor ferroelectric feature of the SrFe12O19 ceramics.
Fig 8. Modified Curie-Weiss law calculation.
(a) Logarithm of (1/ε-1/εd) as a function of logarithm of (T-Td) at 10 kHz. and (b) logarithm of (1/ε-1/εm) as a function of logarithm of (T-Tm) at 100 kHz for the SrFe12O19 ceramic being sintered at 1150°C for 1 hour and subsequently annealed in O2 for 9 hours with 3 steps wise.
5. Ferroelectric Polarization of SrFe12O19 Ceramics
The ferroelectric P-E loop of the SrFe12O19 ceramics without O2 heat-treatment was looking like a "banana" (Figure E in S1 File) [35], which had drawn lots of doubts on the validity of its ferroelectricity. Considering that the "banana" shaped P-E loop (Figure E in S1 File) could be induced by current leakage and the necessity of confirming the validity of its ferroelectricity, we then heat treated the SrFe12O19 ceramics in pure oxygen atmosphere for total duration of 9 hours with 3 steps wise, so as to greatly enhance its resistance through reducing the concentration of charge carriers. The great reduction of the concentration of charge carriers, such as oxygen vacancies and Fe2+ by annealing the ceramics in oxygen,could dramatically reduce the current leakage and thus saturate the ferroelectric hysteresis loop of the SrFe12O19 ceramics.
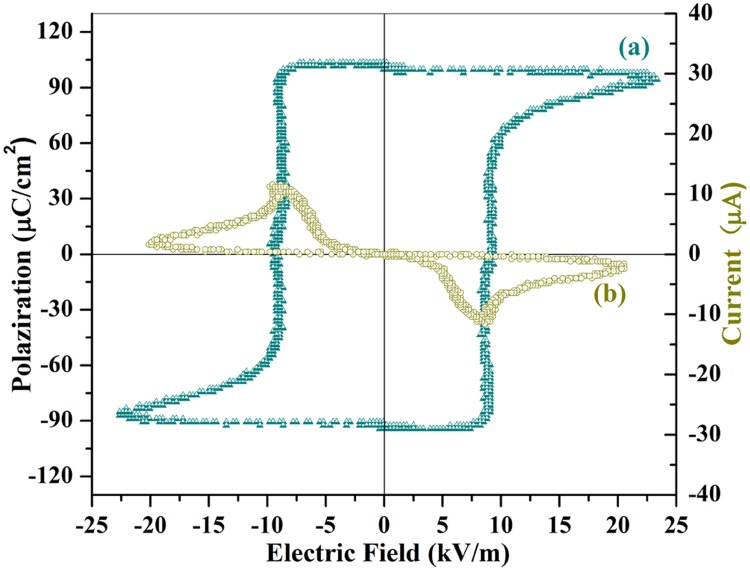
Fig 9 shows a fully saturated ferroelectric hysteresis (P-E) loop of the SrFe12O19 ceramic with O2 annealing process. A drastic variation of the polarization appears in the vicinity of the specimen’s coercive field at around 10 kV/m. Further increasing the applied field up to 25 kV/m, the polarization of the ceramic gradually approaches to saturation along with a concave arc line (Fig 9a).
Fig 9. (a) The saturated ferroelectric polarization hysteresis (P-E) loop, and (b) a plot of current as a function of voltage (I-V curve) of SrFe12O19 ceramic.
The ceramic has been sintered at 1150°C for 1 hour and subsequently annealed at 800°C in pure oxygen for a total duration of 9 hours in 3 steps wise. The measurement was made at a frequency of 33Hz and room temperature (300K).
When the applied field decreases, the polarization remains at the value of saturation because most of the ceramic’s domains still align themselves along the electric field’s direction. The spontaneous polarization, which is equal to the saturation value of the electric displacement extrapolated to the zero-field strength, remains almost constant with external field variations. This result reveals that all the electric displacement dipoles have aligned themselves along the direction of the external field until the external field was less than the negative coercive field of the ceramics. When the applied field switched to the reversal direction, the spontaneous polarization demonstrated a hysteresis and changedthe direction suddenly at the position of negative coercive field. The polarization voltage changes signs to be negative and approaches to the negative saturated value along with a reversal concave arc line (Fig 9a) within the field range of -10 kV/m to -25 kV/m. The remnant polarization in this classic hysteresis loop is estimated to be103μC/cm2, which is around 8.3 times higher than that (15μC/cm2) of SrFe12O19 ceramics without subsequent heat treatment in O2 [35]. Therefore subsequent annealing SrFe12O19 ceramics in oxygen not only saturated the hysteresis loop, but also greatly improved the remnant polarization value through reducing the current leakage, which results from the removal of oxygen vacancies and the transformation of Fe2+ to Fe3+ [28, 29]. Similar ferroelectric hysteresis loops being measured on different SrFe12O19 ceramic specimens are supplied in the S1 File (Supplementary Materials), so as to confirm the reliability and repetitiveness of ferroelectric data.
The last evidence for the validity of ferroelectricity for SrFe12O19 ceramics would be attributed from the appearance of two current peaks at I-V plot (Fig 9b) along with the polarization switching. When the ferroelectric polarization is switching, the screening surface charges flow from one electrode to the other one and create momentarily a sudden change of current. In the current versus voltage plot, this will result in two peaks with reversal directions as being shown in Fig 9(b). The two nonlinear I-V peaks show very clearly the switching phenomenon of the polarization and does not present any linear current component (or current leakage component). The two I-V peaks are similar to that of typical ferroelectric compounds (Pb(Zr0.4Ti0.6)O3and LiNbO3) [41] and could convince us that the P-E hysteresis loop indeed origins from the ferroelectric polarization instead of current leakage. The origin of the ferroelectricity of SrFe12O19 ceramics is similar to that of PbFe12O19 and has been discussed in detail in our previous literatures [28, 29], since both compounds share the same crystal structure. The off-center shift of the Fe3+ ions and the displacement of O2- ions from its original corner positions in the FeO6 octahedron are supposed to be the origin of electric polarization in SrFe12O19 too [28, 29]. The saturated ferroelectric hysteresis loop, two peaks in the I-V curve, the giant anomalies of the dielectric constant in the vicinity of the transition temperatures (Tm and Td) as well as the comply of the reciprocal dielectric constant with modified Curie Weiss law provide us with enough evidences to prove the intrinsic ferroelectricity of SrFe12O19 ceramics.
This result is quite different from that reported M-type hexaferrtie single crystals, which were claimed to be a new family of magnetic quantum paraelectrics and retained paraelectric symmetry down to zero temperature [32–34]. Actually those crystals showed different crystal structure with higher symmetry and were grown in a sealed furnace without subsequent heat-treatment in oxygen atmosphere. There would be high concentration of oxygen vacancies and Fe2+ ions inside the crystals. These kinds of carrier charges would reduce the electric resistance of the crystals and induce large current leakage during the electric measurement. As such no saturated polarization hysteresis loop could be observed in these crystals. Both different crystal structure and low concentration of carrier charges make our ceramic specimens differ significantly from those crystals in ferroelectric and dielectric properties.
6. Magnetic Properties of SrFe12O19 Compound
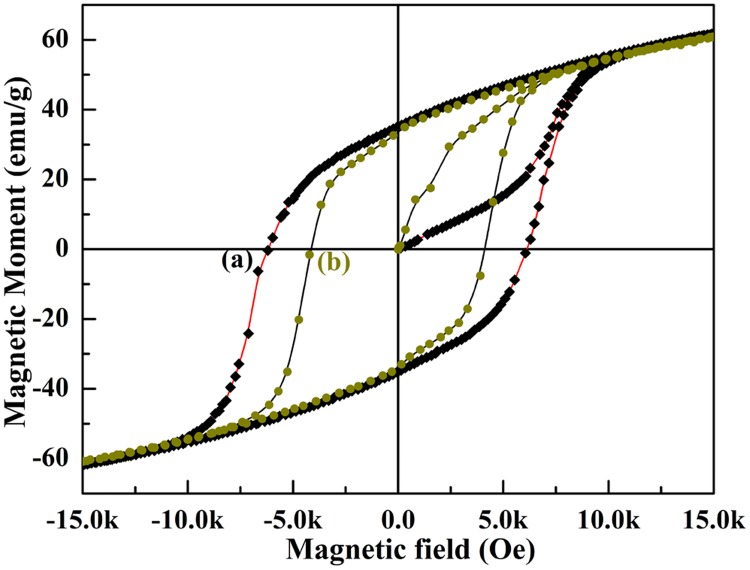
For magnetic measurement, the SrFe12O19 powders were prepared with the same heat-treatment history as that of above ceramics. The magnetic measurement was made upon SrFe12O19 powders by the Physical Property Measurement System (PPMS) at room temperature. Fig 10 exhibits the ferromagnetic hysteresis loops of SrFe12O19 powders with and without O2 heat-treatment. It can be seen that magnetic properties of SrFe12O19 have been greatly improved by annealing the powders in oxygen atmosphere. The coercive fields of the SrFe12O19 powders with O2 treatment reaches as high as 6192 Oe, while that of the same powders without O2 treatment is 4111 Oe. The coercive field has been promoted 2081 Oe through O2 heat-treatment. The remnant magnetic moment has also been enhanced from 33.5 emu/g to 35.8 emu/g after annealing the SrFe12O19 powders in oxygen atmosphere. The increase in remnant magnetization is quite modest since the applied magnetic field is not high enough to have all of the domains align themselves parallelly to the external field. Such promotion of magnetic polarization was also observed in M-type lead hexaferrite (PbFe12O19) after annealing in O2 atmosphere [29].
Fig 10. Magnetic hysteresis loop of SrFe12O19 (a) being sintered at 1150°C for 1 h and subsequently annealed in O2 for 9 hs with 3 steps wise, (b) without heat-treatment in O2.
The heat-treatment in oxygen atmosphere transformed Fe2+ into Fe3+, which provides one more unpaired electron spin for magnetic polarization of SrFe12O19. The existence of more Fe3+ in SrFe12O19 would promote its magnetic properties. On the other hand, a certain content of Fe2+ existing in SrFe12O19 which results from sintering the ceramics in a oxygen deficient atmosphere, such as a sealed air furnace, would reduce its ability for magnetic polarization and degrade its magnetic properties since Fe2+ contains one less electron spins than Fe3+.
The evidence for increment of Fe3+ content in SrFe12O19 ceramics after O2 treatment is the great promotion of the coercive magnetic field in the M-H loop of Fig 10. The coercive field is the intensity of the applied magnetic field required to reduce the magnetization of that material to zero after the magnetization of the sample has been driven to saturation. This value reflects the ability of spontaneous magnetic polarization of the magnetic materials. All the magnetic dipoles or spins are aligned anti-parallelly to the external magnetic field at the coercive point, whose value equals to the full magnetization in the opposite direction to withstand an external magnetic field without becoming demagnetization. The more is the content of Fe3+ in SrFe12O19 compound, the higher is the concentration of unpaired electron spins and thus the larger is the ability of its full spontaneous magnetic polarization, which would need higher external magnetic field to balance the anti-parallelly aligned magnetic dipoles or spins. Therefore the coercive field would be promoted if there are more Fe3+ ions than Fe2+ ions in SrFe12O19 compound. When the dipoles or spins are all anti-parallelly aligned to the external field at the coercive point of -4154 Oe with 0 magnetization in SrFe12O19 ceramics without O2 treatment (Fig 10a), there are still many parallelly aligned dipoles or spins in the O2 treated SrFe12O19 ceramics, whose net magnetization still remains at 21.05 emu/g at this point (Fig 10b & Figure A in S1 File). By comparing the increase of Bohr magnetrons at this field point (-4154 Oe) between the two samples, we are able to estimate the number of Fe2+ that converts to Fe3+.
Under this consideration, we calculated the molar susceptilbility from the measured B-H datasets of both samples through the equation:
| (4) |
where χ = B/H (B = magnetic moment in emu, H = external field in Oe), M is the molar mass of SrFe12O19, w is the weight of the sample. Afterwards, the molar susceptilbility is converted to molecule magnetic moments by the equation:
| (5) |
where L = 6.022×10²³ mol-1 (Avogadro's number), k = 1.380×10⁻²³ J·K-1 (Boltzmann constant), μ0 = 4π×10-7N·A-2 (vacuum permeability), T = temperature. The field dependent molecule magnetic moments are displayed in the (Figure A in S1 File). Upon the value of molecule magnetic moments, the unpaired electron numbers could then be calculated through the equation of , where μB = eh/2m = 9.274 × 10⁻²⁴ J·T−1 (Bohr magnetron, h is the Planck constant), n is the number of unpaired electrons, μm is molecule magnetic moments. In this way, μm is calculated to be 0.9285×10⁻²³ J·T-1 and 3.3759 ×10⁻²³ J·T-1 for the non-O2 treated and O2 treated SrFe12O19 ceramics at point of -4154 Oe, which is the coercive field of the non-O2 treated sample (Fig 10a & Figure A in S1 File). Finally, the number of unpaired electrons is determined to be n1 = 0.414 and n2 = 2.772 for the non-O2 treated and O2 treated SrFe12O19 ceramics, respectively. Therefore, the difference of the unpaired electron numbers between two samples is Δn = n2 –n1 = 2.358. At this point of view, The second sample (O2 treated SrFe12O19 ceramic) has around 2.4 more unpaired electrons than the first one (non-O2 treated SrFe12O19 ceramic), indicating that around 2.4 Fe2+ ions convert to Fe3+ ions after the SrFe12O19 ceramic was heat treated in O2atmosphere.
Therefore heat-treatment of SrFe12O19 in oxygen would not only improve the ferroelectric polarization performance but could also enhance the ferromagnetic properties through transforming Fe2+ into Fe3+. The large hysteresis loop reflects the strong magnetic feature of SrFe12O19. The above combined results demonstrate the simultaneous occurrence of large ferroelectricity and strong ferromagnetism in the single SrFe12O19 compound at room temperature. It allows us to expect a new generation of electronic devices being made of such a practicable multiferroic candidate, in which large ferroelectricity and strong ferromagnetism coexist.
7. Magnetocapacitance Effect of SrFe12O19 Ceramics
Previous studies on certain rare-earth manganites [6, 42] suggested that materials having long wavelength magnetic structures often exhibit a strong interplay between magnetic ordering and ferroelectricity, which makes the capacitance of the manganites [43] and Y-type hexaferrites exhibit great response to the B field [44]. In order to check out if the M-type strontium hexaferrite (SrFe12O19) could also generate such coupling response upon an external magnetic field, we set up a simple system for the ME coupling measurement, which was performed by measuring the capacitance as a function of the magnetic field (B). The SrFe12O19 ceramic was coated with silver electrodes on both sides and then placed in a space between two electromagnets. Upon the application of the magnetic field, the Wayne Kerr 6500B LCR Precision impedance analyzer, which was linked with the electrodes on both surfaces of the ceramic, would output the variable capacitance with the external magnetic field B. The B-field-dependent relative magnetic permeability was calculated using a defined formula, which can be expressed as follows [45]:
| (6) |
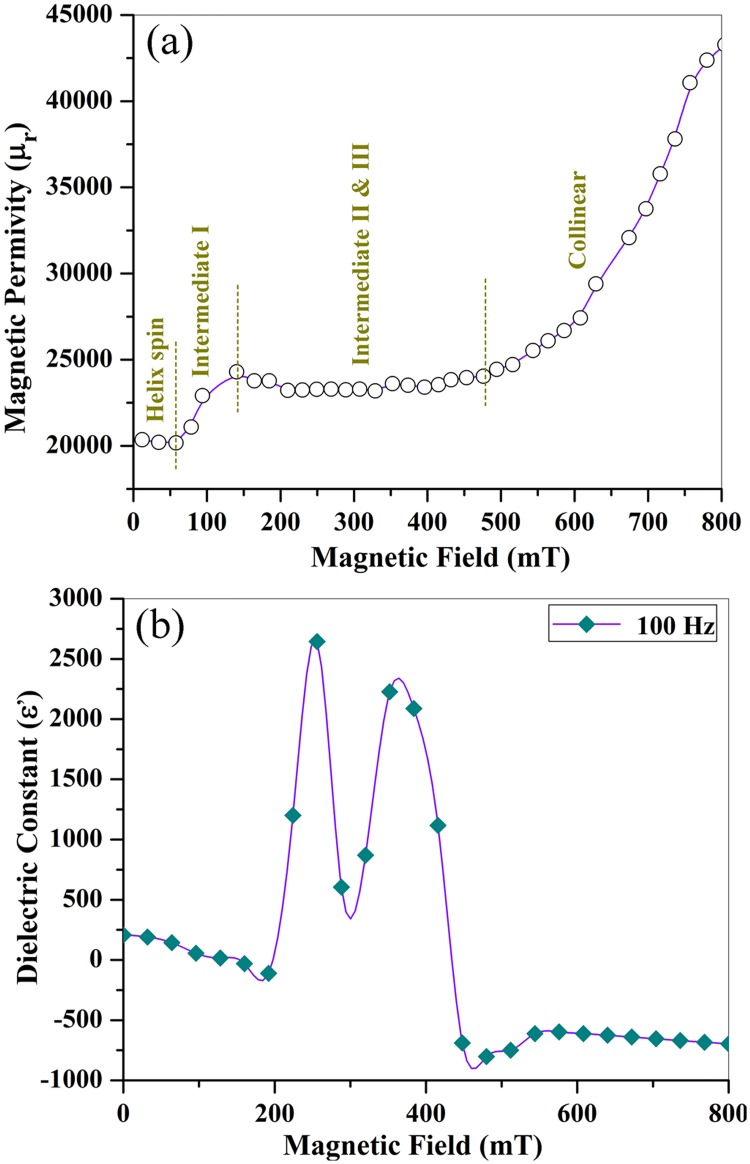
where Z(T) is the complex impedance when magnetic field B = T, Z(0) the impedance for B = 0; μ0 is the vacuum permeability, h is the space between two magnets, c and b are the inner and outer radius of the ring magnets. Fig 11 displays the dependence of the relative magnetic permeability (μr) on B and the change in ε (or magnetocapacitance) along with B field. It can be seen from Fig 11a that μr increases in a stepwise fashion, which is attributed to the evolution in magnetic structures. Five successive magnetoelectric phases could be thus mapped out: the first terrace (0<B<55mT) for modified helix, the ramp (55mT<B<150mT) for intermediate I, the second terrace (140mT<B<480mT) for intermediate II and III. The collinear ferrimagnetic phase is assigned to the region (480mT<B<883mT) with a rather large slope in μr. These magnetic phases has been delimited by yellow dot lines (Fig 11a).
Fig 11. Giant magnetocapacitance effect: (a) B-dependent magnetic permeability (μr) and delimited magnetic phase profile; (b) variable dielectric constant as a function of B field for the O2 treated SrFe12O19 ceramics at a frequency of 100Hz and room temperature (300K).
Fig 11b displays great response of the capacity (or ε) to the applied magnetic field (B). The dramatic variation of dielectric constant with B field is similar to that of M-type BaFe12-xScxO19 [42] and Y-type hexaferrite Ba0.5Sr1.5Zn2(Fe1-xAlx)12O22 [20], and is associated with the magnetic phase transition along with B field. Within helix and intermediate I phases in range of 0~150 mT, the dielectric constant displays a downward slope line with small declining value (from 208.2 to -134.5). However, when B comes into the Intermediate II phase, the dielectric constant increases rapidly from -134.5 to 2650. The great change in ε is expressed as two remarkable peak structures centered in the middle of Intermediate II phase (254 mT) and III phase (363 mT), respectively (Fig 11b). The maximum dielectric constants of the two peaks are determined to be 2650 and 2340, respectively. The dielectric constants show rapid drops at the magnetic boundary between Intermediate II and III (254 mT<B<300mT) and that between Intermediate III and collinear phases (300 mT<B<48 mT). The valley bottom (ε = 66) between the two peaks locates at 300 mT, which could be assigned to the borderline between intermediate II and III magnetic phases.
When B comes across into ferrimagnetic collinear phase (B>480), the dielectric constant remains almost as a flat line (ε~-730) with little fluctuation, whose amplitude is less than 90. The maximum relative change in ε (Δε(B)/ε(0) = [ε(B)-ε(0)]/ε(0), where B = 254mT) is 1174%, which reflects a giant magnetocapacitance effect of SrFe12O19 ceramics. This magnetocapacitance order is much higher than that of YMnO3 thin films with a magnitude of only 5.5% at 3T [46]. Thus, the hexaferrite with long-wavelength magnetic structures exhibits remarkable ME responses at low B fieldand roomtemperature, which opens substantial possibilities for applications of ME systems.
The magnetic phase within the B region of 450mT<B<800mT could also referred to the so called "left hand materials" with negative capacitance (dielectric constants). Although negative capacitance is known to exist in semiconductors [47] and ferroelectrics, where it has been predicted theoretically [48], its direct measurement has been elusive so far [49]. Sayeef Salahuddin and colleagues has reported that negative capacitance in ferroelectrics can be directly measured by putting a large resistance between the voltage supply and the electrodes of the ferroelectric capacitor [50], such a negative capacitance is just a transient phenomenon and is intrinsically unstable because it exists only around the tipping point between the two thermodynamically stable polarization states [49, 50]. This complicates practical implementation. Here, we happened to observe the negative capacitance (or dielectric constant) in O2 treated SrFe12O19 ceramicsbeing stimulated by low magnetic field. The negative capacitance could remain stable under application of low B field (450mT<B<800mT). Such low B-field induced negative capacitance was also experimentally measured in another M-type Hexaferrite (La0.2Pb0.7Fe12O19), whose lowest dielectric constant reaches as small as -84866.2 at the B field of 700 mT [51]. The negative capacitance of ferroelectrics could offer a solution to a bottleneck in transistor miniaturization: transistors are becoming too small and clock-speed too fast to remove the heat generated during switching, resulting in increased power dissipation and over heating [49]. Amplification of low gate voltage using negative capacitance would enable low-power operation and could overcome such bottleneck problem in transistor miniaturization process.
In brief, large ferroelectricity and strong ferromagnetism are naturally merged together in one single SrFe12O19 compound, due to the coexistence of the off-centered FeO6 octahedron in its sub-unit cell and electron spins in partially filled 3d orbits of the Fe3+ ions. Thus, the mutually exclusive electric and magnetic orders are naturally integrated in one single SrFe12O19 compound. Therefore, large ferroelectricity, strong ferromagnetism and giant ME coupling effect are all synchronously realized in one single phase of SrFe12O19 at room temperature (300K).
Conclusion
In summary, our work directly demonstrates the coexistence of large ferroelectricity and strong ferromagnetism in M-type strontium hexaferrite (SrFe12O19) at room- temperature (300K). We not only merge together the electric and magnetic orders, but also realize the giant magnetocapacitance effect in one single SrFe12O19 compound at room temperature. The SrFe12O19 ceramic displays a classical polarization hysteresis loop (P-E) with full saturation, two particular nonlinear I–V peaks, and dielectric anomalies near the Curie temperature, all of which verify its intrinsic ferroelectricity. Subsequent annealing the SrFe12O19 ceramic in oxygen atmosphere greatly enhance its electric resistance through removal of oxygen vacancies and transformation of Fe2+ into Fe3+, leading to the full saturation of the P-E loops. XPS spectra revealed the experimental evidences for great reduction of oxygen vacancies and transformation of Fe2+ into Fe3+ in SrFe12O19 ceramics upon annealing in O2. The remnant polarization of the SrFe12O19 ceramics is 103μC/cm2. Large magnetic hysteresis loop was also observed in SrFe12O19 due to its strong ferromagnetism. Furthermore, the capacitance (or dielectric constant) exhibits dramatic variation along with B field. The magnetic structure profile has been mapped out upon the relative magnetic permeability. Two remarkable peak structures of εappeared at the centers of Intermediate II and III magnetic phases, respectively. The maximum relative change in ε is 1174%, which reflects a giant magnetocapacitance effect of SrFe12O19 ceramics. Low B-field induced negative capacitance was also observed in this compound.
Supporting Information
(DOCX)
Acknowledgments
The authors acknowledge the financial support from Hubei Natural Science Foundation under the contract No. 2014CFB166; Open fund of State Key Laboratory of Advanced Technology for Materials Synthesis and Processing (Wuhan University of Technology) under the contract No. 2016-KF-15.
Data Availability
All relevant data are within the paper and its Supporting Information files.
Funding Statement
This work was supported by the Hubei Natural Science Foundation (under the contract no. 2014CFB166) and the Open fund of State Key Laboratory of Advanced Technology for Materials Synthesis and Processing (Wuhan University of Technology) under the contract no. 2016-KF-15. The funders had no role in study design, data collection and analysis, decision to publish, or preparation of the manuscript.
References
- 1.Zheng R. Y., Wang J., Ramakrishna S., J. Appl. Phys. 2008, 104, 0341061. [Google Scholar]
- 2.Cheong S. W., Mostovoy M. V., Nat. Mater. 2007, 6, 13 10.1038/nmat1804 [DOI] [PubMed] [Google Scholar]
- 3.Khomskii D. I., Physics 2009, 2, 20 [Google Scholar]
- 4.Lottermoser T.,Lonkai T., Amann U., Hohlwein D., Ihringer J., Fiebig M., Nature 2004, 430, 541,. 10.1038/nature02728 [DOI] [PubMed] [Google Scholar]
- 5.Carlos A. F. V., Hoffman J.,Ahn C. H., Ramesh R., Adv. Mater. 2010, 22, 2900 10.1002/adma.200904326 [DOI] [PubMed] [Google Scholar]
- 6.Tan G. L., Chen X. N., Magnetism J. and Magnetic Materials, 2013, 327, 87. [Google Scholar]
- 7.McKee R. A., Walker F. J.,Chisholm M. F., Phys. Rev. Lett. 1998, 81, 3014. [Google Scholar]
- 8.Reiner J. W., Walker F. J., Ahn C. H., Science 2009, 323, 1018 10.1126/science.1169058 [DOI] [PubMed] [Google Scholar]
- 9.Levin I., Li J.,Slutsker J., Roytburd A. L., Adv. Mater. 2006, 18, 2044. [Google Scholar]
- 10.Hill N. A., Annu. Rev. Mater. Sci. 2002, 32, 1. [Google Scholar]
- 11.Eerenstein W., Mathur N. D., Scott J. F., Nature (London) 2006, 442, 759. [DOI] [PubMed] [Google Scholar]
- 12.Tokura Y., Science 2006, 312, 1481 10.1126/science.1125227 [DOI] [PubMed] [Google Scholar]
- 13.Yamasaki Y., Miyasaka S., Kaneko Y., He J. P., Arima T., Tokura Y., Phys. Rev. Lett. 2006, 96, 207204 10.1103/PhysRevLett.96.207204 [DOI] [PubMed] [Google Scholar]
- 14.Katsura H., Nagaosa N., Balatsky A. V., Phys. Rev. Lett. 2005, 95, 057205 10.1103/PhysRevLett.95.057205 [DOI] [PubMed] [Google Scholar]
- 15.Lobo R. P. S. M., Moreira R. L., Lebeugle D., Colson D., Phys. Rev. B 2007, 76, 172105. [Google Scholar]
- 16.Lee J. H., Fang L., Vlahos E., Ke X. L., Jung Y. W., Kourkoutis L. F., et al. , Nature, 2010, 466, 954 10.1038/nature09331 [DOI] [PubMed] [Google Scholar]
- 17.Kimura T., Goto T., Shintani H., Ishiazaka K., Arima T., Tokura Y., Nature 2003, 426, 55 10.1038/nature02018 [DOI] [PubMed] [Google Scholar]
- 18.Goto T., Kimura T., Lawes G., Ramirez A. P., Tokura Y., Phys. Rev. Lett. 2004, 92, 257201 10.1103/PhysRevLett.92.257201 [DOI] [PubMed] [Google Scholar]
- 19.Kimura T.,Annu. Rev. Condens.Matter. Phys. 2012, 3, 93. [Google Scholar]
- 20.Chun S. H., Chai Y. S., Oh Y. S., Jaiswal-Nagar D., Haam S.Y., Kim I., Lee B., et al. , Phy. Rev. Lett. 2010, 304, 0372041. [DOI] [PubMed] [Google Scholar]
- 21.Ishiwata S., Taguchi Y., Murakawa H., Onose Y., Tokura Y., Science 2008, 319, 1643 10.1126/science.1154507 [DOI] [PubMed] [Google Scholar]
- 22.Rado G. T., Phys. Rev. Lett. 1964, 13, 335. [Google Scholar]
- 23.Wang J., Neaton J. B., Zheng H., Nagarajan V., Ogale S. B., Liu B., et al. , Science 2003, 299, 1719 10.1126/science.1080615 [DOI] [PubMed] [Google Scholar]
- 24.Momozawa N., Yamaguchi Y., J. Phys. Soc. Jpn. 1993, 62, 1292–1304. [Google Scholar]
- 25.Tokunaga Y., Kaneko Y., Okuyama D., Ishiwata S., Arima T., Wakimoto S., et al. , Phys. Rev. Lett. 2010, 105, 257201 10.1103/PhysRevLett.105.257201 [DOI] [PubMed] [Google Scholar]
- 26.Kimura T., Sekio Y., Nakamura H., Siegrist T., Ramirez A. P., Nature Mater. 2008, 7, 291. [DOI] [PubMed] [Google Scholar]
- 27.Eerenstein W., Wiora M., Prieto J. L., Scott J. F., Mathur N. D., Nature Mater. 2007, 6, 348. [DOI] [PubMed] [Google Scholar]
- 28.Tan G. L., Wang M., J. Electroceram. 2011, 26, 170. [Google Scholar]
- 29.Tan G. L., Li W., J. Am. Ceram. Soc. 2015, 98, 1812. [Google Scholar]
- 30.Sugimoto M., J. Am. Ceram. Soc. 1999, 82, 269. [Google Scholar]
- 31.Yang N., Yang H., Jia J., Pang X., Journal of Alloys and Compounds 2007, 438, 263. [Google Scholar]
- 32.Shen S. P., Wu J. C., Song J. D., Sun X. F., Yang Y. F., Chai Y. S., Nature Comm. [Google Scholar]
- 33.Shen S. P., Chai Y. S., Cong J. Z., Sun P. J., Lu J., Yan L. Q., et al. , Phy. Rev. B 2014, 90, 180404. [Google Scholar]
- 34.Rowley S. E., Chai Y. S., Shen S. P., Sun Y., Jones A. T., Watts B. E., et al. , Scientific Rep. [DOI] [PMC free article] [PubMed] [Google Scholar]
- 35.Tan G. L., Chen X. N., J. Elctron. Mater. 2013, 42, 906. [Google Scholar]
- 36.Scott J. F., J. Phys.: Condens. Matter 2008, 20, 021001. [Google Scholar]
- 37.Carver J.C., Schweitzer G. K., Carlson T. A., J. Chem. Phys. 1972, 57, 973. [Google Scholar]
- 38.Grechnev G.E., Lyogenkaya A.A., Kotlyar O.V., Panfilov A. S., Gnezdilov V. P., Arxiv, 1510.00513V1, Cond-mat.mtrl-sci., 2. Oct. 2015.
- 39.Mazumdar D., Knut R., Thöle F., Gorgoi M., Faleev S., Mryasov O. N., Shelke V., et al. , Journal of Electron Spectroscopy and Related Phenomena, 2016, 2068, 63. [Google Scholar]
- 40.Pokharel B. P., Pandey D., J. Appl. Phys. 2000, 88, 5364. [Google Scholar]
- 41.Stucki N., PhD thesis, P48, 2008, Université de Genève, Switzerland.
- 42.Kenzelmann M., Harris A. B., Jonas S., Broholm C., Schefer J., Kim S. B., et al. , Phys. Rev. Lett., 2005, 95, 087206 10.1103/PhysRevLett.95.087206 [DOI] [PubMed] [Google Scholar]
- 43.Hur N., Park S., Sharma P. A., Ahn J. S., Cheong S. W., Nature 2004, 429, 392 10.1038/nature02572 [DOI] [PubMed] [Google Scholar]
- 44.Kimura T., Lawes G., Ramirez A. P., Phys. Rev. Lett., 2005, 94, 137201 10.1103/PhysRevLett.94.137201 [DOI] [PubMed] [Google Scholar]
- 45.Wang J. L., Wang T. W., Li Y. Q., Guo H. X., Wang Q., 'Measurement for relative complex permeability by RF network /spectrum/ impedance analysis instrument', 259–263, Proceedings of 17th National Meeting on Electromagnetic Compatibility, Guangzhou, China, July 4 2007.
- 46.Singh A. K., Snure M., Tiwari A., Patnaik S. J., Appl. Phys. 2009, 106, 014109. [Google Scholar]
- 47.Ershov M., Liu H. C., Li L., Buchanan M., IEEE Trans. Electron. Dev. 1998, 45, 2196–2206. [Google Scholar]
- 48.Bratkovsky A. M., Levanyuk A. P., Phys. Rev. B 2001, 63, 132103. [Google Scholar]
- 49.Catalan G., Jiménez D., Gruverman A., Nature Mater. 2015, 14, 137–139. [DOI] [PubMed] [Google Scholar]
- 50.Khan A. I., Chatterjee K., Wang B., Drapcho S., You L., Serrao C., et al. , Nature Mater. 2015, 14, 182–186. [DOI] [PubMed] [Google Scholar]
- 51.Tan G. L., Sheng H. H., Acta Mater. 2016, 121, 144–151. [Google Scholar]
Associated Data
This section collects any data citations, data availability statements, or supplementary materials included in this article.
Supplementary Materials
(DOCX)
Data Availability Statement
All relevant data are within the paper and its Supporting Information files.


