Abstract
Purpose:
This work uses repeat images of intensity modulated radiation therapy (IMRT) fields to quantify fluence anomalies (i.e., delivery errors) that can be reliably detected in electronic portal images used for IMRT pretreatment quality assurance.
Methods:
Repeat images of 11 clinical IMRT fields are acquired on a Varian Trilogy linear accelerator at energies of 6 MV and 18 MV. Acquired images are corrected for output variations and registered to minimize the impact of linear accelerator and electronic portal imaging device (EPID) positioning deviations. Detection studies are performed in which rectangular anomalies of various sizes are inserted into the images. The performance of detection strategies based on pixel intensity deviations (PIDs) and gamma indices is evaluated using receiver operating characteristic analysis.
Results:
Residual differences between registered images are due to interfraction positional deviations of jaws and multileaf collimator leaves, plus imager noise. Positional deviations produce large intensity differences that degrade anomaly detection. Gradient effects are suppressed in PIDs using gradient scaling. Background noise is suppressed using median filtering. In the majority of images, PID-based detection strategies can reliably detect fluence anomalies of ≥5% in ∼1 mm2 areas and ≥2% in ∼20 mm2 areas.
Conclusions:
The ability to detect small dose differences (≤2%) depends strongly on the level of background noise. This in turn depends on the accuracy of image registration, the quality of the reference image, and field properties. The longer term aim of this work is to develop accurate and reliable methods of detecting IMRT delivery errors and variations. The ability to resolve small anomalies will allow the accuracy of advanced treatment techniques, such as image guided, adaptive, and arc therapies, to be quantified.
Keywords: intensity modulated radiation therapy (IMRT), quality assurance (QA), electronic portal imaging device (EPID), fluence anomaly, delivery error
I. INTRODUCTION
This work addresses the use of electronic portal imaging devices (EPIDs) for pretreatment quality assurance (PTQA) of intensity modulated radiation therapy (IMRT) fields. This is one of several applications for EPIDs. Others are surveyed by Herman.1 Dosimetric applications including use in PTQA are reviewed by van Elmpt2 and the references contained within.
In PTQA, one compares a reference image for each IMRT field to a measured image with no patient or phantom in the beam. In a clinical setting, EPID reference images are typically calculated from the IMRT plan via Monte Carlo simulation or an analytic algorithm.3,4 The reference image is intended to be an accurate approximation of the EPID image that would be produced if the IMRT field were delivered perfectly, i.e., with no linac output variations, alignment errors, EPID calibration errors, pixel sensitivity variations, leaf or jaw position errors, ghosting, lag, etc. If the reference and measured images agree to within some specified tolerance, the IMRT field is deemed to be acceptable. Disagreement indicates a nontrivial fluence deviation, also referred to in this work as an anomaly. Detected anomalies must be assessed and, if clinically significant, corrected before treatment.
Although IMRT is used to treat a wide range of cancers and its effectiveness depends on the accuracy of radiation delivery, relatively few works have attempted to rigorously quantify the accuracy of PTQA anomaly detection. Yan et al.5 evaluated the ability of the gamma algorithm6,7 to detect random and systematic multileaf collimator (MLC) leaf position errors, finding that all leaves had to be systematically offset by at least 2 mm before gamma could reliably detect errors. (See additional studies cited by Yan et al.) Nelms et al.8 simulated anomalies in head and neck plans and found poor correlation between gamma passing rates and clinically relevant dose metrics, presumably because gamma is a poor detector of the underlying fluence anomalies. If PTQA is to enable more accurate IMRT delivery by detecting and correcting delivery errors, these results suggest the need for anomaly detection algorithms with higher levels of sensitivity and specificity.
From a pure engineering standpoint, The Practitioner's Guide to Statistics and Lean Six Sigma for Process Improvements cites the following guideline for measurement accuracy: “The resolution, or discrimination of the measurement device must be small relative to the smaller of either the specification tolerance or the process spread (variation). As a rule of thumb, the measurement system should have resolution of at least 1/10th the smaller of either the specification tolerance or the process spread. If the resolution is not fine enough, process variability will not be recognized by the measurement system.”9
This can be applied to the PTQA processes as follows. Suppose one requires PTQA to reduce or eliminate errors of ≥2% in the cumulative dose for some subvolume. In the case that errors are randomly distributed, one might reasonably require PTQA to detect and “correct” errors of ≥10% in the per-fraction dose (2√(36 fractions) = 12 ≈ 10). In order to effectively detect errors ≥10% in each fraction, PTQA subprocesses should be able to resolve per-fraction dose differences on the order of 1%. Similarly, for nonrandom (systematic) errors, effective detection of dose errors ≥2% requires reliable detection and classification of errors of ∼0.2%.
[The above criteria apply to cumulative dose which results from radiation fluence delivery through a sequence of (shaped) beam apertures which results in dose deposition within the patient. Since individual beam apertures expose different tissue volumes, there is not an exact one-to-one correspondence between per-aperture fluence and cumulative dose. While the clinical goal is to reduce cumulative dose errors, this work concentrates on detection of fluence anomalies. For the clinic, fluence errors detected via EPID imaging need to be translated into corresponding patient dose errors. In the absence of true in vivo dosimetry, given the relationship between fluence and dose, it is useful to quantify the ability of EPIDs to detect fluence delivery errors.]
This work has three goals. The first is to characterize background deviations that are likely to occur in EPID images. These impose a fundamental limit on detection performance. The second is to rigorously quantify achievable detection performance using the standard statistical tool of receiver operating characteristic (ROC) analysis. The final goal is to explore a novel method of anomaly detection based on pixel intensity deviations (PIDs). This work focuses on the PID-based method, comparing it with commonly used 3%/3 mm gamma analysis,10 without attempting to optimize gamma parameters. Optimization of gamma-based detection is a nontrivial subject that is addressed in a separate work.11 The longer term aim of this work is to develop accurate and reliable methods of detecting IMRT delivery errors and variations.
II. METHODS AND MATERIALS
II.A. Overview
The main contents of this work are ROC studies in which PID- and gamma-based strategies are used to classify EPID images as either good (anomaly-free) or bad (containing a fluence anomaly). The ROC studies are performed by classifying many good and bad images. Good images are measured patient images; bad images are measured images with artificial rectangular anomalies inserted. The steps involved in image classification are: (i) select a measured patient image; (ii) optionally insert an anomaly; (iii) renormalize to remove output variation; (iv) optionally register to the reference image (explained below); (v) calculate PIDs and gammas for above-threshold pixels (explained below); and (vi) classify the image based on a PID- or gamma-based statistic. Following classification of many images, the classification accuracy for a given metric/method is established. Classification accuracy is reported for PID- and gamma-based classifiers, the goal being to identify analysis methods that are most accurate and sensitive at detecting fluence anomalies.
Raw data consist of repeat images of 11 clinical IMRT fields, culled from different patients. For purposes of computing reference images, all measured images are corrected for output variations and registered. For output variation correction, above-threshold pixels are identified, comprising all pixels above 20% of maximum intensity. Images of each field are then normalized so that their average intensity across above-threshold pixels is identical. Registration is described below. Calculation of PIDs and gamma indices is performed with respect to two reference images: (i) the first of the output-variation-corrected (OVC) registered images, and (ii) the mean of these images. Detection studies consider fluence anomalies of different sizes (±1%−±10% dose differences over 1 mm2−20 mm2 areas), and a number of gamma- and PID-based image classifiers. Only above-threshold pixels are utilized for classification. For each combination of fluence anomaly and classifier, a ROC curve is generated by classifying good and bad images. The true positive rate, false negative rate, and maximum accuracy are determined from the ROC curve.
PID values are calculated using the formula: , where and pj are the jth pixel intensities in the reference and measured images. Gamma indices are calculated using two methods: (a) A 2D implementation of the interpolation-free method of Ju et al.12 This method approximates image intensity as a linear function on simplices (i.e., triangles in 2D), and calculates gamma “exactly” without the need for subdivision of the native grid. Gamma indices calculated according to this method are referred to below as “continuous.” (Additional details are given in a separate work.11) (b) Gamma values are also calculated according to the familiar grid sampling method.13 In this work, sampling is performed by default on the original EPID grid with effective pixel size 0.37 mm. Gamma values obtained using this method are referred to below as “discrete.”
Note that if image gradients are large—as is the case for PTQA EPID images—gamma calculations on finite grids can introduce significant errors. The interpolation-free method is preferred because it avoids this problem. All gamma calculations are performed out to a maximum distance-to-agreement (DTA) search distance of 1 cm using (local) 3%/3 mm criteria, which are among the most frequently adopted criteria for published gamma analyses.10 PID and gamma distributions given in Sec. III are for above threshold pixels only.
II.B. Measured images
II.B.1. Dynamic images
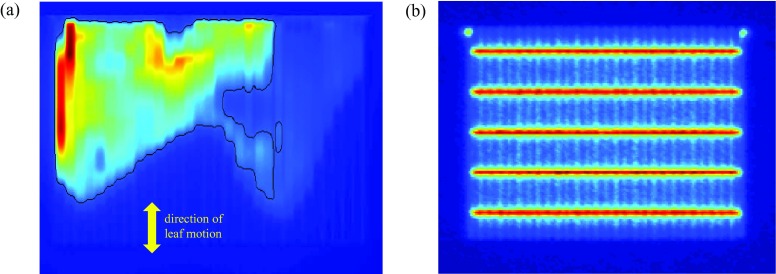
The principal input data for this work consist of repeat 6 MV and 18 MV measurements of a clinical dynamic IMRT field [Fig. 1(a)] which is shot in conjunction with several other fields, including a picket fence test field [Fig. 1(b)] plus open field and calibration fields. These images are analyzed in substantial detail to determine the properties of IMRT fields that affect anomaly detection. Images are collected on different days. On each day the EPID is extended to 105 cm source-to-imager distance, and remains in the same position for all images. At 6 MV, dark field and flood field images are taken and EPID calibration is performed. A postcalibration image is taken with the same jaw settings as the flood field image; this image is referred to below as an “open field” image. Finally, images are taken of the patient and picket fence fields of Fig. 1. The same procedure is followed for 18 MV. Images are obtained by delivering 100 monitor units (MU) at a rate of 300 MU/min using dynamic IMRT. (Reference and measured images are normalized before comparison, so use of 100 MUs is as good as any other value. In a clinical workflow, where reference images are computed, images would likely be acquired using the planned MUs for each field.) This procedure is repeated daily producing fifty-seven 6 MV and fifty-six 18 MV images of the patient field.
FIG. 1.
Panel (a) shows the principal clinical dynamic IMRT field analyzed in this work. This dynamic field is repeatedly acquired at 6 MV and 18 MV, and is shot in conjunction with a number of other open and calibration fields, including the picket-fence test field of panel (b). The yellow arrow shows the direction of leaf motion. The superimposed black line shows above-threshold pixels (i.e., pixels with intensity ≥20% of maximum intensity).
II.B.2. Step-and-shoot images
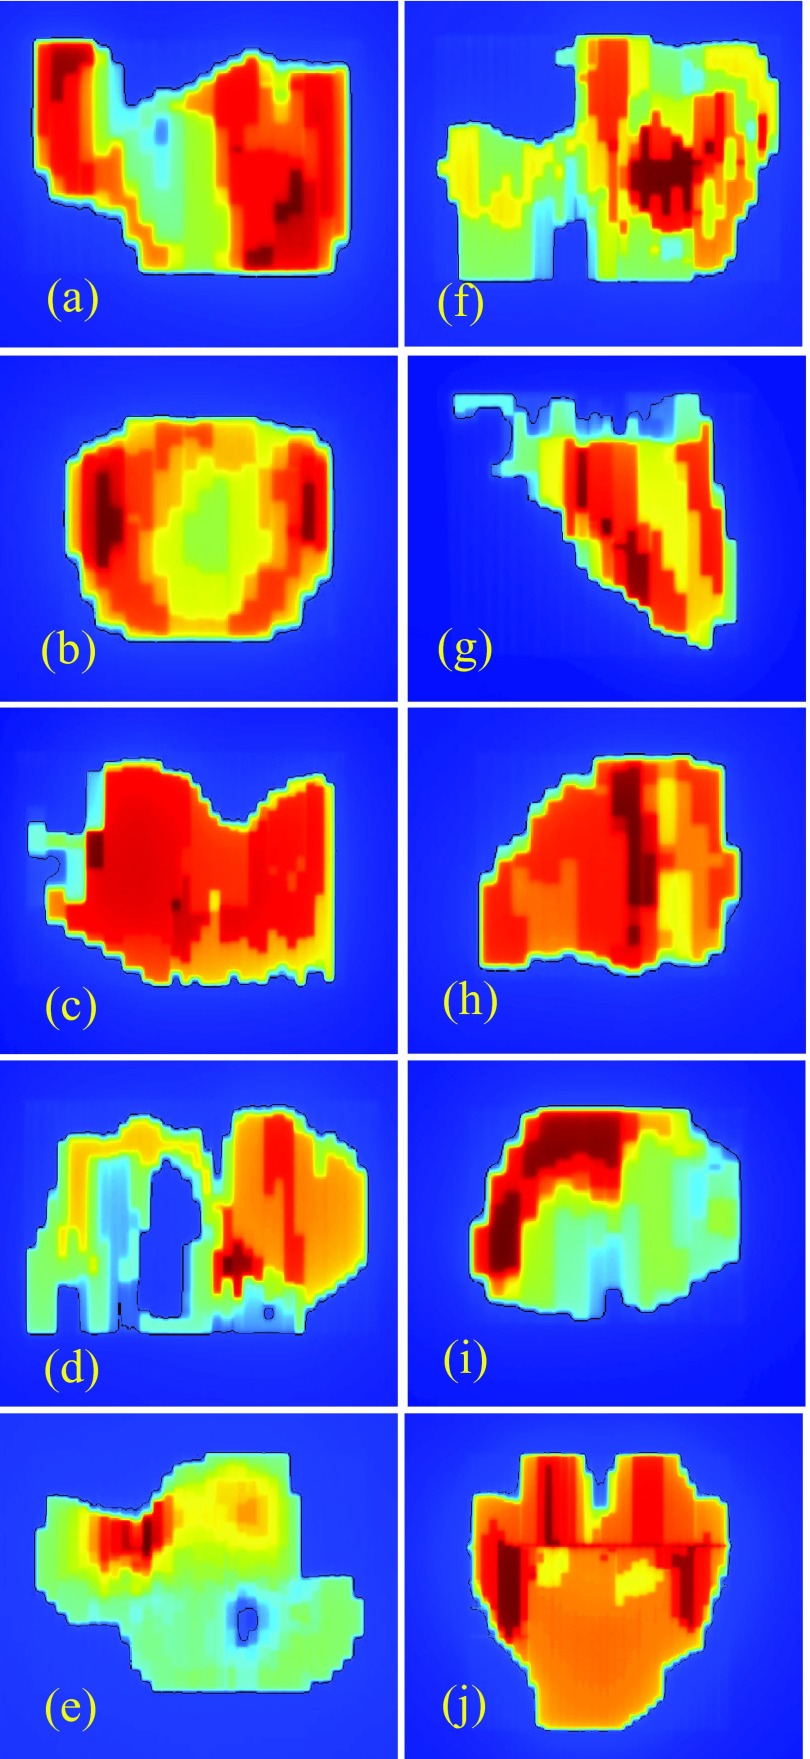
Additional data consist of repeated images of the ten clinical step-and-shoot IMRT fields shown in Fig. 2. Each of the ten clinical fields comes from a different patient plan: three from prostate plans, three from head and neck plans, and one each from chest, brain, spine, and abdomen plans. In contrast to the dynamic field of Fig. 1, which is shot at both 6 MV and 18 MV, the fields in Fig. 2 are shot at one energy only: five at 6 MV and five at 18 MV. Open field images (but not picket fence images) are also acquired at 6 MV and 18 MV. All images are collected on a single day. Flood field calibration is performed once at the start of image collection. Between shooting each set of 12 fields, the EPID is retracted and re-extended. Images are obtained by delivering 100 monitor units (MU) at a rate of 600 MU/min using step-and-shoot IMRT. This procedure is repeated 30 times, resulting in 30 images of each field. It is generally accepted that dynamic versus step-and-shoot delivery can require different levels of performance from the MLC. There is consequently value in analyzing the characteristics of dynamic versus step-and-shoot images.
FIG. 2.
Ten clinical step-and-shoot IMRT fields used in this work. These are analyzed in less detail than the dynamic field of Fig. 1(a). They are used to test whether techniques developed for the field of Fig. 1(a) can be validly applied to other fields. As in Fig. 1(a), the superimposed black lines show above-threshold pixels.
II.B.3. Image acquisition details
All images are acquired with collimator at 90° and the gantry at 0°, the position commonly used for clinical EPID-based IMRT pretreatment QA. Each image represents the average of acquired frames in the EPID's integrated mode. Imaging is performed on a Varian Trilogy linear accelerator with a Millenium 120 MLC, using an aS1000 EPID with IAS3 control software. Flood field jaw settings are 38 cm × 28 cm, ensuring the flood field covers the EPID array except for a small margin around its edge. The picket fence image requires MLC leaves to move across a rectangular region, maintaining a fixed gap between leaf banks, “pausing” to generate five “lines” at 3 cm spacing, as in Fig. 1(b).
The aS1000 array is 40 cm × 30 cm, and is divided into 1024 × 768 pixels, making the physical pixel size 0.39 mm × 0.39 mm. All images are acquired at a source-imager distance (SID) of 105 cm, a common SID used for pretreatment QA. Consequently, the effective pixel size in the isocenter plane is 0.39/1.05 = 0.37 mm. Each dynamic field image produces on the order of 40 000 above-threshold pixels. The 57/56 dynamic images therefore produce a total of ∼2.2 million PID and gamma values, from which background PID and gamma distributions are determined. Step-and-shoot images produce approximately comparable sample sizes.
Although the measurements are performed with Varian equipment, techniques used in this study are directly translatable to other accelerator vendor equipment, different EPIDs, and even non-EPID measurement devices. Different linac equipment may yield different reproducibility of accelerator components (MLC leaf positions, beam output, etc.). Different EPIDs (detectors) may exhibit different positional and response reproducibility.
II.C. Image registration
II.C.1. Image registration for dynamic images
Registration of the dynamic images [Fig. 1(a)] is explored in detail. Rigid registration is performed in order to remove global translations, rotations, and scale changes. Causes of these shifts could include positional deviations of the carriage, collimator, and EPID with respect to their intended positions. For example, a slight offset of the collimator will cause the IMRT field to be rotated. Similarly, failure of the EPID to extend exactly to its intended position could cause a translation or scale change.
Within each image set, images Ii, i ≥ 2, are registered to the first image I1. (Registration is performed on full images of size 1024 × 768 pixels.) Two registration algorithms are employed: (a) a cross-correlation algorithm from Guizar–Sicairos et al.,14 and a home-grown picket fence (PF) algorithm. The cross-correlation algorithm is used to detect and correct translations, down to subpixel accuracy. MATLAB code can be found in Ref. 15.
The PF algorithm uses the picket fence image associated with each patient field image to correct rotations and scale changes. It relies on the fact that the EPID position is static during each measurement session's image acquisitions, ensuring that patient field and picket fence images exhibit identical positional offsets. Thresholding is performed on picket fence images in order to identify the five horizontal leaf gaps [see Fig. 1(b)]. Pixels along these gaps are assigned an intensity of one, while all other pixels are assigned an intensity of zero. Best fit lines are then obtained for each gap. Rotations are determined from the mean slope of the five lines, and scale changes from the distances between the outermost lines.
II.C.2. Validation of image registration for dynamic images
Accuracy of the cross-correlation algorithm is evaluated by repeating an offset test 200 times. For each test, one of the 57/56 patient field images is selected at random, copied, translated with respect to the original, and resampled onto the original grid. Translations along both axes are random and uniformly distributed between ±2 pixels. Random, uncorrelated, and normally distributed PIDs, having zero mean and standard deviation (SD) of 0.5%, are applied to each pixel in the copied image, i.e., each pixel intensity is multiplied by a factor (1 + p/100), where p is given by 0.5 times a standard normally distributed pseudo-random value. This PID component simulates differential noise between two images of the same patient field. As reported below, a SD of 0.5% approximates the actual level of noise in the dynamic images. The copied image is then registered with the original, and estimated translations are compared with true values. This is done for both 6 MV and 18 MV image sets.
Accuracy of the PF algorithm is also evaluated by repeating a test 200 times. For each test, a picket fence image is selected at random, copied, then rotated and scaled with respect to the original. Rotations and scale changes are random and uniformly distributed between ±2° and ±2%. Random, uncorrelated, and normally distributed PIDs, having zero mean and SD of 1.5%, are applied to each pixel in the copied image. The PIDs are intended to simulate differential noise between two picket fence images. A SD of 1.5% approximates the actual level of noise in picket fence images. The copied image is then registered with the original, and estimated rotations and scale changes are compared with true values. This is done for both 6 MV and 18 MV image sets.
II.C.3. Image registration for step-and-shoot images
Repeat step-and-shoot images are taken without requiring any motion of the gantry or collimator. (In principle, the gantry remains stationary at 0° and the collimator stationary at 90° for all images. Note, however, that the linac dynamically controls the gantry and collimator, so the possibility exists of some slight motion around the nominal position.) For this reason, the cross-correlation algorithm alone is used to correct translational offsets between repeat images. Rotations and scale changes are assumed to be zero. Separate validation of the accuracy of the cross-correlation algorithm for step-and-shoot images is not performed. Accuracy is assumed to be similar to that obtained for the dynamic images.
II.D. Image processing to improve anomaly detection
After rigid registration (Sec. II C), global misalignment between images are minimized. However, there can still exist residual deviations in the positions of image subelements. These are due to small positional deviations of individual jaws and MLC leaves with respect to their intended positions, and to imperfect global registration. Residual misalignments of measured images (i.e., image subelements) with respect to the reference image interact with image gradients to produce variability in PID values.
The relative image gradient R is defined to be the percent change in image intensity I per pixel: R = 100 ΔI/I. Subscripts x,y (Rx, Ry) denote relative gradients in the x- and y-directions. With reference to Figs. 1(a) and 2, the x (horizontal) direction is the cross-plane direction, i.e., the direction of upper jaw motion. The y (vertical) direction is the in-plane direction, i.e., the direction of MLC leaf motion. Where direction is unspecified, R denotes the magnitude of the gradient: . A suffix j (Rx,j, Ry,j, Rj) denotes gradients at pixel j. Unless otherwise noted, gradients are calculated in the reference image. Gradients employed here are calculated via MATLAB's “gradient” function, which defines Rx,j and Ry,j as half the difference of intensity values at pixels on either side of pixel j.
The following model is adopted to estimate the effect of the image gradient for PID δj:
| (1) |
where δB, j, ΔXj, and ΔYj are random variables that assume different values at different pixels. The quantityδB, j is the baseline (i.e., gradient-independent) intensity variation. It represents the baseline detector “noise” against which fluence anomalies must be detected. ΔXj and ΔYj are local misalignments in units of pixels, e.g., due to positional variations of individual MLC leaves. This work does not attempt to deduce the values of ΔXj and ΔYj for individual pixels, but rather evaluates their statistics over a large population of pixels. When considering the distribution of PIDs across an image, or a set of images, δB, j, ΔXj, and ΔYj are assumed to be independent and normally distributed with zero mean and standard deviations σB, σx, and σy that are independent of pixel index j. A consequence of Eq. (1) is that the SD σPID,j of PID values δj can be expressed as follows:
| (2) |
where dependence on pixel index j is solely through the gradients. The values of σB, σx, and σy can be obtained from image analysis. Gradient dependence of PIDs degrades one's ability to detect fluence anomalies in the PID distribution. High gradient regions of the image contribute large PIDs, which can mask bona fide fluence anomalies in other parts of the image. Gradients effects can be removed by using gradient scaled PIDs (GSPIDs):
| (3) |
The ability to detect fluence anomalies in GSPID distributions is better than in PID distributions. However, additional processing provides further improvements. Specifically, application of median filtering to the GSPID images is able to suppress background noise, making fluence anomalies easier to detect. Median filtered GSPID values are referred to in the following as median-filtered gradient-scaled PIDs (MFGSPID) values. Median filtering is performed using the MATLAB “medfilt2” function. Details are given below.
II.E. PID- and gamma-based classifiers
ROC analysis relies on classifiers to catalog an image as being “good” or “bad” in the presence of image offsets and noise. PID-based classifiers use the statistic , i.e., the percentage of (above threshold) PID values δ lying within κ sample SDs σ of the mean μ. For a cutoff τ, images are classified as good if ϕ ⩾ τ and bad if ϕ < τ. For each value of τ, classification produced certain rates of true positives (TPR), false positives (FPR), true negatives (TNR), and false negatives (FNR), where TPR, FPR, TNR, and FNR are in the range [0,1] and TPR + FNR = TNR + FPR = 1. A true positive is an anomaly-free image that is correctly classified as positive (good), and so on. Accuracy is equal to 100 * (TPR+TNR)/(TPR+FNR+TNR+FPR). A ROC curve plots TPR versus FPR as τ is varied. Accuracy varies along the ROC curve, attaining a maximum at some specific value of τ, denoted max_acc(κ,) where is the anomaly. Taking the maximum over sampled values of κ gives the overall maximum max_acc(), which is used to quantify classifier performance. A classifier with maximum accuracy close to 100% exhibits good discrimination between anomalous and anomaly-free images. For this study, classifier performance is deemed to be acceptable if maximum accuracy is greater than or equal to 95%. This means that, with optimum parameter settings, the classifier can correctly classify at least 95% of images.
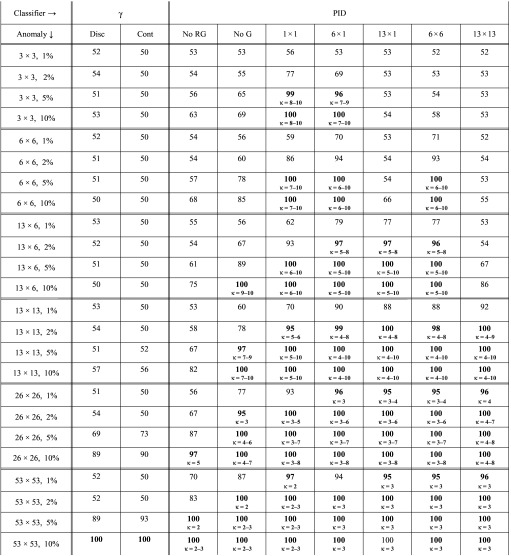
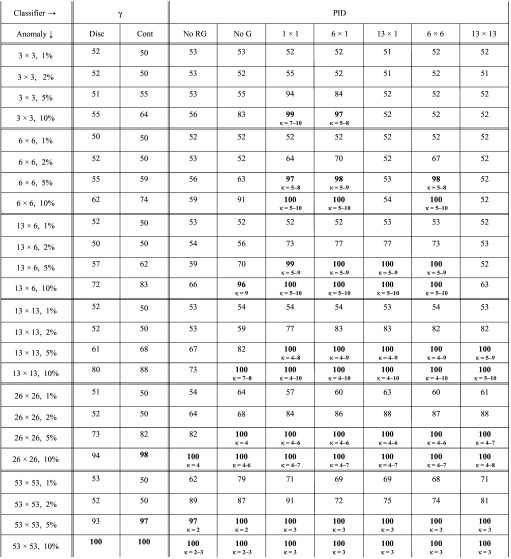
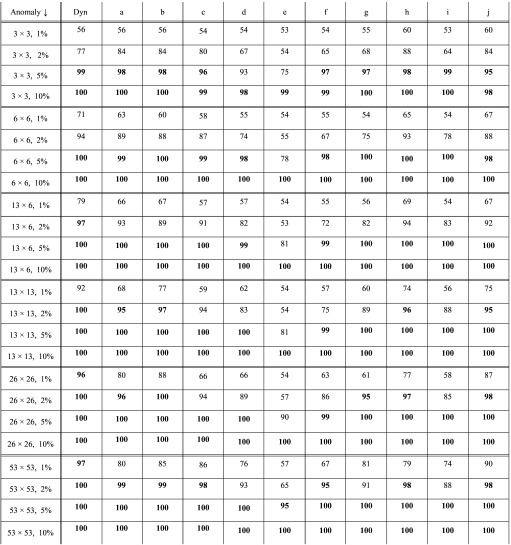
Note that PID-based classifiers utilize not only simple PIDs, but also GSPIDs, and MFGSPIDs. In Tables III–V, the classifier labeled “no RG”, signifies use of PIDs without registration and gradient scaling with respect to the reference image. This classifier illustrates the degree to which prior registration improves classification performance. The “no G” classifier utilizes simple PIDs from registered images, without gradient scaling. The remaining PID-based classifiers use gradient-scaled PIDs from registered images. The classifier labeled “1 × 1” uses no median filtering. The classifiers labeled “6 × 1,” “13 × 1,” “6 × 6,” and “13 × 13” use median filtering with the indicated window size (e.g., “6 × 1” signifies a filter window of size 6 pixels in the x-direction and 1 pixel in the y-direction).
TABLE III.
Maximum classification accuracy for anomalies of varying sizes inserted into 6 MV dynamic field images, when PID and gamma values are calculated with respect to a reference image that is the mean of the measured images. Small text in the lower half of each cell gives the optimum range for parameter κ. Cells with maximum accuracy ≥95% are in bold.
TABLE IV.
Maximum classification accuracy for anomalies of varying sizes inserted into 6 MV dynamic field images, when PID and gamma values are calculated with respect to a reference image that is the first of the measured images. Small text in the lower half of each cell gives the optimum range for parameter κ. Cells with maximum accuracy ≥95% are in bold.
TABLE V.
Maximum classification accuracy obtained with PID-based detection for anomalies of varying sizes inserted into dynamic (dyn) and step-and-shoot (a–j) images. Results are maxima over all analyzed classifiers (e.g., all sizes of median filters). Results are obtained using image-specific gradient scaling parameters σB, σx, and σy.
Gamma indices are calculated using registered images. Gamma-based detection uses the statistic , the percentage of pixels having gamma less than 1. This is the frequently used 3%/3 mm gamma analysis with a threshold of one.10 Two forms of gamma calculation are used: gamma values calculated on the discrete image grid are denoted with “disc,” while gamma values calculated using interpolation-free method of Ju et al.12 are denoted “cont” (for continuous). Note that this work makes no attempt to optimize gamma detection: for gamma there is no free parameter κ (although maximum accuracy is still evaluated over all cutoffs τ). Optimization of gamma-based detection is addressed in a separate paper.11
For PID-based classifiers, κ is varied from 1 to 10 in steps of 1. Note that in the above classification procedure, output variation correction and registration are performed after insertion of the anomaly. This simulates clinical reality, by ensuring that anomalies have the potential to interfere with output variation correction and registration.
II.F. Detection studies
Detection studies consider various sizes of fluence anomalies (see the left-most column of Table III) and the gamma and PID-based image classifiers as described above (listed in the top row of Table III). For each combination of fluence anomaly and classifier, a ROC curve is generated by classifying available good and 500 bad images. (See any standard statistics text for details of the ROC method.) Good images consist of unmodified measured images: fifty-six 6 MV images and fifty-seven 18 MV images in the case of the dynamic field, and thirty 6/18 MV images in the case of the step-and-shoot fields. Bad images consist of a randomly selected measured image, into which a randomly positioned fluence anomaly is inserted.
Each fluence anomaly consists of a rectangular region of n × m pixels (n in the x-direction and m in the y-direction) in which dose (intensity) is changed by ± q percent. Anomalies used in this study are listed in the left-most column of Table III in “n × m, q” format. Note that 3, 6, 13, 26, and 53 pixels represent lengths of 1.1, 2.2, 4.8 (≈5), 9.7 (≈10), and 19.7 (≈20) mm, respectively. The last three lengths are selected to correspond roughly with multiples of the Varian Millenium 120 MLC 5 mm inner leaf width. However, this work makes no assumptions about whether anomalies are produced by MLC leaf positioning deviations, or other causes. It simply attempts to characterize detection performance for anomalies of the stated sizes.
For each bad image, the sign of the dose change within the anomaly is random, with 50% probability that it is positive or negative. The position of the anomalous rectangle is randomly selected within the image, in such a way that the entire rectangle overlaps the region of above-threshold pixels. This ensures that, for each scenario, classification of bad images is based on a consistent number of anomalous pixels. For the field of Fig. 1(a), the number of candidate positions for the largest anomalies (53 × 53 pixels) is around 15 000. For smaller anomalies it approaches the number of above-threshold pixels, i.e., about 40 000. Corresponding numbers for step-and-shoot images are similar.
III. RESULTS
III.A. Output variations and registration of dynamic images
The standard deviation of measured output variations in 6 MV flood field images is 3.01%, and in 18 MV images is 1.85%. (The energy-dependence is not explained, but may be caused by different linac pulse durations or levels of quantum detector noise. Munro and Bouius analyzed an aSi EPID concluding that overall detector noise is dominated by quantum noise.16) These variations correspond with the size of expected day-to-day output variations when output calibration is performed less frequently than daily, e.g., at monthly or quarterly intervals. The SD in open field images, taken soon after flood field calibration, is 0.4% for 6 MV and 0.7% for 18 MV. In patient field images, the SD is 0.3% for 6 MV and 0.8% for 18 MV. Daily flood field calibration (or similar output calibration using a nonflood field) reduces, but does not eliminate, output variations. Note that image “output variations” could be attributable to linac output variations, or detector output variations, or both.
Accuracy of the cross-correlation and PF registration algorithms is given in Table I, which quantifies the difference between estimated and true image offsets obtained using the methodology of Sec. ???. The accuracy of translation estimates in the x- and y-directions are similar, so results are combined. Based on these results, the cross-correlation algorithm can estimate global translations to an accuracy of about 0.01 pixels (2σ), or 0.004 mm at a SID of 105 cm. The PF algorithm can estimate rotations to an accuracy of about 0.03° and scale changes to an accuracy of about 0.1%, which represents a SID shift of ±1 mm at a SID of 105 cm. The cross-correlation algorithm is more accurate than the PF algorithm at detecting translations, but does not detect rotations and scale changes. The PF algorithm is the most accurate algorithm found by the authors to date for detecting rotations and scale changes. A cross-correlation algorithm for detecting rotations and scale changes did not to perform as well as the picket fence algorithm. Note that detection of rotations using the PF algorithm is unaffected by translations, and so is logically independent of translation detection.
TABLE I.
Accuracy of the cross-correlation registration algorithm at estimating translations and the PF algorithm at estimating rotations and scale changes. Quoted figures are the differences between estimated and true values. Statistics are over 200 samples (μ = mean, σ = SD).
| Energy | Δ x/y shift (pixels) | Δ rotation (degrees) | Δ scale change (%) |
|---|---|---|---|
| 6 MV | Range = −0.012 : 0.011 | Range = −0.030 : 0.038 | Range = −0.196 : 0.214 |
| μ ± σ = 0.000 ± 0.005 | μ ± σ = 0.006 ± 0.010 | μ ± σ = 0.005 ± 0.06 | |
| 18 MV | Range = −0.012 : 0.011 | Range = −0.013 : 0.018 | Range = −0.110 : 0.089 |
| μ ± σ = 0.000 ± 0.005 | μ ± σ = 0.000 ± 0.005 | μ ± σ = −0.009 ± 0.04 |
Table II shows the estimated translations, rotations, and scale changes obtained when the cross-correlation/PF algorithms are used to register output-variation-corrected patient field images Ii, i ≥ 2, to the first image I1. Translations range up to ∼0.4 pixels, with a SD that is larger in the y (MLC) direction than in the x (jaw) direction. Rotations range up to ∼0.1° (about three times measurement accuracy), with a SD that is approximately equal to measurement accuracy. Scale changes are on the order of measurement accuracy (i.e., < 0.1%), indicating that scale estimates are unreliable and scale corrections are therefore pointless for these measurements.
TABLE II.
Estimated translations, rotations, and scale changes between dynamic field images Ii, i ≥ 2, and the first image I1. Statistics are over fifty-seven 6 MV and fifty-six 18 MV images (μ = mean, σ = SD).
| Energy | x-shift (pixels) | y-shift (pixels) | Rotation (degrees) | Scale change (%) |
|---|---|---|---|---|
| 6 MV | Range = −0.03 : 0.24 | Range = −0.31 : 0.29 | Range = −0.12 : 0.02 | Range = −0.17 : 0.04 |
| μ ± σ = 0.11 ± 0.06 | μ ± σ = −0.01 ± 0.14 | μ ± σ = −0.04 ± 0.03 | μ ± σ = −0.07 ± 0.05 | |
| 18 MV | Range = −0.07 : 0.22 | Range = −0.39 : 0.19 | Range = −0.06 : 0.07 | Range = −0.05 : 0.16 |
| μ ± σ = 0.07 ± 0.06 | μ ± σ = −0.10 ± 0.13 | μ ± σ = 0.02 ± 0.03 | μ ± σ = 0.07 ± 0.06 |
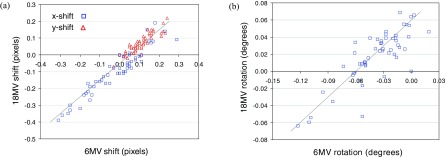
A key assumption of the PF algorithm is that all images taken on the same day (i.e., without moving the imager) have the same offsets, and that rotations obtained from picket fence images can therefore be used to correct rotational offsets in patient field images. Figure 3(a) is a plot of same-day 18 MV versus 6 MV shifts, obtained from the cross-correlation algorithm applied to patient field images. Figure 3(b) is a plot of same-day 18 MV versus 6 MV rotations, obtained from the PF algorithm applied to picket fence images. Both plots exhibit reasonably good correlation between 18 MV and 6 MV results, confirming that offsets are due to daily position variations of the EPID with respect to the treatment head. (For Fig. 3(a), the correlation coefficient is 0.95. For Fig. 3(b), it is 0.83.)
FIG. 3.
(a) Plot of estimated x- and y-shifts derived from same-day 18 MV versus 6 MV dynamic field images [Fig. 1(a)]. (b) Plot of estimated rotations derived from same-day 18 MV versus 6 MV picket fence images [Fig. 1(b)]. Superimposed lines have slope of one, and are fitted by eye to the data.
III.B. Output variations and registration of step-and-shoot images
SDs of output variations are less than 0.3% for all fields except one. The exception—the field of Fig. 2(e), referred to henceforth as field 2e—has a SD of ∼0.6%. Translational shifts for all step-and-shoot fields are similar to those for the dynamic field. Shifts in both directions fall within the range [−0.4, 0.4] pixels, and shift SDs range from 0.03 to 0.12 pixels.
III.C. PID distributions for dynamic images
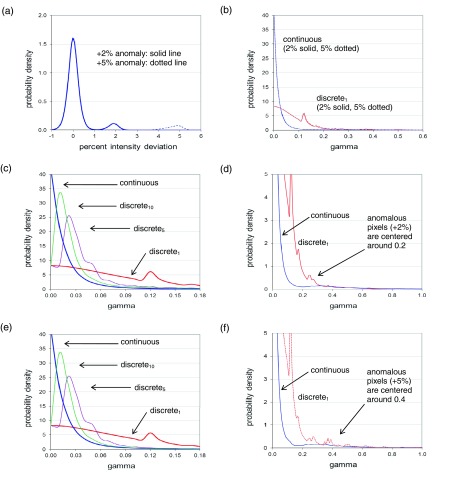
Figure 4 shows distributions of 6 MV PIDs and gamma values with respect to a reference image that is the mean of output-variation-corrected registered images. Results for 18 MV, and for a reference image that is the first of the fifty-seven 6 MV/fifty-six 18 MV images are visually similar. Figure 4(a) shows the PID distribution obtained in the presence of 53 × 53 pixel, +2% and +5% anomalies. Plots are obtained by taking each of the fifty-seven 6 MV patient field images, inserting a 53 × 53 pixel +2% or +5% anomaly at a random location (such that the entire anomaly overlaps the region of above-threshold pixels), and aggregating the resulting gradient-scaled PIDs. The distributions of simple and median-filtered PIDs are visually similar, though they differ in the percentages of PIDs falling in the central part of the distribution versus the tails. Note that anomalous pixels can be clearly seen as humps around +2% and +5%, as would be expected. Also the height of the humps relative to the main peak is consistent with about 8% of pixels (i.e., 53 × 53 ≈ 2500 out of approximately 40 000) being anomalous.
FIG. 4.
For the dynamic field of Fig. 1(a), aggregate 6 MV PID and gamma distributions with respect to a mean reference image, for registered images into which 53 × 53 pixel +2% and +5% anomalies are inserted at random locations. (a) Aggregate GSPID distribution. (b) Aggregate continuous and discrete gamma distributions. (c) For +2% anomalies, aggregate gamma distributions with discrete gammas (denoted discreten) calculated on progressively finer grids of n = 1, 5, and 10 sub-pixels per original pixel. (d) Same as c, but on an expanded scale. (e) For +5% anomalies, aggregate gamma distributions. (f) Same as e, but on an expanded scale. These results show that anomalies are more readily detectable (by eye) in the PID distributions than in the gamma distributions.
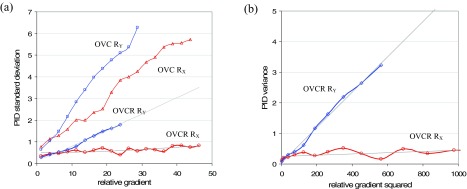
Figure 5(a) plots PID SDs for 6 MV output-variation-corrected (OVC) and output-variation-corrected-and-registered (OVCR) patient field images against the jaw gradient RX and leaf gradient RY. Note that these results are for good images (no inserted anomalies). In order to generate these plots, PIDs for above-threshold pixels are binned according to the reference image gradient with bin size 2.5. PID SD values are calculated and plotted against the mid-point of each bin. Plots for 18 MV patient field images are similar.
FIG. 5.
Gradient results for the dynamic field of Fig. 1(a) shot at 6 MV. (a) Plots of PID SD versus relative gradients RX in the x/jaw direction and RY in the y/leaf direction, for 6 MV patient field images that are for 6 MV patient field images that are output variation corrected but not registered (OVC) and output variation corrected and registered (OVCR). To generate these plots, PIDs are calculated for the 57 OVC or OVCR images, and binned according to the pixel's RX or RY value. The SD is then calculated per bin. (b) Plots of PID variance versus and for 6 MV OVCR patient field images.
OVC images are not registered with the reference image. Figure 5(a) shows that misalignments in the OVC images interact with intensity gradients in the x- and y-directions to produce PID SDs up to 6%. The overall range of PID values in this case is [−12.8, 14.8]. OVCR images are registered with the reference image. Figure 5(a) shows that registration eliminates almost all jaw misalignments in the x-direction: PID SDs become approximately independent of gradient RX. However, global registration cannot eliminate individual leaf misalignments in the y-direction. Consequently, PID SDs still vary with gradient RY, though the dependence is weaker than in OVC images. As a result of registration, maximum PID SDs are reduced to 2%, and the range of PID values is reduced to [−10.0, 5.5].
To derive estimates of the parameters σx and σy in Eq. (2), it is necessary to plot PID variance against gradient squared. Figure 5(b) shows these plots for the OVCR data of Fig. 5(a), with superimposed regression lines in gray. Using these regression parameters, Eq. (2) gives the near-linear fitted curves shown in gray in Fig. 5(a). Based on the regressions, 6 MV patient field images have σx = 0.01 and σy = 0.08. Plotting versus a single squared gradient as in Fig. 5(b) effectively averages over the other gradient, leading to an offset in the y-intercept. For this reason, σB is estimated by finding the PID SD for pixels having Rx,j ≈ 0 and Ry,j ≈ 0. The estimated value is: σB = 0.25. The corresponding values for 18 MV patient images are: σB = 0.35, σx = 0.01, and σy = 0.07. The measured values for σx and σy imply that, after image registration, the residual x- and y-shifts will mostly lie between three-sigma values of ±0.03 pixels (or ±0.01 mm) in the x-direction and ±0.24 pixels (or ±0.1 mm) in the y-direction.
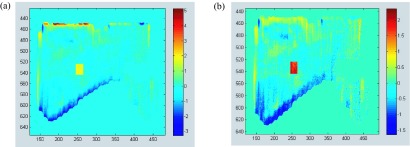
Gradient scaled PIDs are corrected for the gradient effect as in Eq. (3). GSPID SDs are consequently approximately independent of gradient and equal to 0.25 for 6 MV and 0.35 for 18 MV patient field images. In 6 MV patient field images, the range of GSPIDs is [−2.1,2.2]. The range for 18 MV patient field images is similar. Figure 6 shows PID and GSPID images derived from the same 6 MV patient field image. In the original image, intensity in a 20 × 20 pixel region has been artificially increased by 2%. In the PID image the anomalous region must be detected against background PIDs ranging from −3 to +6. In the GSPID image background GSPIDs extend from −1.5 to about +1, making anomaly detection easier. Median filtering complements gradient scaling by potentially suppressing background noise, while preserving bona fide anomalies.
FIG. 6.
Pixel intensity deviation (PID) images for the dynamic field of Fig. 1(a) shot at 6 MV. (a) The (PID) image derived from a 6 MV patient field image in which intensity has been artificially increased by 2% in a 20 × 20 pixel region (the yellow rectangle). (b) The corresponding gradient scaled PID (GSPID) image, with the anomaly showing as a red rectangle. In the case of the PID image, identification of the anomaly is made more difficult by the presence of outlier PID values extending to −3 and +6. In the GSPID image the anomaly is more easily detectable because it lies outside the range of GSPIDs in the remainder of the image.
III.D. PID distributions for step-and-shoot images
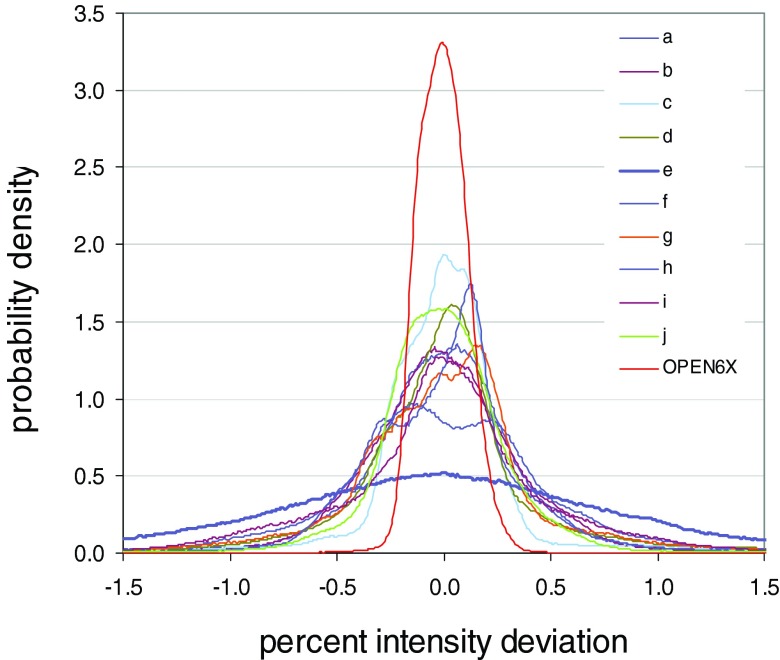
Figure 7 shows PID distributions for the ten step-and-shoot fields, plus the 6 MV open field that is shot at the same time as the step-and-shoot fields. The 6 MV open field exhibits the tightest distribution (red curve). Since it derives from an open field, this distribution is a reasonable approximation for inherent detector noise. It has a SD of 0.12%. Of the step-and-shoot fields, all but one exhibit similar distributions, with SDs of 0.48%–0.63%. These values are comparable to the 6 MV and 18 MV SDs for the dynamic field [Fig. 1(a)]: 0.38% and 0.42%.
FIG. 7.
PID distributions for the step-and-shoot fields of Fig. 2, and for an open 6 MV field. The 6 MV open field exhibits the tightest distribution. All but one of the step-and-shoot fields exhibit similar distributions. The outlier is the field of Fig. 2(e), which has a substantially wider distribution.
The outlier in Fig. 7 is once again field 2e, which has a substantially wider PID distribution (purple line) with a SD of 1.01%. Anecdotally, that field took the longest to deliver, by virtue of being the most heavily modulated. The 10 step-and-shoot fields collectively illustrate the effect of small positional deviations on the PID distribution. Each time a field is delivered, the jaws and MLC leaves can move to slightly different positions. The residual positional deviations interact with image gradients (in modulated fields) to widen the PID distribution. If the field is heavily modulated and taxes the MLC, resulting in greater disparity between actual and intended leaf positions, the PID distribution could become appreciably wider. However, it appears that this is not the primary explanation for the notably wider distribution of field 2e.
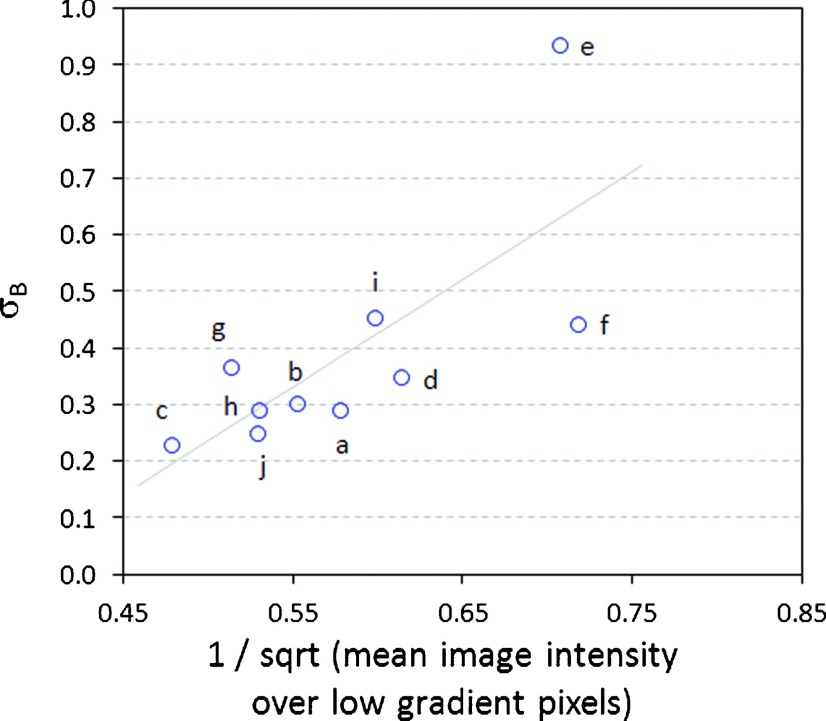
Gradient analysis—of the type performed in Fig. 5 for the dynamic field—produces a range of values for σB, σx, and σy. Excluding field 2e, the range of σB is [0.23, 0.46], the range of σx is [0.02, 0.12], and the range of σy is [0.05, 0.12]. (Note that the dynamic field has values at the lower end of these ranges.) For field 2e, σx and σy fall within these same ranges, but σB is substantially larger at 0.94. The quantities σx and σy represent the SDs of local positional offsets, in units of pixels. The results suggest that positional offsets for field 2e are within the same range as the other fields. However, σB represents baseline (i.e., gradient-independent) noise, which is substantially greater for field 2e. A tentative explanation is that field 2e has a low mean intensity, and therefore exhibits relatively high quantum noise. Quantum noise is proportional to the inverse of the square root of image intensity. Figure 8 plots σB versus the inverse of the square root of image intensity, restricted to low gradient pixels (those with relative gradient in the range [0,2.5]). The plot shows reasonable correlation, lending support to the above explanation.
FIG. 8.
Plot of the baseline noise parameter σB (see Eq. (2)) versus the inverse of the square root of image intensity, restricted to low gradient pixels (those with relative gradient in the range [0,2.5]) for the step-and-shoot fields of Fig. 2. Quantum noise is proportional to the inverse of the square root of image intensity. To the extent that the plot exhibits a possible linear relationship, it suggests that σB is a surrogate for quantum noise.
III.E. Gamma distributions for dynamic images
Figures 4(b)–4(f) show the continuous and discrete gamma distributions obtained in the presence of 53 × 53 pixel, +2% and +5% anomalies. These are obtained by taking each of the fifty-seven 6 MV patient field images, inserting a 53 × 53 pixel +2% or +5% anomaly at a random location (such that the entire anomaly overlaps the region of above-threshold pixels), and aggregating the resulting gammas. All gamma distributions are calculated using registered images and 3%/3 mm criteria. (Gamma is calculated using the relative dose formulation—see details in Gordon et al.11 For gamma analysis, images are output variation corrected and registered, but no gradient scaling or median filtering is performed. While necessary for PID-based detection, registration does not have a dramatic effect on gamma-based detection. The DTA search makes gamma somewhat robust to offsets.)
Figure 4(b) shows that most continuous gamma values fall close to zero, but the distribution has a long tail extending up to ∼1.7. Discrete gammas fall further from zero with a distribution tail extending up to ∼1.9. The substantial difference between the continuous and discrete gamma distributions is a result of the errors inherent in gamma calculations on finite grids. The discrete gamma distribution has spikes at gamma values: (0.37 mm/3 mm) * ≈ 0.12 , where i and j are discrete pixel offsets obtained from the DTA search. Pixels whose minimum gamma value is found at offsets (i,j) = (0,1) or (1,0) fall into the spike at 0.12, and so on. When discrete gammas are calculated on a progressively finer grid [Figs. 4(c) and 4(e)], the number of spikes increases and the discrete distribution converges to the continuous distribution.
Figures 4(d) and 4(f) show the same plots as in Figs. 4(c) and 4(e), but with modified x- and y-scales. Anomalous pixels are not easy to identify in the gamma distributions. In the continuous distribution the 2% anomaly shows up as a low hump around 0.2, and the 5% anomaly as a low hump around 0.4. In the discrete distributions, they are obscured by the spikes described above. Note that although the inserted anomalies differed by +2% or +5% from the reference image, the corresponding anomalous gamma values are not centered around 2.0/3.0 = 0.67 or 5.0/3.0 = 1.67 as one might expect. Although the residual global offsets between (unregistered) images are fractions of a pixel, the DTA search (performed out to a distance of 10 mm) finds minimum gamma values at large pixel offsets. For the 5% anomaly, calculated on 0.37 mm grid, these range from 0 to 14 pixels, with a mean of ∼3 and a SD of ∼2. The end result of the DTA search is that anomalous gamma values are reduced, and end up having a mean of ∼0.2 (+2% anomalies) and ∼0.4 (+5% anomalies). This reduction occurs for both continuous and discrete gammas.
III.F. Gamma distributions for step-and-shoot images
Gamma distributions for step-and-shoot fields (not shown) are similar to those for the dynamic image, though the mean and SD are generally a little larger. For example, for the dynamic image the mean and SD of continuous gamma values is ∼0.02. For the step-and-shoot fields except field 2e, means and SDs are in the range [0.03,0.05]. Field 2e is again an outlier, by virtue of having mean and SD that are significantly larger than (approximately triple) the other nine fields.
III.G. Detection study for the dynamic field
Results of the detection study for 6 MV images are given in Tables III and IV. Results for 18 MV images are qualitatively similar, so are not shown. Table III gives results for detection strategies based on gamma and PID values calculated with respect to a reference image that is the mean of output-variation-corrected registered images. Table IV gives corresponding results when gamma and PID values are calculated with respect to a reference image that is the first of the fifty-seven 6 MV images.
The numbers in Tables III and IV are the percentages of images that are correctly classified as good / bad (i.e., max_acc() as defined in Sec. II E). For example, Table III shows that for 3 × 3 pixel anomalies, in which dose is raised or lowered by 5% (i.e., the 3 × 3, 5% row), PID-based detection strategies can correctly classify up to 99% of images. (The value max_acc = 99 is achieved in the PID 1 × 1 column.) In contrast, for this size anomaly, the investigated gamma-based detection strategies correctly classify 51% and 50% of images, which is what one would expect if one were to randomly guess whether an image is errored.
Table III shows that if one requires maximum classification accuracy ≥95%, PID-based classifiers can detect fluence anomalies ≥5% in ∼1 mm2 regions, ≥2% in ∼5 mm2 regions, and ≥1% in ∼10 mm2 regions. Gamma-based classifiers (with 3%/3 mm criteria and threshold of one) can detect anomalies ≥10% in ∼20 mm2 regions. Table IV shows the effect on detection of using the first measured image (e.g., a sampled image) as the reference image. Detection performance is poorer than in Table III, which we attribute to the additional noise in the reference image. Using the mean image as the reference has the effect of suppressing some detector noise.
The detection study is additionally performed while completely omitting the step of output variation correction. Results are not shown here, but are inferior to those in Table III. Even though the SD of output variations in 6 MV patient field images is only 0.3%, failure to perform output variation correction significantly degrades the ability of PID-based strategies to detect larger anomalies (e.g., 53 × 53 pixel anomalies). It has much less impact on PID-based detection of small anomalies—for smaller anomalies detection is degraded only slightly.
III.H. Detection study for the step-and-shoot fields
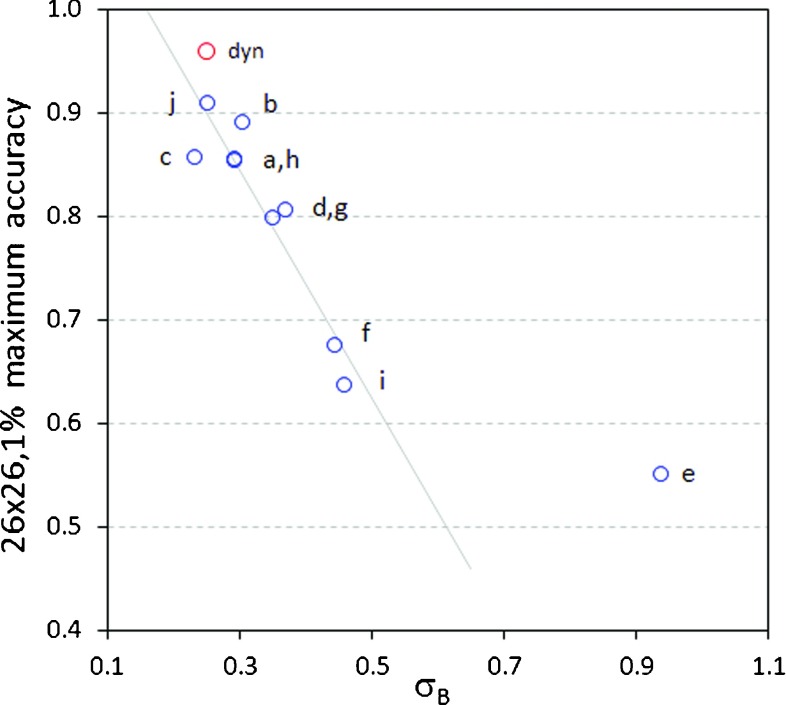
Table V shows the maximum accuracy obtained over all PID-based classifiers for the dynamic field of Fig. 1(a) and the ten step-and-shoot fields of Fig. 2. For PID-based classifiers utilizing gradient scaling, image-specific gradient parameters σB, σx, and σy are employed. For anomalies with dose differences ≥5% (including 3 × 3 and 6 × 6 pixel anomalies), detection performance for the step-and-shoot fields is roughly comparable to the dynamic field. For smaller dose differences (1% and 2%), even for large 26 × 26 and 53 × 53 pixel anomalies, detection performance is poorer than for the dynamic field. This is attributed to the higher level of baseline (gradient-independent) noise in the step-and-shoot fields. Figure 9 plots detection accuracy for 26 × 26, 1% anomalies against the baseline noise SD σB. Except for the outlier field 2e, all points exhibit a linear relationship between detection accuracy and σB. Because the dynamic field achieves the lowest value of σB, it also achieves the highest detection accuracy. For outlier field 2e, σB = 0.94%. When the SD of background image noise approaches 1%, it is intuitively clear that the task of detecting small (1% or 2%) dose differences becomes much more difficult, if not impossible. In contrast, larger dose differences (≥5%) can still be detected. In all cases PID-based classifiers out-perform 3%/3 mm gamma detection, with gamma calculated either discretely or continuously.
FIG. 9.
Plot of the maximum detection accuracy achieved for 26 × 26, 1% anomalies, as a function of the measured baseline noise parameter σB. The red point represents the accuracy achieved for the dynamic field of Fig. 1(a). Blue points are for the step-and-shoot fields of Fig. 2. All fields except the outlier 2(e) exhibit a linear relationship between detection accuracy and σB.
IV. DISCUSSION
IMRT pretreatment QA is one of the checks on the safety and accuracy of radiation therapy. The EPID is an attractive device for performing this task due to its dosimetric accuracy and high spatial resolution. The aS1000 EPID as used here had an effective 0.37 mm pixel spacing at the isocenter plane, and therefore has the potential for submillimeter spatial resolution. Other devices currently used for IMRT PTQA include ion chamber arrays with detector spacing of, e.g., 7 mm, which provide coarser spatial resolution. Image-guided radiation therapy is seeking to achieve delivery accuracy on the order of a few millimeters. It therefore makes sense to use QA devices that are accurate below this limit. Referring to basic engineering principles,9 with an accuracy requirement of 2 mm the measurement device should be capable of discerning ∼0.2 mm positional offsets. Use of appropriate quality assurance devices with sufficient dosimetric (or fluence) and spatial resolution is required to verify that techniques provide the claimed accuracy.
There are two conceptual approaches to defining what constitutes a PTQA fluence anomaly (i.e., delivery error). From dosimetric accuracy requirements, one can work backwards to deduce the level of fluence anomalies that can be tolerated in a single IMRT field while still achieving the intended therapeutic outcome. This is a difficult process which, to the authors’ knowledge, has not been done. (For insight, see the analysis by Nelms et al.8 of the correlation between clinical and QA metrics.) Conventional gamma analysis, typically performed with gamma calculated on a discrete grid, has not been justified in this way. It tends to be used without justification, or used in conjunction with parameter values that give acceptable (i.e., manageable) numbers of “errored” images, rather than rigorously verified detection accuracy.17,18
The other conceptual approach is to define a fluence anomaly as any deviation that can be reliably detected above “normal” background fluence deviations. This approach is adopted for the present work. It has the practical advantage of providing a well-defined answer, based on measureable characteristics of acquired images. Accordingly, this work attempted to characterize background fluence deviations using repeat images of IMRT fields, and then to rigorously quantify the anomalies that can be detected for those fields using PID- or gamma-based classifiers. This approach permits a logical separation between the tasks of detecting fluence anomalies, evaluating their dosimetric impact, and determining if the dosimetric impact is of clinical concern. If one can reliably detect anomalies, separate analysis and criteria can then be used to evaluate whether or not the anomalies are dosimetrically significant.
The main focus of this work is on understanding PID-based anomaly detection. PID values across an image are the result of two effects: (i) baseline noise that is approximately statistically uniform across the image, and (ii) large PID values occurring in regions of high gradients, caused by interaction between intensity gradients and small positional deviations of jaws and MLC leaves. Relative gradients in the patient field of Fig. 1(a) extend up to 45 (i.e., 45% change in intensity per pixel). These large gradients are due to the EPID's low-scatter conditions (i.e., low water-equivalent depth of image capture), and the high resolution of the detector array.
Global positional variations in EPID images, which can be reduced via accurate registration, are less than 0.4 pixels or 0.15 mm (Table II). Residual local positional deviations are estimated in Secs. III C and III D to fall within 3σ bounds of ∼0.3 pixels or ±0.1 mm. These shifts are so small that by themselves they are likely to have small dosimetric impact. However, they can still interact with high gradients to produce PID values of 5%–10% or more. These large PID values in turn make it more difficult to detect larger anomalous regions (e.g., missing or misweighted segments), which might be dosimetrically significant. This work shows that gradient scaled PIDs can significantly reduce this problem, enabling smaller dose differences to be detected. This is illustrated in Fig. 6, which shows PID and GSPID images of a measured image into which a 20 × 20 pixel, +2% fluence anomaly has been inserted. The anomaly is detectable in the GSPID image due to the suppression of large gradient-associated PID values.
Further observations and qualifications regarding this study are as follows. Results are expected to be generally applicable to aSi EPIDs. Commercial aSi EPIDs have comparable dosimetric properties and therefore detection capabilities. However, results may depend on the detector spacing and detector properties. Optimal detection parameters may need to be determined for other EPIDs. Similarly, different linacs and/or MLCs may exhibit different characteristics, e.g., different ability to faithfully deliver highly modulated fields, or modulated fields at high dose rates. The results presented here are for a Varian Trilogy linac. Results may vary for other linacs. However, the methods presented here are general, and can be applied to all linacs, MLCs, and EPIDs.
This study used standard dark/flood field calibration as described in vendor (Varian) documentation. This type of calibration is satisfactory for the present study because all images are taken at 105 cm SID, and reference images are obtained from measured images. More elaborate calibration, as described, e.g., by Greer,19 may be required in a clinical workflow where images are acquired at different SIDs and/or reference images are computed.
In this work PID-based classifiers are compared with two gamma classifiers utilizing commonly adopted 3%/3 mm criteria. Although the gamma classifiers performed relatively poorly, this is due to the fact that the 3%/3 mm gamma criteria are sub-optimal. The follow-on paper11 shows that if gamma is used with optimal parameters, parameters that are based on measured image properties instead of intuitive appeal, gamma classifiers perform as well as the PID-based classifiers explored here. Detailed examination of gamma detection is outside the scope of the present paper.
This study used a relatively small sample of 11 images and found some variation in image properties, such as the baseline noise SD σB. In particular, it found that the ten step-and-shoot fields exhibited larger values of σB than the dynamic field, with field 2e being a notable outlier. Possible reasons for the increased baseline noise in the step-and-shoot images include: the higher dose rate at which the step-and-shoot fields are delivered resulted in greater deviations between actual and intended MLC leaf positions; the step-and-shoot fields happened to have lower mean intensity resulting in increased quantum noise; the less rigorous registration of the step-and-shoot images, utilizing translations but not rotations, resulted in noisier reference images; and, the lower number of measured step-and-shoot fields resulted in noisier reference images leading to greater baseline PID variability. Going forward, it is desirable to apply the analysis techniques of this work to a larger population of IMRT images, in order to determine the normal range of IMRT image properties. The techniques developed here provide a framework for image analysis.
This work used reference images derived from measured images. This side-stepped any errors that could be introduced into the reference image through the use of analytic or Monte Carlo EPID image prediction algorithms. Collection of repeated images of the same field is not feasible in a clinical setting, and so the reference image must be modeled/computed. Detection performance with computed reference images remains to be determined through further research. To the extent that a computed reference image reproduces an individual measured image, or the mean of multiple measured images, detection performance will be similar to results given here. By definition, the best reference image is the one that produces the greatest detection accuracy, when sampled over a sufficiently large number of measured images.
This work considered rectangular-shaped anomalies in which intensity is uniformly increased or decreased by some percentage. Detection performance with other error shapes or profiles could vary. However, contiguous errored regions are likely to conform to fairly simple shapes, and so detection strategies which have been validated for rectangular anomalies are likely to provide a good starting point for detecting more generally shaped errors. In particular, the detection strategies discussed here can be used to detect irregularly shaped anomalies, as long as they contain a rectangular anomaly of sufficient size.
Accurate image registration reduces spurious noise in PID distributions, and is therefore an important component of PID-based detection approaches. The cross-correlation algorithm performed very well at detecting translations, and can easily be employed in a clinical implementation. The PF algorithm requires picket fence images to be acquired at the same time as the IMRT images. In a clinical implementation, rotations and scale changes can alternatively be detected by employing IMRT image features—specifically, MLC leaf gaps and jaw edges, which are easily resolvable in the IMRT images—thus avoiding the need for picket fence images. Importantly, this type of approach appears to significantly out-perform cross-correlation methods for detecting rotations and scale changes.
This work makes no judgment about the levels of anomalies that are dosimetrically (i.e., clinically) significant. It focuses on the sizes of anomalies that can be detected, not what size anomalies need to be detected in order to maintain tumor control or normal tissue complications at acceptable levels. Further research is needed to address this question. However, this work assists by establishing rigorous lower bounds on the sizes of anomalies that can be reliably detected.
Once fluence deviations can be reliably detected, we expect the next step to be the development of methods for translating those fluence deviations into corresponding 3D patient dose deviations. This could be done, e.g., by using measured fluences to reconstruct “delivered” dose to the patient planning anatomy. (See the section in van Elmpt2 on “3D dose reconstruction based on nontransmission images.”) Although this step is outside the scope of the present work, we note that it motivates performing IMRT QA on a field-by-field basis, instead of looking only at composite 2D fluence which is the practice at some institutions. Ultimately one would like to assess the accuracy of 3D dose delivery, and for this one needs to preserve field-by-field information.
The anomaly detection investigated in this work need not (should not) be the only type of pretreatment QA that is performed. Anomaly detection is but one part of the QA chain. Using the EPID images, one could also, for example, flag output variations as delivery errors if they exceed a threshold. Similarly, one could flag image alignment values, or look for shifts in high gradient contours in the image that do not result in dose being raised or lowered over a significant contiguous area. We believe the approach proposed here will complement rather than displace other QA tests. In fact, detection of smaller anomalies using the proposed approach should occur only after one has done preliminary tests to rule out grosser anomalies (e.g., output variations or whole missing segments), which could distort the results of finer-grained anomaly detection.
V. CONCLUSIONS
In the context of IMRT pretreatment QA, repeat measurements show that EPID images are subject to positional deviations which, although small, interact with steep image gradients to produce large intensity deviations with respect to a reference image. Accurate registration and gradient scaling can suppress these artifacts. When combined with a further filter to suppress random background noise, it then becomes possible to detect small fluence anomalies, e.g., anomalies of ≥5% in ∼5 mm2 regions. The approach proposed here logically separates the tasks of detecting anomalies and evaluating their clinical significance, basing detection on measurable image properties. The ability to resolve small anomalies will allow the accuracy of advanced treatment techniques, such as image guided, adaptive, and arc therapies, to be quantified.
ACKNOWLEDGMENTS
The authors gratefully acknowledge research support from Varian Oncology Systems. The authors have submitted a patent application covering some of the algorithms and methods in this work.
REFERENCES
- 1. Herman M. G., “Clinical use of electronic portal imaging,” Semin. Radiat. Oncol. 15(3), 157–167 (2005). 10.1016/j.semradonc.2005.01.002 [DOI] [PubMed] [Google Scholar]
- 2. van Elmpt W. et al. , “A literature review of electronic portal imaging for radiotherapy dosimetry,” Radiother. Oncol. 88(3), 289–309 (2008). 10.1016/j.radonc.2008.07.008 [DOI] [PubMed] [Google Scholar]
- 3. Siebers J. V., Kim J. O., Ko L., Keall P. J., and Mohan R., “Monte Carlo computation of dosimetric amorphous silicon electronic portal images,” Med. Phys. 31(7), 2135–2146 (2004). 10.1118/1.1764392 [DOI] [PubMed] [Google Scholar]
- 4. Van Esch A., Depuydt T., and Huyskens D. P., “The use of an aSi-based EPID for routine absolute dosimetric pre-treatment verification of dynamic IMRT fields,” Radiother. Oncol. 71(2), 223–234 (2004). 10.1016/j.radonc.2004.02.018 [DOI] [PubMed] [Google Scholar]
- 5. Yan G. et al. , “On the sensitivity of patient-specific IMRT QA to MLC positioning errors,” J. Appl. Clin. Med. Phys. 10(1), 120–128 (2009). 10.1120/jacmp.v10i1.2915 [DOI] [PMC free article] [PubMed] [Google Scholar]
- 6. Low D. A., Harms W. B., Mutic S., and Purdy J. A., “A technique for the quantitative evaluation of dose distributions,” Med. Phys. 25(5), 656–661 (1998). 10.1118/1.598248 [DOI] [PubMed] [Google Scholar]
- 7. Low D. A. and Dempsey J. F., “Evaluation of the gamma dose distribution comparison method,” Med. Phys. 30(9), 2455–2464 (2003). 10.1118/1.1598711 [DOI] [PubMed] [Google Scholar]
- 8. Nelms B. E., Zhen H., and Tome W. A., “Per-beam, planar IMRT QA passing rates do not predict clinically relevant patient dose errors,” Med. Phys. 38(2), 1037–1044 (2011). 10.1118/1.3544657 [DOI] [PMC free article] [PubMed] [Google Scholar]
- 9. Harry M. J., Mann P. S., Hodgins O. C. D., Hulbert R. L., and Lacke C. J., Practitioner's Guide to Statistics and Lean Six Sigma for Process Improvements, 1st ed. (Wiley & Sons, Hoboken, NJ, 2010). [Google Scholar]
- 10. Nelms B. E. and Simon J. A., “A survey on planar IMRT QA analysis,” J. Appl. Clin. Med. Phys. 8, 76–90 (2007). [DOI] [PMC free article] [PubMed] [Google Scholar]
- 11. Gordon J. J. and Siebers J. V., “Detection of fluence anomalies via gamma analysis of EPID images,” (submitted).
- 12. Ju T., Simpson T., Deasy J. O., and Low D. A., “Geometric interpretation of the γ dose distribution comparison technique: Interpolation-free calculation,” Med. Phys. 35(3), 879–887 (2008). 10.1118/1.2836952 [DOI] [PubMed] [Google Scholar]
- 13. Wendling M. et al. , “A fast algorithm for gamma evaluation in 3D,” Med. Phys. 34(5), 1647–1654 (2007). 10.1118/1.2721657 [DOI] [PubMed] [Google Scholar]
- 14. Guizar-Sicairos M., Thurman S. T., and Fienup J. R., “Efficient subpixel image registration algorithms,” Opt. Lett. 33(2), 156–158 (2008). 10.1364/OL.33.000156 [DOI] [PubMed] [Google Scholar]
- 15. See http://www.mathworks.com/matlabcentral/fileexchange/18401-efficient-subpixel-image-registration-by-cross-correlation for MATLAB code.
- 16. Munro P. and Bouius D. C., “X-ray quantum limited portal imaging using amorphous silicon flat-panel arrays,” Med. Phys. 25, 689–702 (1998). 10.1118/1.598252 [DOI] [PubMed] [Google Scholar]
- 17. van Zijtveld M., Dirkx M., Breuers M., de Boer H., and Heijmen B., “Portal dose image prediction for in vivo treatment verification completely based on EPID measurements,” Med. Phys. 36(3), 946–952 (2009). 10.1118/1.3070545 [DOI] [PubMed] [Google Scholar]
- 18. Ezzell G. A. et al. , “IMRT commissioning: Multiple institution planning and dosimetry comparisons, a report from AAPM Task Group 119,” Med. Phys. 36(11), 5359–5373 (2009). 10.1118/1.3238104 [DOI] [PubMed] [Google Scholar]
- 19. Greer P. B., “Correction of pixel sensitivity variation and off-axis response for amorphous silicon EPID dosimetry,” Med. Phys. 32(12), 3558–3568 (2005). 10.1118/1.2128498 [DOI] [PubMed] [Google Scholar]


