Abstract
Purpose:
Measuring the size of nodules on chest CT is important for lung cancer staging and measuring therapy response. 3D volumetry has been proposed as a more robust alternative to 1D and 2D sizing methods. There have also been substantial advances in methods to reduce radiation dose in CT. The purpose of this work was to investigate the effect of dose reduction and reconstruction methods on variability in 3D lung-nodule volumetry.
Methods:
Reduced-dose CT scans were simulated by applying a noise-addition tool to the raw (sinogram) data from clinically indicated patient scans acquired on a multidetector-row CT scanner (Definition Flash, Siemens Healthcare). Scans were simulated at 25%, 10%, and 3% of the dose of their clinical protocol (CTDIvol of 20.9 mGy), corresponding to CTDIvol values of 5.2, 2.1, and 0.6 mGy. Simulated reduced-dose data were reconstructed with both conventional filtered backprojection (B45 kernel) and iterative reconstruction methods (SAFIRE: I44 strength 3 and I50 strength 3). Three lab technologist readers contoured “measurable” nodules in 33 patients under each of the different acquisition/reconstruction conditions in a blinded study design. Of the 33 measurable nodules, 17 were used to estimate repeatability with their clinical reference protocol, as well as interdose and inter-reconstruction-method reproducibilities. The authors compared the resulting distributions of proportional differences across dose and reconstruction methods by analyzing their means, standard deviations (SDs), and t-test and F-test results.
Results:
The clinical-dose repeatability experiment yielded a mean proportional difference of 1.1% and SD of 5.5%. The interdose reproducibility experiments gave mean differences ranging from −5.6% to −1.7% and SDs ranging from 6.3% to 9.9%. The inter-reconstruction-method reproducibility experiments gave mean differences of 2.0% (I44 strength 3) and −0.3% (I50 strength 3), and SDs were identical at 7.3%. For the subset of repeatability cases, inter-reconstruction-method mean/SD pairs were (1.4%, 6.3%) and (−0.7%, 7.2%) for I44 strength 3 and I50 strength 3, respectively. Analysis of representative nodules confirmed that reader variability appeared unaffected by dose or reconstruction method.
Conclusions:
Lung-nodule volumetry was extremely robust to the radiation-dose level, down to the minimum scanner-supported dose settings. In addition, volumetry was robust to the reconstruction methods used in this study, which included both conventional filtered backprojection and iterative methods.
Keywords: CT, nodules, volumetry, dose, reconstruction
1. INTRODUCTION
Lung nodule size is an important quantitative imaging biomarker, both for staging lung cancer and quantifying disease progression or response to therapy. For example, the International Association for the Study of Lung Cancer’s tumor-node-metastasis classification system uses an in-plane tumor diameter measurement as one of the primary components in lung cancer staging.1 While 2D tumor size measurements are typically used in clinical practice, 3D volume measurements are growing in importance due to evidence that 3D volumetry is more robust for quantifying tumor size.2 Although lung-nodule volumetry has the potential to improve patient management, there remains a great deal of variability in the execution of this quantitative measurement. For example, previous studies have shown that measurement variability depends on the reconstructed slice thickness.2,3 Additionally, scan dose and reconstruction method are factors which could theoretically affect the quality of lung-nodule volumetry, though there is not yet consensus on the effects of these factors.4 Despite the increased availability of dose-reduction techniques, it is not obvious how to reduce the dose in thoracic CT (or perhaps just as importantly, how far to reduce the dose) while preserving the quality of lung-nodule volumetry. Research in this area has typically fallen into two categories: phantom studies and in vivo clinical studies.
Phantom studies, while lacking in clinical realism, have allowed researchers to explore a large swath of the dose-reconstruction space without irradiating patients. For example, Chen et al. studied the effects of dose and reconstruction method on nodule volumetry using a thorax phantom with synthetic nodules. Under certain conditions, they found differences in volume accuracy with images reconstructed by iterative methods (ASiR and MBIR, GE Healthcare, Waukesha, WI) versus standard filtered backprojection (FBP) methods.5 However, precision was comparable across reconstruction methods and dose levels ranging from 0.2 to 7.5 mGy (CTDIvol). Willemink et al. reported no clinically relevant volume differences on images reconstructed with another iterative reconstruction method (iDose, Philips Healthcare, Cleveland, OH) versus FBP for doses ranging from 0.5 to 5.2 mGy.6 In a phantom with simulated ground-glass-opacity (GGO) nodules, Linning and Daqing found that tube current could affect the accuracy of volume measurements.7 Gavrielides et al. investigated the effects of various factors on volume bias, and while reconstruction kernel was a significant individual factor, exposure was not found to be significant over the range of doses tested.8 In another thoracic phantom study, Doo et al. found that iterative reconstruction (AIDR, Toshiba America Medical, Tustin, CA) improved volume accuracy relative to standard FBP, particularly for smaller nodules and lower tube currents.9 Wielputz et al. used a porcine lung phantom with artificial nodules and found a different result; iterative reconstruction (SAFIRE, Siemens Healthcare, Forchheim, Germany) did not change volume accuracy relative to FBP.10 However, bias increased significantly for both the FBP and iterative methods when CTDIvol was less than 1.0 mGy.
To limit radiation to patients, in vivo studies have typically been limited to studying a smaller part of the dose-reconstruction space. For example, Rampinelli et al. performed two consecutive reduced-dose and two consecutive standard-dose scans for each patient.11 They calculated proportional differences between nodule volumes on consecutive scans at each dose level (i.e., intradose repeatability). Differences ranged from −27% to 40% at standard dose (95% limits of agreement) and from −38% to 60% at reduced dose. However, because they used different slice thicknesses (0.625 and 2.5 mm) for the two protocols, this may have contributed to their large limits. In another clinical study, Hein et al. scanned each patient twice, once at standard dose and once using a substantially reduced-dose protocol.12 Two readers measured nodule volumes at both dose levels, and the authors reported inter-reader, intradose differences as well as intrareader, interdose differences. At standard dose, inter-reader differences ranged from −9.7% to 8.3% (95% limits of agreement). At reduced dose, inter-reader differences ranged from −12.6% to 12.4%, suggesting that one or both readers became slightly less precise. Intrareader, interdose differences were similar, however, so the authors concluded that volume reproducibility was independent of dose.
In this work, we took a hybrid approach to exploring the dose-reconstruction space which combined the realism of clinical nodules from patient scans and the ability to explore multiple dose levels, all without any additional radiation to the patients. Recently, researchers demonstrated that it is possibleto simulate multiple reduced-dose scans from a single clinical scan by obtaining the raw sinogram data from the clinical scan and applying an appropriate noise model.13–16 Using this approach, we designed several experiments, based on simulated reduced-dose patient scans containing actual lung nodules, to investigate the effects of scan dose and reconstruction method on lung-nodule volumetry. This paper explains our experimental designs for quantifying clinical-dose repeatability as well as interdose and inter-reconstruction-method reproducibilities (Sec. 2), the results of those experiments (Sec. 3), and a discussion of our findings in lung-nodule volumetry (Sec. 4).
2. MATERIALS AND METHODS
Our experiments involved four main stages: simulating reduced-dose scans (Sec. 2.A), validating our simulations on phantom data (Sec. 2.B), designing reader studies for quantifying sources of variability (Sec. 2.C), and selecting appropriate statistical analysis tools (Sec. 2.D).
2.A. Simulating reduced-dose scans
Zabic et al. summarized a variety of techniques for simulating reduced-dose scans by adding noise to the raw sinogram data from a single clinical scan.15 They also described and extensively validated their own simulation tool on a multidetector-row CT (iCT, Philips Healthcare, Cleveland, OH). In this work, we applied their approach to one of our own multidetector-row CT scanners equipped with both tube-current modulation (TCM) and iterative-reconstruction capabilities (Definition Flash with CareDose4D and SAFIRE, Siemens Healthcare, Forchheim, Germany). Air scans were used to estimate the photon fluence and bowtie filter shape, and noise was added based on sampling from an alteredPoisson distribution [Ref. 15, Eq. (6)]. Through a research agreement with Siemens Healthcare, we have access to matlab R2013a libraries (Mathworks, Natick, MA) for extracting the raw sinogram data and TCM information from patient scans. The TCM curves scale linearly with quality reference mAs setting for the most part (except when scanner minimum and maximum mA values are encountered); therefore, we modeled dose reduction as a linear scaling of the TCM function by a constant factor because we do not know all of the details of Siemens’ proprietary TCM-generation algorithm. Thus, for a given clinical TCM function f(x, y, z) with in-plane and z-modulation, we simulated the reduced-dose TCM function as ρ∗f(x, y, z), where ρ is a constant fraction between 0 and 1. This reduced-dose TCM function was used to calculate the photon fluences for each projection in the helical scan trajectory, which we then used as input to the noise-addition model. After simulating reduced-dose sinograms, we converted the data back into their original format so that they could be reimported to the scanner workstation for reconstruction. Thus, for a given reduced-dose sinogram, we could reconstruct with any reconstruction method and slice thickness available on the scanner.
2.B. Validation of reduced-dose simulations
To validate our reduced-dose simulations, we compared physical scans and simulated reduced-dose scans using an anthropomorphic chest/lung phantom (Radiology Support Devices, Inc., Long Beach, CA). This phantom was heterogeneous in x, y, and z and provided realistic attenuation for the TCM system. The phantom was scanned on the same Definition Flash scanner, but with a wide range of quality reference mAs values from 300 to 7 (corresponding to scanner-reported CTDIvol values from 12.0 to 0.4 mGy). The quality reference mAs setting of 7 was the minimum value supported by the scanner for our pitch 1.5 test protocol with a 0.5 s rotation time. All phantom images were reconstructed with 0.6 mm slice thickness to test the model under highest noise conditions and B45 kernel to match our routine chest protocol. To generate a set of reduced-dose scans for comparison, we used the highest-dose phantom scan (300 quality reference mAs) and applied the noise model to simulate reduced-dose scans at the same mAs settings used in the physical scans, down to quality reference 7 mAs.
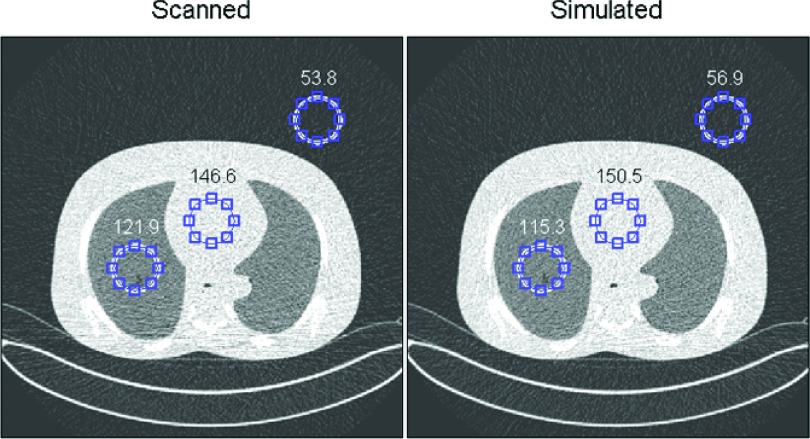
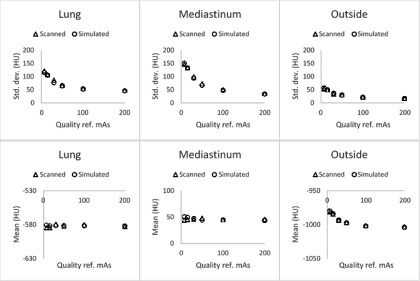
Reconstructed images of the physical scans at various dose levels and the simulated reduced-dose scans at the same dose levels showed good qualitative agreement (Fig. 1). For a quantitative comparison, the means and standard deviations (SDs) of the Hounsfeld-unit (HU) values were computed at three different locations within a slice (representing the lung, the mediastinum, and an area outside of the phantom). We then compared the paired differences between measured and simulated means/SDs across quality reference mAs settings. The results in Fig. 2 and Table I demonstrate that the HU means and standard deviations agreed very well at all dose levels tested. While this is not a definitive demonstration of agreement between physical and simulated scans, Figs. 1 and 2 provided confidence that realistic reduced-dose image series could be generated across the range of dose levels supported by the scanner model.
FIG. 1.
Torso phantom scanned at 7 quality reference mAs (left) and simulated 7 quality reference mAs derived from a 300 reference mAs scan (right) showed good qualitative agreement. Mean and standard deviations were calculated for each region of interest (“lung,” “mediastinum,” and “outside”). Standard deviations are shown.
FIG. 2.
Scanned and simulated means and standard deviations of the HU values in three regions of interest agreed well across a range of quality reference mAs settings from 7 (minimum scanner-supported tube-current setting) to 200 mAs.
TABLE I.
Paired differences between the scanned and simulated means/SDs within three regions of the phantom showed good agreement across all dose levels tested.
| Paired differences: Mean HU (μ, σ) | Paired differences: Standard deviation HU (μ, σ) | |
|---|---|---|
| Lung | (0.7, 2.1) | (−3.5, 3.6) |
| Mediastinum | (1.1, 3.4) | (−1.8, 3.2) |
| Outside | (0.1, 0.8) | (0.7, 1.5) |
2.C. Reader study design
Under IRB approval, the raw sinogram data from 64 chest CT scans were collected and anonymized. We selected scans based on the physicians’ clinical indications, which were recorded in the scanner log during the course of normal clinical operations. Scans with indications such as “pulmonary nodule,” “lung mass,” or “oncology follow-up” were exported (using the “Export CT Data” menu option on the scanner). In a second review of the image series, we excluded cases where we could not find the clinically indicated nodule, as well as cases with pleural or vessel-attached nodules. The second exclusion criterion was used to conform with the definition of a “measurable” nodule in the Quantitative Imaging Biomarkers Alliance (QIBA) profile document on tumor volume change, namely: “tumor margins are sufficiently conspicuous and geometrically simple enough to be recognized on all images.”17 The QIBA profile also specified a minimum in-plane diameter of 1 cm, which we did not use as an inclusion criterion for our study. Thirty-three cases remained after applying the exclusion criteria. Only one nodule per patient was measured in order to avoid potential bias due to a large number of nodules coming from the same scan.
All scans were performed with our routine, adult-chest protocols as follows: 120 kV, 0.5 s rotation time, 250–285 quality reference mAs, pitch 1, and CareDose 4D (TCM). We refer to this as our clinical “reference” protocol, which resulted in a CTDIvol of 20.9–23.8 mGy using the standard 32 cm CTDI body phantom (Table II).
TABLE II.
Clinical “reference” protocol based on our routine, adult-chest scan parameters.
| Clinical “reference” protocol | |
|---|---|
| kV | 120 |
| Rotation time | 0.5 s |
| Quality reference mAs | 250–285 |
| Pitch | 1 |
| TCM | On (CareDose 4D) |
| Reconstruction kernel | B45 |
| Dose to 32 cm CTDI phantom | 20.9–23.8 mGy |
For each patient with a nodule meeting the inclusion criteria, we generated reduced-dose sinograms at 25%, 10%, and 3% of clinical dose. We started at just 25% of clinical dose (75% dose reduction) because lung nodules are known to be high-contrast. In addition, some preliminary work indicated no dose-dependent trend in the measurement variability for nodules >1 cm.18 In terms of CTDIvol, our clinical protocols corresponded to 20.9–23.8 mGy in the standard 32 cm CTDI phantom, so the 3% dose level corresponded to 0.6–0.7 mGy.
After simulating reduced-dose sinograms, the sinogram data were imported back to the scanner and reconstructed with both conventional FBP and two settings from Siemens’ iterative reconstruction method (SAFIRE, Siemens Healthcare), resulting in three different reconstruction methods at each dose level: B45, I44 strength 3 (also denoted by I44S3), and I50 strength 3 (also denoted by I50S3). All images were reconstructed at 1 mm slice thickness. We then imported all DICOM images to our quantitative imaging workstation software for semiautomated contouring.19 All image series were further anonymized to hide the patient, dose level, and reconstruction-method information. For each case, the readers received the approximate slice number and xy coordinates of the nodule, and they were instructed to contour the nodule using their best judgment. The quantitative imaging workstation software provided a semiautomatic segmentation tool initialized via a click-and-drag operation, as well as tools for manually editing the resulting segmentations.
Three lab technologists trained in contouring lung nodules on CT scans contoured the nodules using a split study design at each reduced-dose level. At each reduced-dose level, the readers read all 33 cases but were randomly assigned to one of the three reconstruction methods. Thus, when we analyzed the results for a fixed reconstruction method (B45), the reader became a random effect, with each reader reading approximately 11 of the cases. The cases reconstructed by the other two methods (I44S3 and I50S3) were used as distractor cases to blind the readers to the dose level. The cases reconstructed with iterative methods had reduced noise and therefore somewhat mimicked a higher-dose case reconstructed with FBP.
At the clinical-dose level, a fully crossed design was used; the readers read all 33 cases with all reconstruction methods for a total of 99 contours. In addition, and only at the clinical-dose level, we randomly selected half (17) of the clinical-dose cases for a repeatability experiment. Those 17 cases were read with all three reconstruction methods for a total of 51 repeat contours for each reader. In total, each reader generated 249 semiautomated contours: 99 at reduced-dose levels (33 cases at three dose levels); 99 at the clinical-dose level (33 cases at 3 recon methods); and 51 for the repeatability study (17 cases at three recon methods). The study design is summarized in Table III.
TABLE III.
Summary of reader study design for reproducibility and repeatability experiments.
| Study component | Case type | Cases | Dose levels | Reconstructions | Contours per reader |
|---|---|---|---|---|---|
| Reproducibility | Clinical dose | 33 | 1 (100%) | All 3 (B45, I44S3, I50S3) | 99 |
| Reproducibility | Reduced dose | 33 | 3 (25%, 10%, 3%) | Readers randomly assigned—by case—to one of three recons (B45, I44S3, I50S3)a | 99 |
| Repeatability | Clinical dose | 17 | 1 (100%) | All 3 (B45, I44S3, I50S3) | 51 |
I44S3 and I50S3 were used as distractor cases to blind the readers to the dose level.
2.D. Statistical analyses
Our research question focused on the agreement of nodule volumetry across doses and reconstruction methods. We used a proportional difference metric described by Bland and Altman20 and recommended by the QIBA Metrology Working Group.21,22 Proportional differences between two volume measurements were calculated as follows:
| (1) |
Repeatability was defined as the distribution of proportional differences when V1 and V2 were measured by the same reader on the identical image series. Reproducibility was defined as the distribution of proportional differences when the dose or reconstruction method for V2 changed with respect to the reference protocol for V1 (again, same reader). In all cases, the first measurement of the nodule acquired at clinical dose and reconstructed with the B45 kernel (Table II) was taken as the reference volume V1.
Section 3 is divided into dose (Sec. 3.A) and reconstruction-method (Sec. 3.B) analyses. In the dose analysis, for the full set of 33 cases, we calculated the mean and SD of the proportional differences at each reduced-dose level. For the subset of 17 cases in the repeatability experiment, we compared baseline clinical-dose repeatability with the reproducibility at each reduced-dose level. In addition to means and SDs of the proportional differences, paired t-test and F-test p-values were calculated at each reduced-dose level to determine if changes in the mean and SD, relative to the repeatability results, were statistically significant. The hypothesis tests were performed with the proportional difference from the repeatability experiment as the first variable and the interdose proportional difference as the second variable, under the assumption of normally distributed proportional differences. A p-value of 0.05 was considered as the threshold for statistical significance in both tests. In a two-sided one-sample t-test, a sample size of 17 achieves 80% power to detect a 4.0% change in the mean proportional difference, given an estimated standard deviation of 5.5% and a significance level (alpha) of 0.05. The reconstruction-method analysis is analogous to the dose analysis, with reproducibility means and SDs for the full set of cases followed by a subanalysis for the repeated cases. The primary difference is that, due to the fully crossed study design at the clinical-dose level, we report three data points (one per reader) for every data point in the dose analysis. The same assumptions were made for hypothesis testing.
3. RESULTS
3.A. Dose
Under the reference protocol, the nodules ranged from 7 to 46 mm longest in-plane diameter, with an average of 18 mm (averaged across all readers, see Fig. 3). Twenty-five nodules were >10 mm in diameter, and four of these were >30 mm in diameter; in addition, eight nodules were less <10 mm in diameter.
FIG. 3.
Longest in-plane diameters for the full set of 33 nodules acquired under the reference protocol, averaged across readers.
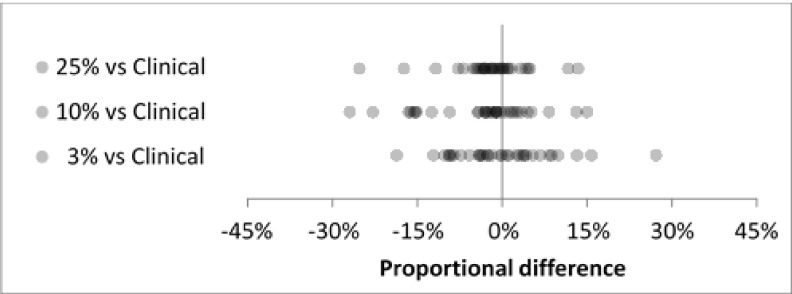
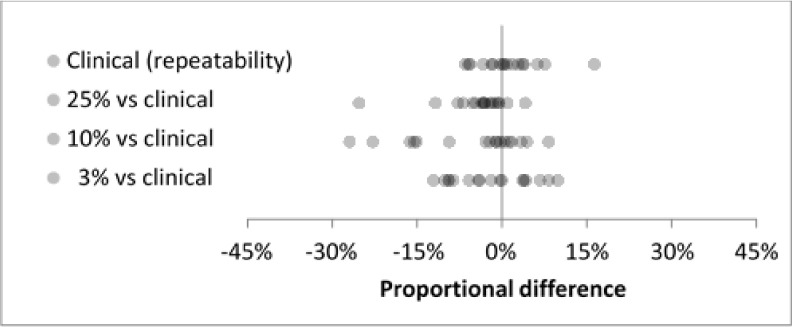
For the full set of 33 nodules, reproducibility distributions agreed well at the 25%, 10%, and 3% dose levels (Fig. 4). Mean proportional differences ranged from −3.7% to 0.0%, SD ranged from 7.0% to 9.4% (Table IV), and all differences were less than 30% in magnitude. For the subset of 17 cases in the repeatability experiment, baseline clinical-dose repeatability showed good agreement with interdose reproducibility (Fig. 5). The clinical-dose repeatability gave a mean proportional difference of 1.1% and SD of 5.5%. Interdose mean proportional differences ranged from −5.6% to −1.7% and SDs ranged from 6.3% to 9.9% (Table V).
FIG. 4.
Interdose reproducibility for all cases (N = 33) at three reduced-dose levels showed good agreement.
TABLE IV.
Summary statistics for interdose reproducibility distributions in Fig. 4.
| Dose level | N | Mean (%) | SD (%) |
|---|---|---|---|
| 25% vs clinical | 33 | −2.0 | 7.0 |
| 10% vs clinical | 33 | −3.7 | 9.4 |
| 3% vs clinical | 33 | 0.0 | 8.9 |
FIG. 5.
Clinical-dose repeatability (top row) and interdose reproducibility (rows 2–4) for the subset of 17 cases in the repeatability experiment. Interdose reproducibility showed good agreement with the baseline repeatability at clinical dose.
TABLE V.
Summary statistics for Fig. 5. Paired t-test and F-test p-values were calculated by testing the clinical (repeatability) distribution against each reduced-dose reproducibility distribution.
| Dose level | N | Mean (%) | SD (%) | Paired t-test p-value | F-test p-value |
|---|---|---|---|---|---|
| Clinical (repeatability) | 17 | 1.1 | 5.5 | ||
| 25% vs clinical | 17 | −4.5 | 6.3 | 0.04a | 0.22 |
| 10% vs clinical | 17 | −5.6 | 9.9 | 0.03a | 0.0002a |
| 3% vs clinical | 17 | −1.7 | 6.8 | 0.53 | 0.11 |
The p-value was statistically-significant.
Means of the repeatability and reproducibility distributions differed significantly at 25% dose and 10% dose (p = 0.04 and p = 0.03), while the mean difference at 3% dose was not significant (p = 0.53). Variances were significantly different at 10% dose (p = 0.0002), while the variances at 25% and 3% doses were consistent with the clinical-dose variance.
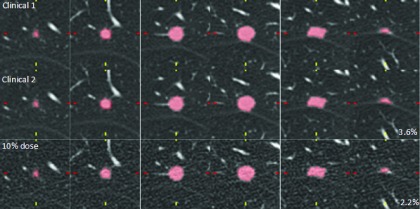
In Fig. 6, we compared reader 1’s first clinical-dose measurement (clinical 1), second clinical-dose measurement of the same scan of the same nodule (clinical 2), and 10%-dose measurement for an 11 mm nodule. All three volumes extracted from the contours were consistent, with proportional differences of only 3.6% (clinical 2) and −2.2% (10% dose) with respect to the clinical reference measurement (clinical 1).
FIG. 6.
Axial slices through an 11 mm nodule at clinical dose (measurements 1 and 2) and 10% dose. The reader’s contours were consistent, with proportional differences of 3.6% and −2.2% for clinical 2 and 10% dose, respectively. Images were reconstructed every 1 mm but this figure only shows every 2 mm for convenience.
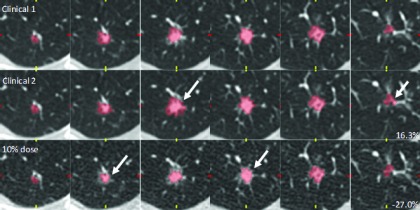
Figure 7 shows a different example of a 10 mm spiculated nodule. Contours are shown for reader 1 at clinical dose (measurements 1 and 2) and 10% dose. Comparing clinical-dose measurements 1 and 2 on the identical image series, there were clear differences at the spiculated boundary of the nodule and similarly for the 10%-dose measurement. As a result, the magnitudes of the proportional differences were larger than in the previous example: 16.3% (clinical 2) and −27.0% (10% dose).
FIG. 7.
Axial slices through a 10 mm nodule at clinical dose (measurements 1 and 2) and 10% dose. Reader 1’s contours showed some disagreement due to the complexity of the spiculated nodule boundary. Proportional differences were 16.3% (Clinical 2) and −27.0% (10% dose). Again, images were reconstructed every 1 mm but this figure only shows every 2 mm for convenience.
3.B. Reconstruction method
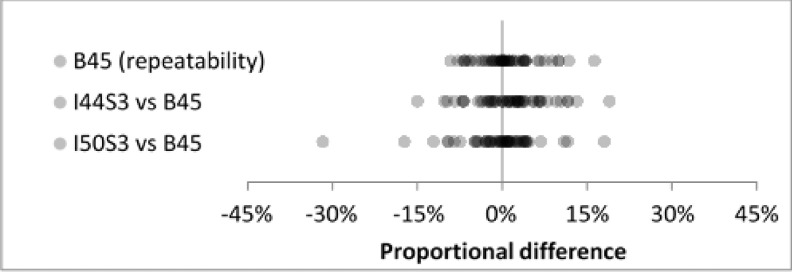
Inter-reconstruction-method reproducibility for the two iterative methods (I44 strength 3 and I50 strength 3) showed good agreement for the full set of nodules (Fig. 8). Mean proportional differences were 2.0% and −0.3%, SDs were identical at 7.3% (Table VI), and all differences except one were less than 30% in magnitude. For the subset of 17 cases in the repeatability experiment, baseline repeatability under the B45 method agreed well with inter-reconstruction-method reproducibility (Fig. 9). Baseline repeatability gave a mean of 0.8% and SD of 5.1%. Inter-reconstruction-method mean/SD pairs were (1.4%, 6.3%) and (−0.7%, 7.2%) for I44 strength 3 and I50 strength 3, respectively (Table VII).
FIG. 8.
Inter-reconstruction-method reproducibility for all nodules and all readers (N = 99) showed good agreement at clinical dose.
TABLE VI.
Summary statistics for Fig. 8. SDs were identical for the two iterative reconstruction methods.
| Reconstruction method | N | Mean (%) | SD (%) |
|---|---|---|---|
| I44 strength 3 | 99 | 2.0 | 7.3 |
| I50 strength 3 | 99 | −0.3 | 7.3 |
FIG. 9.
Repeatability under the reference protocol (top row) and inter-reconstruction-method reproducibility (rows 2 and 3) for the subset of 17 cases in the repeatability experiment. Inter-reconstruction-method reproducibility showed good agreement with the baseline repeatability at clinical dose.
TABLE VII.
Summary statistics for Fig. 9. P-values were calculated by testing the B45 (repeatability) distribution against each iterative reconstruction method.
| Reconstruction method | N | Mean (%) | SD (%) | Paired t-test p − value | F-test p-value |
|---|---|---|---|---|---|
| B45 (repeatability) | 51 | 0.8 | 5.1 | ||
| I44 strength 3 vs B45 | 51 | 1.4 | 6.3 | 0.52 | 0.14 |
| I50 strength 3 vs B45 | 51 | −0.7 | 7.2 | 0.22 | 0.02a |
The p-value was statistically-significant.
Summary statistics for the distributions and hypothesis test results are shown in Table VII. Changes in the mean proportional difference were insignificant between repeatability and inter-reconstruction-method reproducibility distributions (p = 0.52 and p = 0.22). The variance with the I44S3 reconstruction method was consistent with the repeatability data from B45, while the I50S3 distribution’s variance differed significantly (p = 0.02).
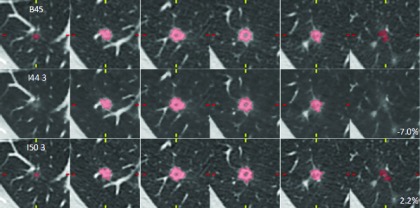
Figure 10 shows reader 3’s clinical-dose contours across the three reconstruction methods for a 9 mm diameter nodule. The nodule was small and fairly complex, but the reader’s proportional differences were just −7.0% (I44 strength 3) and 2.2% (I50 strength 3), indicating good agreement under the three reconstruction conditions.
FIG. 10.
Axial slices through a 9 mm nodule (2 mm increment) at clinical dose. Reader 3’s contours agreed well across reconstruction methods, despite the nodule complexity. Proportional differences were −7.0% and −2.2% for I44 strength 3 and I50 strength 3 methods, respectively.
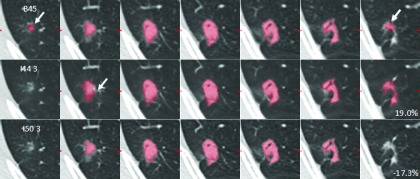
In another case, reader 2’s contours did not agree as closely as in the previous example (Fig. 11). The nodule was 16 mm (longest in-plane diameter) and complex, and the reader’s delineation of the boundaries differed substantially on some slices (see white arrows). The magnitudes of the proportional differences were relatively large in this case: 19.0% (I44 strength 3) and −17.3% (I50 strength 3).
FIG. 11.
Reader 2’s contours showed some disagreement for this 16 mm, noncircular nodule. Proportional differences were 19.0% for I44 strength 3 and −17.3% for I50 strength 3.
4. DISCUSSION
In this study, we developed a unique approach to isolating the effects of dose on lung-nodule volumetry. By simulating reduced-dose scans down to the minimum dose levels supported by our scanner model, we expected to see some change in reader performance, in terms of bias and precision, for this task. However, we did not find any compelling evidence that dose affects intrareader reproducibility. Despite statistically significant biases at 25% dose and 10% dose for the subset of cases in Table V, the bias values were relatively small (−4.5% and −5.6%). Also, bias did not change monotonically with the dose level. For the full set of cases in Table IV, the bias values were even smaller, with 0.0% bias at 3% dose. For the subset of cases in Table V, although the variances differed significantly at 10% dose, they were consistent at 25% and 3% doses, indicating that dose-independent effects played a bigger role than the dose level in determining the variability. For the full set of cases, interdose SDs only ranged from 7.0% to 9.4%. The change in SDs was not monotonic with dose, similar to the bias findings (Table IV). For some context related to the SD values, Zhao et al. showed that for same-day repeat scans, interscan 95% limits of agreement were −12.1% to 13.4% (Ref. 23, Table VII), which translates to an approximate SD of 6.5% [SD = (upper limit – mean)/1.96]. Their approximate SD value is between our clinical-dose repeatability and 25%-dose reproducibility results in Table V (5.5% and 7.0%). Petrick et al. found SDs ranging from 3.6% to 9.7%, depending on the size and complexity of the synthetic nodule (Ref. 2 Table V). Our interdose SDs for the full set of nodules were at the higher end of this range, which seems reasonable considering that none of the nodules in our study were perfectly spherical or elliptical. Hein et al. found inter-reader, intradose 95% limits of agreement −12.6% to 12.4% for their substantially reduced-dose protocol, which translates to a SD of 6.7%. Our reproducibility experiment at 3% dose gave a slightly higher SD of 8.9%. The difference may be explained by the fact that they used a single-click segmentation (without manual edits), and nodules that failed the segmentation (which presumably were more complex lesions) were excluded from their results. In our study, all nodules passing the inclusion criteria were reported in the results.
At the clinical reference dose, we found no compelling evidence that reconstruction method affects intrareader reproducibility. Inter-reconstruction-method biases for the subset of nodules in Table VII were consistent with the baseline repeatability. Although the variance difference with iterative method I50S3 was statistically significant, this relation may not hold for larger numbers of nodules. The inter-reconstruction-method SDs for the full set of nodules were identical, suggesting that volumetry was not affected by changing the iterative reconstruction method, even though the smoothness of the images was clearly different for I44S3 and I50S3 (e.g., Fig. 10). The degree of noise or smoothness in the images seemed to have little impact on the readers’ ability to perceive nodule boundaries. However, there may be cases in which the reconstruction method plays a bigger role, particularly at the levels of photon starvation. At those levels, advanced methods may be able to reduce streaking artifacts (e.g., in Fig. 1) or change their appearance, leading to reduced variability in the volume measurement. Our experiments did not address this scenario directly, since we only compared reconstruction methods at the clinical-dose level. However, we did not see any streaking artifacts with B45 at the 10% dose level, and we saw only minimal artifacts at the 3% dose level, so it is reasonable to expect that nodule volumetry would be consistent across reconstruction methods down to the 3%–10% dose level (or approximately 0.6–2.4 mGy CTDIvol). This is in agreement with the conclusions of other studies such as Hein et al.,12 Chen et al.,5 and Willemink et al.6 and a quantitative analysis of the effects of reconstruction method at reduced dose may be the subject of future work.
Reader variability seemed to be affected more by nodule size and complexity than by any other factors in our study. Our results were consistent with those seen in other studies in this regard (Ref. 24, Fig. 1). The smaller the nodule, the more each voxel contributes to the overall proportional difference. The more complex the nodule, the more likely a reader will interpret the boundaries differently between measurements (see, e.g., Figs. 7 and 11). Dose reduction could still affect performance in terms of reader effort. The additional noise could change the semiautomated segmentation result slightly, which leads the reader to invest more or less time and energy in manual editing. Although bias and precision may be unaffected, it is undesirable if the dose reduction leads to additional manual editing. An area of future work is to investigate how much manual editing is required at each dose level to reach the final contour, but this was beyond the scope of our study. One limitation of the study was that the readings were not performed by board-certified radiologists. The lab technologists that participated in this study did go through some study-specific training and were instructed on the use of contour-editing tools.
A key limitation of this study was the fact that we did not use a fully crossed, multireader multicase experimental design. Instead, we employed a divide-and-conquer approach, introducing the reconstruction method as a random variable. This design was chosen to reduce bias and also the overall reading time. While this study design may correspond more closely to the reality of the clinical workflow, it gave us a limited pool of intrareader volume data for the interdose and intermethod comparisons. Of the original raw data inventory, only 33 passed the “measurable” criterion, and a subset of 17 was randomly selected to create the baseline repeatability experiment. This limits the statistical power of our quantitative conclusions, but we included example cases in Sec. 3 which strongly supported the quantitative conclusions.
Another potential limitation of the reader study design was the exclusion of micronodules and pleural or vessel-attached nodules. Due to the large spectrum of nodule types and attachments in clinical images, this variability might mask any potential effects due to dose or reconstruction method. Das et al. showed that nodule attachment types can play a substantial role in the accuracy and precision of volumetry.25 In addition, the QIBA volumetric CT profile17 limits its quantitative claims to lesions that are at least 1 cm in diameter and where “tumor margins are sufficiently conspicuous and geometrically simple enough to be recognized on all images.” Therefore, this effort reduced the contribution of the nodule characteristic effects in order to focus instead on dose and reconstruction effects.
ACKNOWLEDGMENTS
The authors would like to acknowledge the efforts of Semin Chong for her help with lesion contouring. The authors also acknowledge Di Zhang for his assistance in refining the simulated dose-reduction modeling aspects. The authors thank Pechin Lo and Danny Chong for their computing/database expertise. Finally, the authors acknowledge the assistance of Siemens Healthcare in providing access to their raw data formats. This work was partially funded by grants from the California Tobacco Related Disease Research Program (No. 22RT-0131) and the NCI’s Quantitative Imaging Network (No. U01 CA181156).
REFERENCES
- 1.UyBico S. J., Wu C. C., Suh R. D., Le N. H., Brown K., and Krishnam M. S., “Lung cancer staging essentials: The new TNM staging system and potential imaging pitfalls,” Radiographics 30(5), 1163–1181 (2010). 10.1148/rg.305095166 [DOI] [PubMed] [Google Scholar]
- 2.Petrick N., Kim H. J. G., Clunie D., Borradaile K., Ford R., Zeng R., Gavrielides M. A., McNitt-Gray M. F., Lu Z. Q. J., Fenimore C., Zhao B., and Buckler A. J., “Comparison of 1D, 2D, and 3D nodule sizing methods by radiologists for spherical and complex nodules on thoracic CT phantom images,” Acad. Radiol. 21(1), 30–40 (2014). 10.1016/j.acra.2013.09.020 [DOI] [PubMed] [Google Scholar]
- 3.Zhao B., Tan Y., Bell D. J., Marley S. E., Guo P., Mann H., Scott M. L., Schwartz L. H., and Ghiorghiu D. C., “Exploring intra- and inter-reader variability in uni-dimensional, bi-dimensional, and volumetric measurements of solid tumors on CT scans reconstructed at different slice intervals,” Eur. J. Radiol. 82(6), 959–968 (2013). 10.1016/j.ejrad.2013.02.018 [DOI] [PMC free article] [PubMed] [Google Scholar]
- 4.Gavrielides M. A., Kinnard L. M., Myers K. J., and Petrick N., “Noncalcified lung nodules: Volumetric assessment with thoracic CT,” Radiology 251(1), 26–37 (2009). 10.1148/radiol.2511071897 [DOI] [PMC free article] [PubMed] [Google Scholar]
- 5.Chen B., Barnhart H., Richard S., Robins M., Colsher J., and Samei E., “Volumetric quantification of lung nodules in CT with iterative reconstruction (ASiR and MBIR),” Med. Phys. 40(11), 111902 (10pp.) (2013). 10.1118/1.4823463 [DOI] [PubMed] [Google Scholar]
- 6.Willemink M. J., Leiner T., Budde R. P. J., de Kort F. P. L., Vliegenthart R., van Ooijen P. M. A., Oudkerk M., and de Jong P. A., “Systematic error in lung nodule volumetry: Effect of iterative reconstruction versus filtered back projection at different CT parameters,” Am. J. Roentgenol. 199(6), 1242–1246 (2012). 10.2214/ajr.12.8727 [DOI] [PubMed] [Google Scholar]
- 7.Linning E. and Daqing M., “Volumetric measurement pulmonary ground-glass opacity nodules with multi-detector CT: Effect of various tube current on measurement accuracy—A chest CT phantom study,” Acad. Radiol. 16(8), 934–939 (2009). 10.1016/j.acra.2009.02.020 [DOI] [PubMed] [Google Scholar]
- 8.Gavrielides M. A., Zeng R., Myers K. J., Sahiner B., and Petrick N., “Benefit of overlapping reconstruction for improving the quantitative assessment of CT lung nodule volume,” Acad. Radiol. 20(2), 173–180 (2013). 10.1016/j.acra.2012.08.014 [DOI] [PubMed] [Google Scholar]
- 9.Doo K. W., Kang E.-Y., Yong H. S., Woo O. H., Lee K. Y., and Oh Y.-W., “Accuracy of lung nodule volumetry in low-dose CT with iterative reconstruction: An anthropomorphic thoracic phantom study,” Br. J. Radiol. 87, 20130644 (10pp.) (2014). 10.1259/bjr.20130644 [DOI] [PMC free article] [PubMed] [Google Scholar]
- 10.Wielputz M. O., Lederlin M., Wroblewski J., Dinkel J., Eichinger M., Biederer J., Kauczor H.-U., and Puderbach M., “CT volumetry of artificial pulmonary nodules using an ex vivo lung phantom: Influence of exposure parameters and iterative reconstruction on reproducibility,” Eur. J. Radiol. 82(9), 1577–1583 (2013). 10.1016/j.ejrad.2013.04.035 [DOI] [PubMed] [Google Scholar]
- 11.Rampinelli C., De Fiori E., Raimondi S., Veronesi G., and Bellomi M., “In vivo repeatability of automated volume calculations of small pulmonary nodules with CT,” Am. J. Roentgenol. 192(6), 1657–1661 (2009). 10.2214/ajr.08.1825 [DOI] [PubMed] [Google Scholar]
- 12.Hein P. A., Romano V. C., Rogalla P., Klessen C., Lembcke A., Bornemann L., Dicken V., Hamm B., and Bauknecht H.-C., “Variability of semiautomated lung nodule volumetry on ultralow-dose CT: Comparison with nodule volumetry on standard-dose CT,” J. Digital Imaging 23(1), 8–17 (2010). 10.1007/s10278-008-9157-5 [DOI] [PMC free article] [PubMed] [Google Scholar]
- 13.Mayo J. R., Whittall K. P., Leung A. N., Hartman T. E., Park C. S., Primack S. L., Chambers G. K., Limkeman M. K., Toth T. L., and Fox S. H., “Simulated dose reduction in conventional chest CT: Validation study,” Radiology 202, 453–457 (1997). 10.1148/radiology.202.2.9015073 [DOI] [PubMed] [Google Scholar]
- 14.Massoumzadeh P., Don S., Hildebolt C. F., Bae K. T., and Whiting B. R., “Validation of CT dose-reduction simulation,” Med. Phys. 36(1), 174–189 (2009). 10.1118/1.3031114 [DOI] [PMC free article] [PubMed] [Google Scholar]
- 15.Zabic S., Wang Q., Morton T., and Brown K. M., “A low dose simulation tool for CT systems with energy integrating detectors,” Med. Phys. 40(3), 031102 (14pp.) (2013). 10.1118/1.4789628 [DOI] [PubMed] [Google Scholar]
- 16.Frush D. P., Slack C. C., Hollingsworth C. L., Bisset G. S., Donnelly L. F., Hsieh J., Lavin-Wensell T., and Mayo J. R., “Computer-simulated radiation dose reduction for abdominal multidetector CT of pediatric patients,” Am. J. Roentgenol. 179, 1107–1113 (2002). 10.2214/ajr.179.5.1791107 [DOI] [PubMed] [Google Scholar]
- 17.Quantitative Imaging Biomarkers Alliance (QIBA), QIBA Profile: Tumor Change Profile v2.3b, March 17 2014, available at http://qibawiki.rsna.org/images/a/a2/QIBA_CT_Vol_TumorVolumeChangeProfile_%28with_additional_compliance_work%29_v2_3b_17_March_2014.doc, accessed 28 May 2014.
- 18.Young S. and McNitt-Gray M. F., “Estimating lesion volume in low-dose chest CT: How low can we go?,” Proc. SPIE 9033, 903306 (13pp.) (2014). 10.1117/12.2043730 [DOI] [Google Scholar]
- 19.Brown M. S., Pais R., Qing P., Shah S., McNitt-Gray M. F., Goldin J. G., Petkovska I., Tran L., and Aberle D. R., “An architecture for computer-aided detection and radiologic measurement of lung nodules in clinical trials,” Cancer Inf. 4, 25–31 (2007). [PMC free article] [PubMed] [Google Scholar]
- 20.Bland J. M. and Altman D. G., “Measuring agreement in method comparison studies,” Stat. Methods Med. Res. 8, 135–160 (1999). 10.1191/096228099673819272 [DOI] [PubMed] [Google Scholar]
- 21.Kessler L. G., Barnhart H. X., and Buckler A. J., “The emerging science of quantitative imaging biomarkers terminology and definitions for scientific studies and regulatory submissions,” Stat. Methods Med. Res. 24, 9–26 (2014). 10.1177/0962280214537333 [DOI] [PubMed] [Google Scholar]
- 22.Obuchowski N. A., Barnhart H. X., and Buckler A. J., “Statistical issues in the comparison of quantitative imaging biomarker algorithms using pulmonary nodule volume as an example,” Stat. Methods Med. Res. 24, 107–140 (2014). 10.1177/0962280214537392 [DOI] [PMC free article] [PubMed] [Google Scholar]
- 23.Zhao B., James L. P., Moskowitz C. S., Guo P., Ginsberg M. S., Lefkowitz R. A., Qin Y., Riely G. J., Kris M. G., and Schwartz L. H., “Evaluating variability in tumor measurements from same-day repeat CT scans of patients with non–small cell lung cancer,” Radiology 252(1), 263–272 (2009). 10.1148/radiol.2522081593 [DOI] [PMC free article] [PubMed] [Google Scholar]
- 24.Meyer C. R., Johnson T. D., McLennan G., Aberle D. R., Kazerooni E. A., MacMahon H., Mullan B. F., Yankelevitz D. F., van Beek E. J. R., Armato III S. G., McNitt-Gray M. F., Reeves A. P., Gur D., Henschke C. I., Hoffman E. A., Bland P. H., Laderach G., Pais R., Qing D., Piker C., Guo J., Starkey A., Max D., Croft B. Y., and Clarke L. P., “Evaluation of lung MDCT nodule annotation across radiologists and methods,” Acad. Radiol. 13(10), 1254–1265 (2006). 10.1016/j.acra.2006.07.012 [DOI] [PMC free article] [PubMed] [Google Scholar]
- 25.Das M., Ley-Zaporozhan J., Gietema H. A., Czech A., Muhlenbruch G., Mahnken A. H., Katoh M., Bakai A., Salganicoff M., Diederich S., Prokop M., Kauczor H.-U., Gunther R. W., and Wildberger J. E., “Accuracy of automated volumetry of pulmonary nodules across different multislice CT scanners,” Eur. Radiol. 17(8), 1979–1984 (2007). 10.1007/s00330-006-0562-1 [DOI] [PubMed] [Google Scholar]


