Abstract
A comprehensive developmental timeline of activity in the mouse cortex in vivo is lacking. Understanding the activity changes that accompany synapse and circuit formation is important to understand the mechanisms by which activity molds circuits and would help to identify critical checkpoints for normal development. To identify key principles of cortical activity maturation, we systematically tracked spontaneous and sensory-evoked activity with extracellular recordings of primary visual cortex (V1) in nonanesthetized mice. During the first postnatal week (postnatal days P4–P7), V1 was not visually responsive and exhibited long (>10 s) periods of network silence. Activation consisted exclusively of “slow-activity transients,” 2–10 s periods of 6–10 Hz “spindle-burst' oscillations; the response to spontaneous retinal waves. By tracking daily changes in this activity, two key components of spontaneous activity maturation were revealed: (1) spindle-burst frequency acceleration (eventually becoming the 20–50 Hz broadband activity caused by the asynchronous state) and (2) “filling-in” of silent periods with low-frequency (2–4 Hz) activity (beginning on P10 and complete by P13). These two changes are sufficient to create the adult-like pattern of continuous activity, alternation between fast-asynchronous and slow-synchronous activity, by eye opening. Visual responses emerged on P8 as evoked spindle-bursts and neuronal firing with a signal-to-noise ratio higher than adult. Both were eliminated by eye opening, leaving only the mature, short-latency response. These results identify the developmental origins of mature cortical activity and implicate the period before eye opening as a critical checkpoint. By providing a systematic description of electrical activity development, we establish the murine visual cortex as a model for the electroencephalographic development of fetal humans.
SIGNIFICANCE STATEMENT Cortical activity is an important indicator of long-term health and survival in preterm infants and molds circuit formation, but gaps remain in our understanding of the origin and normal progression of this activity in the developing cortex. We aimed to rectify this by monitoring daily changes in cortical activity in the nonanesthetized mouse, an important preclinical model of disease and development. At ages approximately equivalent to normal human term birth, mouse cortex exhibits primarily network silence, with spontaneous “spindle bursts” as the only form of activity. In contrast, mature cortex is noisy, alternating between asynchronous/discontinuous and synchronous/continuous states. This work identifies the key processes that produce this maturation and provides a normative reference for murine-based studies of cortical circuit development.
Keywords: EEG, mouse, spindle-burst, spontaneous activity
Introduction
The development of cortical activity is a dynamic process, consisting not only of the emergence of mature activities, but also the transient appearance of immature activity patterns (Khazipov et al., 2013a). These changes reflect local and distant circuit maturation, as well as the formation and disintegration of circuits unique to development (Blankenship and Feller, 2010; Kanold and Luhmann, 2010; Cossart, 2011). Transitions between each stage of circuit development constitute “checkpoints” for maturation (Dehorter et al., 2012). Identifying these checkpoints and the specific role that each plays in the development of function is important to understand the etiology of neurodevelopmental disorders such as autism, schizophrenia, and epilepsies of childhood (Ben-Ari and Spitzer 2010), as well as the neuropathology of preterm birth, for which electrical activity is diagnostic (Dean et al., 2014).
Fifty years of clinical electroencephalography in infants born preterm (André et al., 2010) and recordings from multiple animal models (Pampiglione, 1977) have revealed a number of key developmental checkpoints for early cortical activity development. Most prominently, these include the transition from a “discontinuous” pattern, in which activity is interrupted by long silences, to continuous background activity; the acquisition of state-dependent activity; and the elimination of immature oscillations and their replacement by adult frequency bands. The most prevalent early activity pattern in rats is the “spindle burst,” a short (500 ms to 2 s) burst of “rapid” rhythmic firing (6–25 Hz depending on age and region) observed in every cortical area examined. Spindle bursts are the rodent homolog of the “delta brush” pattern observed in the human EEG 25–38 weeks after gestation (André et al., 2010; Yang et al., 2016). In both rats and human preterm infants, spindle burst/delta brushes are triggered by sensory input in somatosensory (Khazipov et al., 2004; Milh et al., 2007), motor (An et al., 2014), and auditory (Chipaux et al., 2013) cortex and by hippocampal input to prefrontal cortex (Brockmann et al., 2011). Rodent studies show that the rapid oscillations are generated in thalamus in response to the input (Yang et al., 2013; Murata and Colonnese, 2016). Delta brushes can occur in clusters, causing a long-duration (2–10 s) negative potential nesting the rapid oscillations called a “slow-activity transient” (Vanhatalo et al., 2002). In the primary visual cortex (V1), this clustering is caused by the multiburst structure of retinal waves (Colonnese and Khazipov, 2010).
V1 is an important model for identifying the major developmental transitions in cortical activity, determining their ontogenic function, and elucidating the circuits responsible (Ackman and Crair, 2014). In the murine visual system, the activity of the primary input, the retina, is well characterized and its role in circuit formation has been studied extensively (Kirkby et al., 2013). Calcium imaging reveals that, before the onset of vision, spontaneous retinal waves coordinate activity in V1 (Ackman et al., 2012), where they refine visuotopic maps and impart initial receptive-field characteristics within parameters set by gradients of chemotropic factors (Huberman et al., 2008).
Despite these foundational studies of early cortical activity, a systematic, quantitative description of the developmental trajectory of cortical activity is still lacking for any animal model. Such a description in the mouse will enable integration with imaging studies and with expression atlases, techniques for genetic manipulation, and models of neurodevelopmental disorders to develop a complete picture of normal and disordered cortical development. Comprehensive study of later V1development (Hoy and Niell 2015) has revealed that, within a day after eye opening, spontaneous and visually evoked dynamics in awake mice show many hallmarks of mature cortical activity, including continuity, modulation by arousal, and low-frequency rhythms during behavioral quiescence. Cortical slow waves under anesthesia emerge around eye opening (Rochefort et al., 2009). Because anesthesia eliminates retinal wave activity and arousal-related activity (Colonnese and Khazipov, 2010), the natural progression of murine cortical activity remains unclear. We have therefore examined day-to-day changes in cortical activity in nonanesthetized neonatal mice to determine the developmental origins of the mature patterns, map their relationship to retinal wave driven spindle burst oscillations, and extend homologies with human infants, already established in rats, to the genetically tractable mouse.
Materials and Methods
Animal care.
Animal care and procedures were in accordance with the National Institutes of Health's Guide for the Care and Use of Laboratory Animals and was approved by the Institutional Animal Care and Use Committee at George Washington University. Postnatal day zero (P0) is the day of birth. C57BL/6 mice were obtained from Hilltop Lab Animals as timed pregnant females and kept in a designated temperature- and humidity-controlled room on 12 h/12 h light/dark cycle.
In vivo electrophysiology.
Carprofen (20 mg/kg) saline was injected 1 h before surgery to reduce pain and inflammation. Surgical anesthesia was induced with 3% isoflurane vaporized in 100% O2, verified by tail pinch, and then reduced to 1.5–3% as needed by monitoring breathing rate. A vented warming table (36°C; VetEquip) provided thermoreplacement. For attachment of the head fixation apparatus, the scalp was excised to expose the skull (see Fig. 1A), neck muscles were detached from the occipital bone, and the membranes were removed from the surface of the skull. Topical analgesic was applied to the incision of animals older than P8 (2.5% lidocaine/prilocaine mixture; Hi-Tech Pharmacy). Application to younger animals was lethal and discontinued. The head fixation apparatus was attached to the skull with grip cement (Dentsply) over Vetbond tissue adhesive (3M). The fixation bar consisted of a custom-manufactured rectangular aluminum plate with a central hole for access to the skull. After placement, the animal was maintained with 0.5–1% isoflurane until the dental cement cured, after which point it was allowed to recover from anesthesia on the warmed table.
Figure 1.
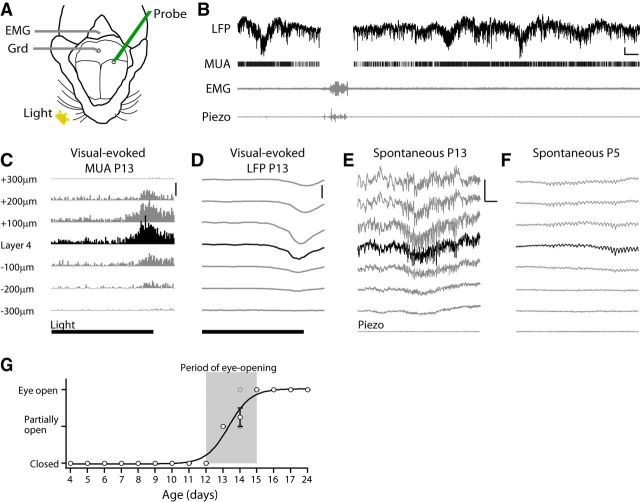
Experimental design. A, Experimental setup. Recording from V1 using single-shank multielectrode array (Probe) in head-fixed nonanesthetized mice with the ground (Grd) in cerebellum. EMG wire was inserted into the rear neck muscle. Piezoelectric and temperature sensors are positioned under the belly of the animal (data not shown). Visual stimuli (Light) were 100 ms whole-field flashes to the contralateral eye. B, Representative L4 activity in a P13 mouse. Movement was monitored by EMG and Piezo device and these periods were eliminated from analysis to avoid electrical artifacts and equalize state between animals. Scale bar, 200 μV (LFP), 2 s. C, D, Mean visual-evoked responses were used for layer identification (P8–P24). Mean poststimulus MUA firing rate (C) and LFP (D) show an early response in L4, which was used as a reference to identify other layers. Time of light (100 ms) is shown below. Scale bars: C, 300 spikes/s; D, 300 μV. E, Representative spontaneous LFP from a mouse in C and D. L4 can be identified as the point of diminution for rapid oscillations. Scale bar, 500 μV, 500 ms. F, Representative spontaneous LFP from P5 mouse. L4 is identified by depth and diminution of rapid oscillations. Scale bar is as in E. G, Quantification of eye opening. Population mean and SEM are shown in black circles. Individual animals are shown in gray circles. Gray square shows the period of eye opening used in this study.
For recording, animals were head fixed under isoflurane anesthesia to a stereotaxic platform via the plate and the torso supported by placement in a padded tube. Body temperature was monitored via thermometer placed under the abdomen and maintained at >33°C via a thermocoupled heating pad (FHC). Mean temperatures were 33.2 ± 0.13°C (SD) during visual evoked recordings and 33.3 ± 0.11°C during spontaneous recordings. Body motion was monitored with a piezoelectric device placed below the supportive chamber. Nuchal electromyogram (EMG) was monitored by with a stainless steel wire inserted into the neck muscle (see Fig. 1A). For electrode access, a craniotomy was performed, thinning the skull if necessary and resecting small bone flaps to produce a small opening (∼150–300 μm diameter). V1 targets were determined by regression of adult brain lambda–bregma distances: 1.5–2.5 mm lateral and 0.0–0.5 mm rostral to lambda. All recordings were made using a single shank, 32 channel array arranged in two parallel lines of contacts (A1x32-Poly2–5 mm-50 s-177; NeuroNexus Technologies). The electrode penetrated the brain orthogonally to the surface and was advanced to a depth of 750–1000 μm using a micromanipulator (Narishige) until the top channels touched the CSF. Isoflurane was withdrawn and the animal was allowed to acclimate inside of the setup for at least 50 min before recording. Recordings lasted 75–120 min after acclimation and consisted of two 30 min spontaneous acquisitions separated by 20 min of visual stimulation. Animals with spreading depression (n = 2) or who detached the head plate (n = 1) were not included in the analysis. All recording was performed in the dark (<0.01 lumens). Whole-field luminance stimulation was provided every 30 s by white LED light (C503C-WAN, Cree, peak luminous intensity 450 nm) under the control of an S88 Stimulator (Grass). Stimulation was 100 ms duration and 220 lumens. Recording localization to monocular V1 was confirmed by ipsilateral visual LFP responses at <10% of the contralateral response. All animals were killed by anesthetic overdose followed by decapitation. Brains were immersion fixed in 4% paraformaldehyde for confirmation of electrode location.
Data acquisition and preprocessing.
Data were acquired at 32 kHz using the Digital Lynx SX acquisition system and Cheetah version 5.6.0 (Neuralynx). Neural signals were referenced to a subcortical contact in L5 with minimal spiking. The following band-pass filters were applied: 0.1 Hz to 9 kHz (local field), 300 Hz to 6 kHz (spike), 200 Hz to 9 kHz (EMG), and 10 Hz to 9 kHz (piezoelectric device). Multiunit activity (MUA) was extracted from the spike channels by threshold crossing below −40 μV and 32 point waveforms were saved for each spike. Analysis used a combination of open-source and custom software written in the MATLAB (The MathWorks) and Igor Pro version 6.37 (Wavemetrics) software. Spike data for evoked responses were imported and analyzed in Igor without down-sampling using Neuralynx Loader (Dr. Rick Gerkin of Arizona State University, Howard Rodstein of Wavemetrics). All other analyses were performed in MATLAB after down-sampling to 1 kHz (0–350 Hz zero phase low-pass filter applied).
The layer identity of each channel was made relative to layer 4 (L4), which was identified in an age-specific manner (see Fig. 1). After the emergence of visual responses on P8, L4 was identified as the channel with the shortest latency 300–500 μm below the surface. For P4–P7, which lack a visual response, L4 was identified from spontaneous spindle bursts as the lowest channel with visible rapid oscillations in the LFP (Colonnese and Khazipov 2010). All LFP channels are rereferenced to 250 μm below input layer and band-pass filtered for further analysis (0.5–100 Hz zero phase Chebyshev type II).
All analyses were restricted to periods without movement, identified by piezo detectors or large-amplitude deflections of the LFP. Troughs were identified for trough-triggered averaging by identifying negative peaks in the L4 LFP that were 4 SDs above the mean of all negative peaks for that animal.
Time–frequency analysis.
For time–frequency analysis, the LFP was first zero phase band-pass filtered at 1.5–50 Hz. Spectral decomposition of the LFP signal was done using the multitaper method in Chronux (http://chronux.org/; Mitra and Bokil, 2007). Two-second windows advanced by 1 s with time–bandwidth product 3 and number of tapers 5, were used for spontaneous activity; 500 ms windows advanced by 200 ms were used for visual responses. Window width and time–bandwidth products were chosen empirically to maximize the spindle burst frequencies in young animals while maintaining sufficient temporal resolution to identify structure in spontaneous or evoked time courses.
Normalized mean power for each animal was calculated by averaging all windows during nonmovement periods and then dividing by mean 1.5–50 Hz power. Matrices of correlation coefficients (see Fig. 4C) between power spectrum densities at different frequencies were calculated for individual animals separately with the following formula:
 |
Where Cfifj is the correlation coefficient between two frequencies fi and fj and N is the total number of the moving windows. Minimum correlation coefficients between frequencies (see Fig. 6B) were calculated as the average of coefficients lower than the first percentile of all coefficients for each animal.
Figure 4.
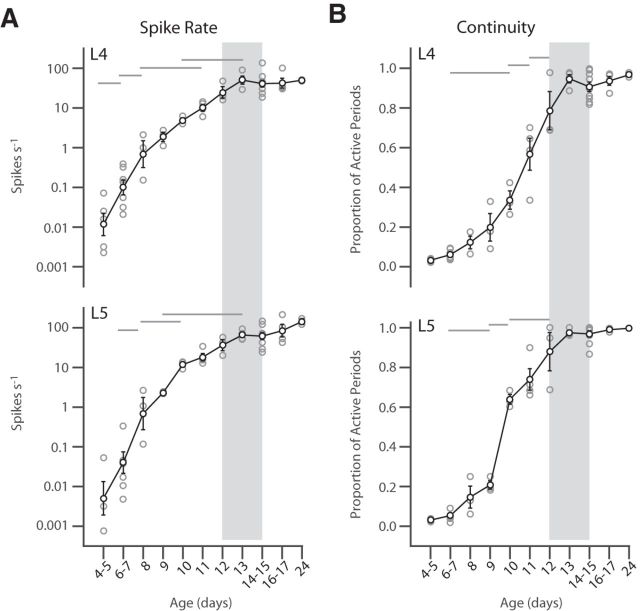
Continuous activity emerges between P9 and P13. A, Log of MUA rate for input (L4, top) and deep (L5, bottom) layers by age. Firing rates displayed exponential growth that asymptotes at P13. ANOVA for effect of age (L4, p < 10−3; L5, p < 10−3). B, Continuity of firing measured as the proportion of time occupied by active periods (not containing network silences >200 ms) for L4 (top) and L5 (bottom). Both layers display rapid acquisition of adult values between P9 and P13, with L5 increasing continuous firing rapidly between P9 and P10. ANOVA for age (L4 and L5, p < 10−3). Gray lines show selected ages with significant difference (p < 0.05) by post hoc test. For clarity, not all groups with differences are marked. Gray rectangle indicates the period of eye opening (Fig. 1). Gray circles show individual animals. Black circles are population mean and SEM.
Figure 6.
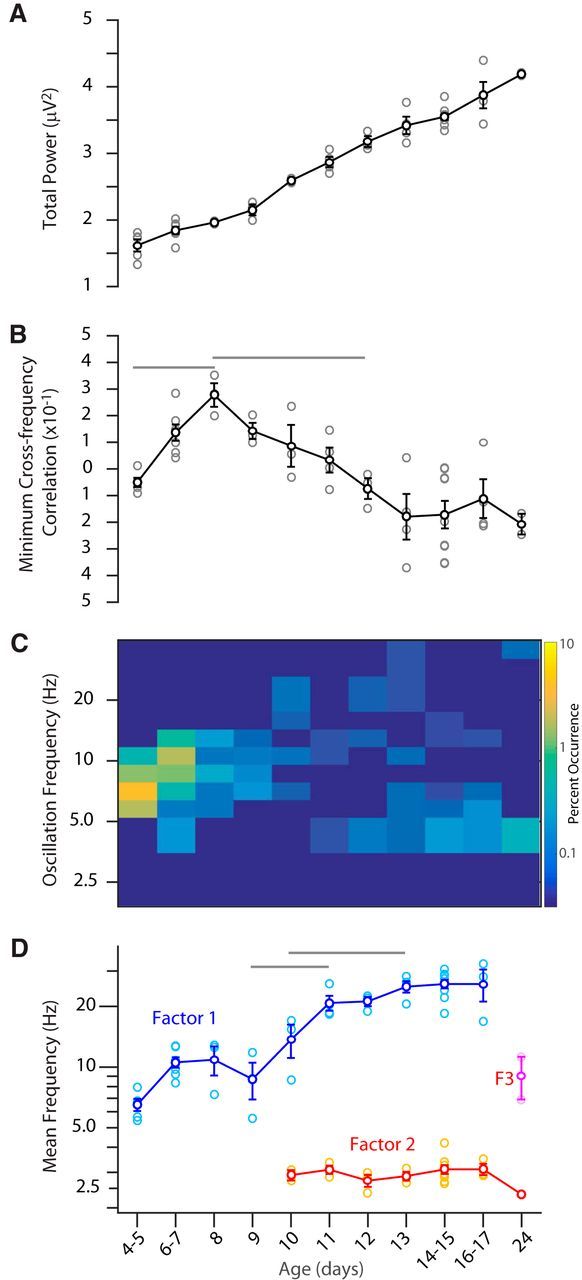
Evolution of spectral relationships. A, Total spontaneous LFP power (1.5–55 Hz) by age shows increasing amplitude of LFP. ANOVA for effect of age, p < 10−3. B, Development of negative cross-frequency correlation. Mean of the lowest 5% of cross-frequency correlations (Fig. 5C) shows the evolution of anticorrelated activity. Rise from P4–P8 is largely due to reduction of very high (30+) frequencies during all activity at young ages. Anticorrelation between low and high frequencies is reflected by drop from P8–P13, when significant anticorrelations emerge and reach mature levels ANOVA p < 10−3. C, Occurrence of 2 s windows with significant oscillations as determined by F-variance ratio test. The percentage of periods with activity containing each oscillation are shown by color scale. Note high occurrence and acceleration of oscillations at P4–P9 and the relative paucity of significant oscillations after. In older animals, low-frequency oscillations are observed from P12 to P24. D, Weighted mean frequency of spectral factors identified by NMD (Fig. 5D). Factor 1 occurred in all animals (except P24) and accelerated with age between P9 and P11, reaching plateau values by P13. ANOVA p < 10−3. Factor 2 was observed only starting at P10 and its frequency remained constant. ANOVA p = 0.23. Factor 3 (F3) was only observed at P24.
To lower the effect of the intrinsic 1/f power-frequency relations (“whitening”) in further time–frequency analysis, adaptive zero phase filters were adapted for each animal with amplitude–frequency response cancelling the 1/f relationship. First, power spectrum density was estimated with multitaper method using 2 s windows advanced by 0.2 s, half-time bandwidth product 3, and number of tapers 5 at frequencies from 0.5 to 100 Hz in 0.5 Hz steps. To estimate the baseline 1/f, the average of densities in the 5–10th percentile was determined for each frequency, which was used to generate an inverse amplitude–frequency response for the whitening filter. Power at 0 Hz and >100 Hz was set to zero and a 500th order finite impulse response filter was designed with this amplitude–frequency response and applied to the LFP time–voltage matrix to generate a 1/f removed time–voltage series to which time–frequency analysis was applied as described above for the raw LFP.
For non-negative matrix factorization (NMF), the sparcity of the matrix was increased by using the whitened spectra, which is preferrable to NMF. Given a rank, the NMF will factorize the original high-dimensional matrix to two matrices of lower rank, the product of which produces the minimal least mean square error to the original matrix as follows:
 |
where factor matrix H contains the power distribution and W the weight contributed to each window. The alternating least-squares methods was used for NMF (Berry et al., 2007). Rank number was determined by calculating the maximum number of factors for which all factors were negatively correlated; that is, NMF isolated groups of frequencies that were positively correlated with each other and negatively correlated with other groups and stopped factoring when it began identifying groups that were positively correlated with each other (likely subsets of a larger pattern). Because NMF requires a random initial condition, each run can isolate different factors. Therefore, NMF was run 100 times for each rank and the t test was used to determine whether the maximum correlation coefficent between features at this rank was positive. Factor central frequency was calculated as the weighted frequency average as follows:
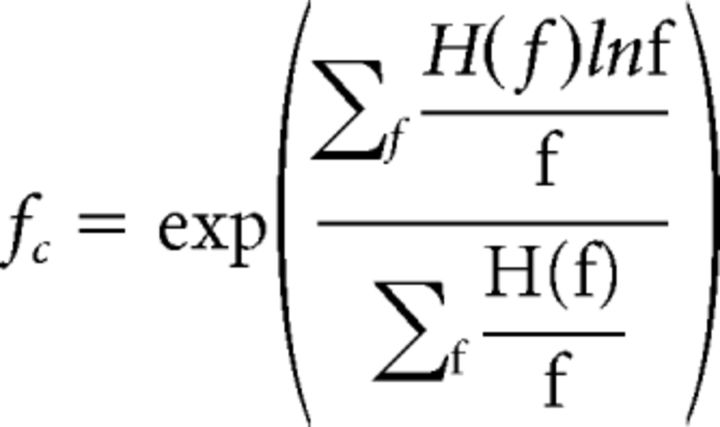 |
Where f is the frequencies within the major band (defined at widest group of contiguous frequencies with greater than half peak magnitude) and H(f) is the magnitude at f. The maximum ratio between the residue and the Frobenius norm of original matrix was 0.02%, indicating that nothing was lost from the original spectra by NMF. Identified factors were sorted into groups based on their log10(fc) using density-based spatial clustering of applications with noise (DBSCAN) (Tran et al., 2013). The minimum number of points for clustering was set to 2 and reachable distance to log10(2)/2, half of the bandwidth threshold for defining a major band in the earlier process. Clustering was run on adjacent age groups to assign groups within and between ages. In total, 67/72 features were sorted into one of three groups (see Fig. 5D).
Figure 5.
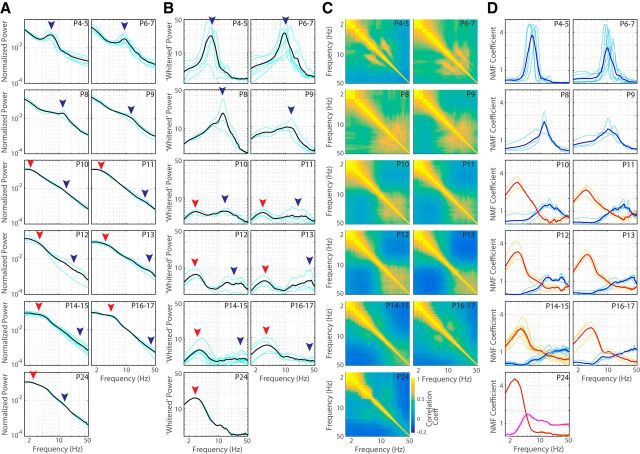
Maturation of two activity patterns explains spontaneous activity development. A, Mean normalized L4 LFP spectra for each age group. Black lines are population mean, blue lines individual animal spectra. P4–P9 spectra are dominated by 5–20 Hz activity (blue arrow; spindle bursts), the primary frequency of which accelerates with age and merges with the dominant 1/f activity by P10. Low-frequency (2–8 Hz) activity becomes apparent at P10 (red arrow) and is prominent on P14–P15, when the spectra become similar to the spectra of juvenile mice during rest (Hoy and Niell, 2015). B, Whitened mean L4 spectra showing frequencies remaining when dominant 1/f power relationship is removed. Shown are increasing frequency and decreasing amplitude of rapid frequencies (blue arrow) and initiation at P10 followed by increasing amplitude of low-frequency activity (red arrow). C, Mean cross-frequency correlation. Shown is the matrix of correlation coefficients for each frequency band. Note the growth of highly correlated 5–15 Hz frequencies at P4–P5, which gradually shift to become correlated high frequencies by P12. Anticorrelation between high and low-frequency bands is observable by P12, showing the development of aroused and quiescent states. D, NMF of spectral signal reveals two developmental components. Thin lines show individual factors identified in each animal. Factors were sorted into clusters by density-based spatial clustering. Two clusters of factors were identified in the total population, which have been rendered in blue and red. Factor 1 (blue) was identified in all animals except P24 and accelerated with age. Spectra could first be separated into two factors on P10. This second factor (red) remains relatively constant with age. A third factor (pink) was isolated on P24 that appeared to contain rapid rhythms of factor 1 and theta-band activity.
Harmonic analysis with the F-variance ratio test (Thomson, 1982) was performed on the whitened signal using 2 s moving windows. Analysis was restricted to active periods by setting a minimal threshold for the SD of the LFP to 10 μV. Test used the Chronux function in MATLAB using a half-bandwidth product of 15. The threshold for a significant oscillation was the Bonferroni corrected (for number of frequency bands) p < 0.025. Because the high-frequency harmonics are redundant for showing the dominating oscillations, the oscillation frequency with highest amplitude was kept for each window.
Statistics.
For all developmental quantification, a one-way ANOVA for the effect of age was performed, followed by Tukey's honest significant difference test post hoc, in which there was significance in overall effect. Actual p-values are given for ANOVA results where p > 0.001. The primary results were the relative developmental curves, not the specific significance between individual days. Therefore, for brevity, only critical significant differences (p < 0.05) indicating rapid developmental changes are indicated on graphs as gray bars.
Results
LFP and MUA was recorded from V1 of nonanesthetized, head-fixed mice using single-shank multisite probes extending through the full depth of cortex (Fig. 1). Recordings were made in daily increments starting at P4, when superficial layer neurons finish migration (Ignacio et al., 1995), through P17, when mature cortical state activities have largely emerged (Hoy and Niell, 2015). All (4/4) animals on P13 had incomplete separation of the eyelids and complete separation occurred by P15 (1/4 P14 pups had full separation; Fig. 1G). A single older time point (P24) during the critical period for ocular dominance plasticity (Gordon and Stryker, 1996) was included for comparison.
Two developmental processes define development of spontaneous activity
Recordings in neonatal rats showed that input layers contain the most important rapid dynamics (Colonnese and Khazipov, 2010). We observed this in mice as well (Fig. 1). Therefore, we restricted our analysis of LFP to an electrode located in L4 while examining MUA in L4 and L5. During the first postnatal week, MUA activity in L2/3 and L6 was inconsistent and not analyzed. Visual examination of LFP and MUA (Fig. 2) showed dramatic changes in the amplitude, continuity, and patterns of activity across the first 3 postnatal weeks. At P4, cortex was largely silent, with periods of no MUA or LFP deflection lasting >10 s. Activation consisted of spindle-shaped oscillations in the LFP with a primary frequency of 5–8 Hz. MUA activity occurred only during these oscillations. This activity exactly resembled LFP oscillations in rats called spindle bursts, which occur during activation driven by spontaneous retinal waves (Hanganu et al., 2006; Colonnese and Khazipov, 2010; Kummer et al., 2016). In mice at this age, retinal wave driven calcium events are the overwhelming majority of activity in V1 (Ackman et al., 2012). Therefore, we consider these oscillations to be homologous to rat spindle bursts and to be the cortical response to retinal waves. Between P4 and P9, the duration of spindle burst oscillations became longer and the primary frequency of the oscillations increased. MUA in deep and superficial layers increased but followed the same pattern of network silence and firing only during spindle burst oscillations observed for L4. Spike-triggered and LFP triggered averages (Fig. 3) show that, at these ages, activity was associated with oscillations in both the LFP and spike rate centered on L4.
Figure 2.
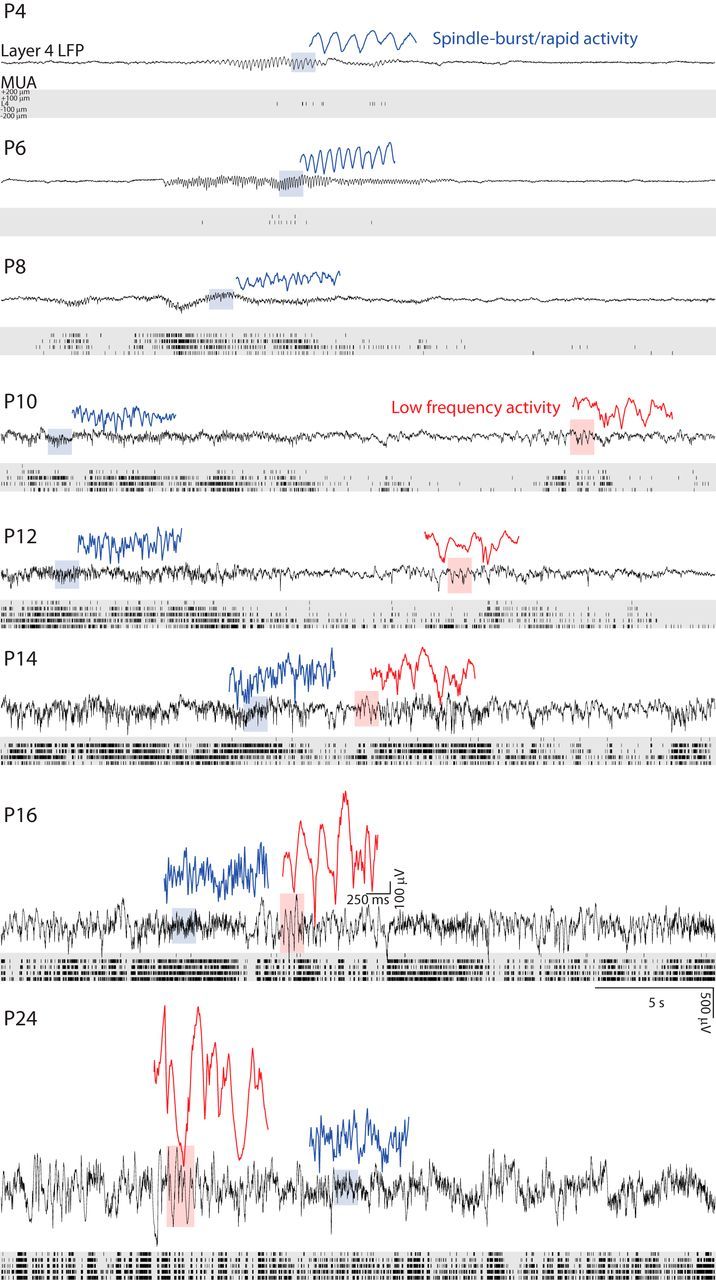
Maturation of spontaneous activity in mouse V1. Representative LFP voltage traces and MUA rasters during quiet wakefulness. LFP is displayed for L4; MUA for L4 and channels 100 and 200 μm above and below L4. At P4, the cortex is mostly quiet and activity consists solely of spindle-shaped (spindle burst) oscillations that result from retinal wave activity (Colonnese and Khazipov, 2010). Spindle bursts become elongated and faster with development, becoming indistinguishable from rapid β-gamma activity by P12 (blue traces show examples). At P10, significant activity between spindle bursts is first observed as high-amplitude, low-frequency modulation (red traces show examples). This low-frequency activity increases in duration, alternating with high-frequency activity, until activity becomes continuous (no silent periods). Therefore, by P14, spontaneous activity is similar to mature (P24). Scale bar, 5 s (1.25 s for expanded traces); 500 μV (250 μV for expanded traces).
Figure 3.
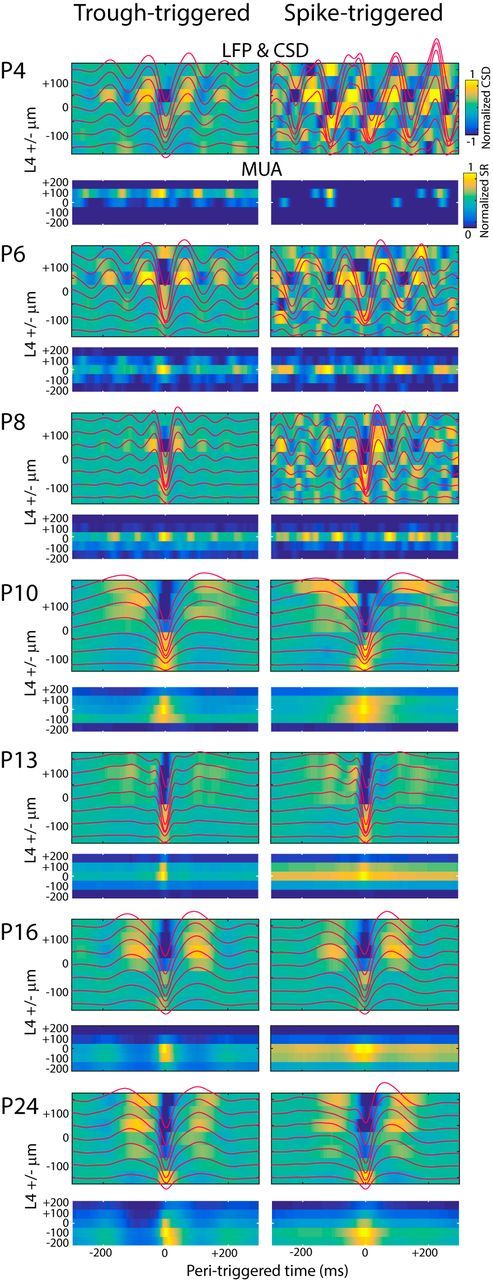
Depth profile of spontaneous activity. Representative trough-triggered (left column) and spike-triggered (right column) mean LFP (red line), current source density (color map) and MUA (lower color map) for an animal at the shown age. Depth is shown relative to L4, the layer of triggering. For spike-triggered MUA, 0 ms spike rate is removed. From P4–P8, both spike-triggered and trough-triggered averages show local oscillation in LFP and MUA with a current sink and maximal spiking in L4. P10 and older shows activity occurring in more isolated events with full columnar involvement.
On P10, a shift in the pattern of spontaneous activity occurred. Spontaneous firing between spindle bursts increased and this firing was accompanied by low-frequency oscillations (4 Hz) in the LFP. Spike and LFP-triggered averages showed a loss of prominent oscillations and the acquisition of columnar firing (Fig. 3). On P12, we observed another sharp transition, with spontaneous firing and low-frequency activity becoming nearly continuous and clear spindle burst oscillation in the LFP no longer identifiable by eye. By P15, all of the mice had fully separated eyelids (Fig. 1) and LFP and spiking activity largely resembled adult patterns, shifting between periods of high-amplitude low-frequency activity and low-amplitude high-frequency activity, as described for 1–2 d after eye opening (Hoy and Niell, 2015). During the week after eye opening, LFP amplitude continued to increase, but firing rates and continuity of activity were stable.
We quantified the development of neuronal firing by summing MUA firing rates from electrodes in L4 and L5 separately. Firing rates between young and older animals differed by orders of magnitude and are thus presented and analyzed as log10 of rate (Fig. 4A). Firing rates in both layers increased approximately exponentially with age (linear development on a log scale) between P4 and P12, achieving asymptotic values on P13. The continuity of activity was quantified as the proportion of time with at least one spike per 200 ms (Fig. 4B). Continuity was near zero in superficial layers at P4 and grew rapidly after P8, reaching adult values on P13. In deep layers, continuity showed the same rapid change, with an additional step increase between P9 and P10 as L5 neurons began the rhythmic, low-frequency firing indicative of large pyramidal neurons (Fig. 2; Niell and Stryker, 2008). Therefore, in superficial and deep layers, spontaneous spike rates and continuity increased dramatically, becoming near adult-like before eye opening.
In addition to the rapid shift to continuous spiking, the specific patterns of rhythmic activity evolved during the first 2 postnatal weeks. Previous studies of neonatal activity in rats have focused on characterizing and classifying isolated bursts of activity (Yang et al., 2009; Brockmann et al., 2011; An et al., 2014; Cichon et al., 2014). Because spontaneous activity in rat VC contains only two clear patterns separable by frequency and duration (Colonnese and Khazipov, 2010; Cichon et al., 2014) and isolation of individual events in older animals is not possible, we quantified the characteristics of total LFP activity in each animal (Figs. 5, 6). We calculated total 1.5–55 Hz power (Fig. 6A), the mean normalized distribution of all frequencies (Fig. 5A), and spectra after removal of 1/f frequency relationship (whitening) that obscures oscillatory activities (He, 2014; Fig. 5B). To understand which frequencies derive from the same patterns (and are therefore correlated), we calculated the correlation coefficients for each frequency band (Fig. 5C). In the mature cortex, low frequencies are not correlated with high-frequency activities because the cortex switches between synchronized (low-frequency) and asynchronous (high-frequency) states in response to arousal (McGinley et al., 2015). To measure the spectral composition of high- and low-frequency components separately, we developed a method to separate the correlated frequencies into factors based on NMF (Fig. 5D).
Quantification of LFP frequency development identified two critical developmental trajectories. The first trajectory is the gradual transformation of spindle burst oscillations into the wide-band β-gamma frequency activity generated during the asynchronous state in response to cortical activation (Renart et al., 2010; McCormick et al., 2015). At P4, the mean normalized spectra and whitened spectra showed a single peak around 6 Hz (Fig. 5A,B). A similar peak in the whitened spectra was present at each age through at least P13, although the primary frequency accelerated, the spectral width increased, and the amplitude decreased each day so that, by P11, there was no clear peak frequency, but rather a width of elevated frequency variance in the β-gamma range. This developmental transformation of spindle burst oscillations to β-gamma activity was confirmed by the NMF analysis, which identified a factor in all ages that could be grouped into a single continuous cluster (single factor). This factor accelerated from 6 to 25 Hz between P4 and P17 (Fig. 6D) while the total width of elevated power increased. These data indicate relative stability of the central frequency of spindle oscillations from P4 to P9, followed by steady growth until P13, when they achieve adult values between 20 and 30 Hz. The low amplitude of the high frequencies after P13 is expected because we examined animals only during behavioral quiescence, when high-frequency activity is reduced (Hoy and Niell, 2015). Interestingly, a similar high-frequency factor could not be isolated at P24, largely because theta-band activity became prominent at this age.
The second major maturational process is the emergence of low-frequency activity between spindles, which began on P10–P11 (Figs. 2, 3). Before P10, no animals had significant low-frequency power in the spectra (Fig. 5A,B) and only a single factor was isolated by NMF (Fig. 5D). By P10, a low-frequency bump was visible and NMF isolated two factors in each animal: the high-frequency component and a novel low-frequency component (Fig. 5D). The central frequency of the low-frequency activity remains constant near 3 Hz from P10 to P24 (Fig. 6D). By P13, low frequencies became anticorrelated with high frequencies (Figs. 5C, 6B), assuming their mature dynamics.
We further quantified the development of oscillations in the LFP using the F variance ratio test (Fig. 6C), which is a very stringent test for the significance of locally elevated frequency bands indicative of powerful oscillations. This analysis echoed that of the NMF and mean spectra. At P4–P5, we identified oscillations from 6 to 10 Hz that increased in frequency but decreased in occurrence with age. By P10, significantly high-frequency oscillations were present but rare. This is in contrast to the wideband elevation of high-frequency power at the same ages. Together, these data suggest that the rapid activity from P10 onward is not strongly oscillatory, but rather a wideband elevation of β-gamma frequencies as expected of the asynchronous state, rather than the gamma oscillations caused by visual stimulation during movement (McGinley et al., 2015), which are not present at this age (Hoy and Niell, 2015). Similar to NMF analysis, significant low-frequency oscillations identified by F-variance emerged on P11. Their mean frequency remained constant with maturation, whereas their occurrence increased.
In combination with our multiunit (Fig. 3) analysis and examination of the LFP traces (Fig. 2), we confirm findings in human preterm infants (Tolonen et al., 2007) that continuous activity develops largely as a result of an increase in the occurrence of interspindle slow-activity transient low-frequency activity and extend these findings by implicating an increase in L5 firing between P10 and P12 as the driver. The rapid development of interspindle burst low-frequency, continuous activity means that continuous activity appears during quiescent (nonaroused) states by the time of eye opening (Colonnese, 2014; Hoy and Niell, 2015).
Our data indicate that the development of continuous spontaneous activity is dissociable into at least two mechanisms: (1) spindle burst oscillations are present first and accelerate to become asynchronous activity characterized by broadband β-gamma frequencies and (2) slow, continuous activity emerges later, filling in the time between activated periods and coming to dominate spontaneous activity at rest, just before eye opening.
Visual responses emerge before eye opening.
Visual responses in mice can be evoked before eye opening from the retina in vitro (Tian and Copenhagen, 2003) and through the closed eyelid in vivo (Rochefort et al., 2011). In nonanesthetized rats and human neonates, these “previsual” light responses are much larger and longer than the mature visual response and they have a unique temporal structure that includes gamma and spindle burst oscillations (Colonnese et al., 2010). To characterize the early development of visual responses in nonanesthetized mice, we examined stimulus-triggered average LFP (Visual Evoked Potential), mean-fold-increase in LFP spectral power, and MUA rates between P4 and P24 (Fig. 7). Visual inspection of the data indicated rapid changes between P8 and P14 (Fig. 7), so population means were created and analyzed at 1 d increments in this range and at 2 d increments otherwise. Visual responses evolved along multiple trajectories, but a general principle was that responses before eye opening were of long duration and elevated amplitude and consisted of oscillations similar to those observed spontaneously. By eye opening, immature oscillations were lost and responses became sharp but of a lower signal-to-noise ratio (SNR).
Figure 7.
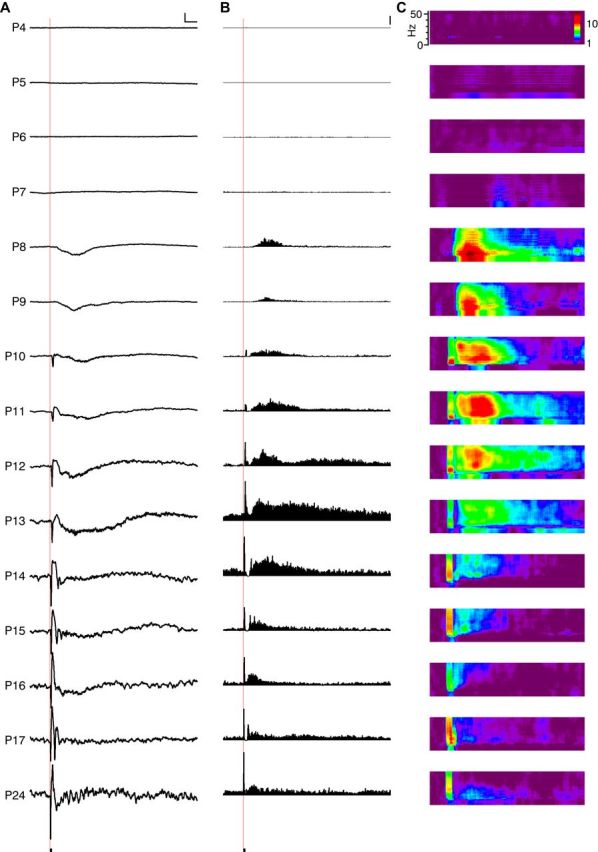
Visual responses before eye opening are large, of long duration, and oscillatory. A, Representative mean flash-evoked L4 LFP at each age. Red line shows time of 100 ms flash onset. No responses were observed before P8. Scale bar, 100 μV, 500 ms. B, Representative poststimulus time histogram for L4 MUA from the same animal. Scale bar, 100 spikes/s. C, Representative poststimulus increase in spectral power for L4 LFP for the same animal. Color map depicts fold increase over baseline.
Animals P7 or younger did not have cortical visual responses, as assayed by visual inspection of mean LFP and MUA responses. At P8, 3 of 4 pups had responses, as did 100% of pups P9 and older (Fig. 8D). The summed 1–50 Hz power in the LFP during the visual response indicated that strongly oscillatory dynamics were a component of visual responses between P8 and eye opening at P14 (Fig. 8E). The total duration of visual responses developed in two stages (Fig. 8F). Starting at P8–P10, the response duration was 2–4 s; this increased to 5–6 s P11–P13 before dropping to <2 s by P16–P17. The latency of the visual response decreased rapidly across this developmental period (Fig. 8H).
Figure 8.
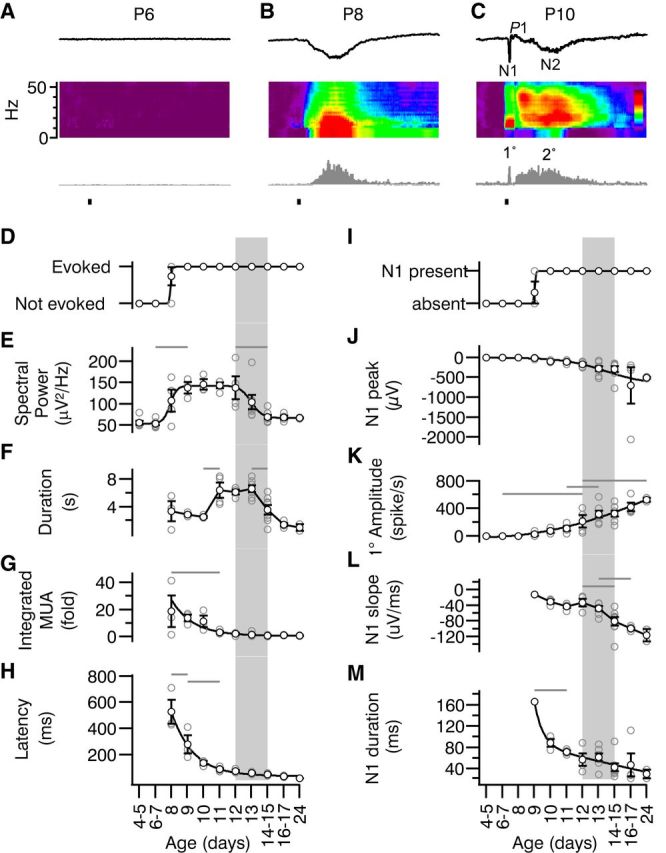
Primary and secondary visual responses develop by different mechanisms. A–C, Representative L4 visual responses at three early ages showing the designations for the parts of the visual response. From top, mean evoked LFP, spectral increase and peristimulus MUA time histogram. The sharp, short-latency negative potential is called N1 and is followed by long-latency, long-duration N2. The MUA responses are called 1° (N1 + 1° = primary) and 2° (N2 + 2° = secondary), respectively. Note that the P8–P9 responses resemble secondary responses in older animals and are thus classified despite occurring first. At later ages, a positive peak is observed (P1), which is analyzed in Figure 9. D–H, Quantification of total (primary + secondary) L4 visual response development by age. For all panels, gray rectangle indicates period of eye opening (Fig. 1). D, Presence or absence of significant visually evoked MUA. E, Summed 1–50 Hz spectral power during the 5 s after stimulation (ANOVA for effect of age p < 10−3). Evoked spectral power in the LFP is first significantly different from neonates on P9 and remains stably high until decreasing to mature levels between P12 and P14–P15. F, Total duration of elevated spiking (spike rate >1 SD of baseline mean; p < 10−3). Visual responses become very long on P11 before decreasing to adult levels by P14. G, Time-amplitude integrated change in MUA firing rate (total area of gray bars in C and D expressed as the fold increase over baseline; p < 10−3). Early responses are very large but shrink rapidly, becoming similar to mature values by P11 despite increasing duration. H, Latency to MUA response (p < 10−3). Early responses are long latency, but reach values similar to mature values by P11. I–M, Quantification of N1/1°. I, Presence or absence of N1 component of visual evoked L4 potential. J, Peak negative amplitude of mean visual evoked potential (0–200 ms; p = 0.0053). N1 grew in size steadily during development and did not reach clear asymptote within time period of study. K, Peak 1° MUA (0–200 ms after stimulus; p ≪ 10−3). L, Negative slope of N1 (p ≪ 10−3). Rapid increases in slope were observed between from P12 and P16–P17. M, Duration of N1 (p < 10−3). After rapid sharpening between P9 and P10, duration decreased steadily.
In addition to these global changes, we observed dissociable changes in the components of the visual response. Visual responses consist of a short-latency primary response that includes a sharp negative potential (N1) containing a burst of firing (1°) and is followed in adults by a positive potential (P1) with suppression of firing. This primary response reflects mostly the direct retinal input though thalamus followed by corticocortical excitatory and inhibitory activity (Reinhold et al., 2015). The primary response is followed a secondary response containing long-duration negative potential (N2) and increased firing (2°). Visual responses at P8 and P9 consisted solely of a long-latency, sustained, negative potential and MUA that resembled the N2 and 2° of P10–P11 animals (Fig. 8B,C). N1 and a 1° spiking response were observed in 1/4 of P9 pups and in all animals P10 and older (Fig. 8I). N1 amplitude and slope and the 1° peak firing rate increased linearly and did not saturate within the age ranges of this study (Fig. 8J–L). The duration of N1 decreased linearly after P10 (Fig. 8M). We did not observe strong early-gamma oscillations during the primary response, as in rats (Colonnese et al., 2010). Rather, mice appear to develop an adult-like N1 and 1° response 4 d before eye opening. This response matures in a graded manner by increasing in absolute size and reducing duration through P24.
Hyperexcitability of visual responses before eye opening
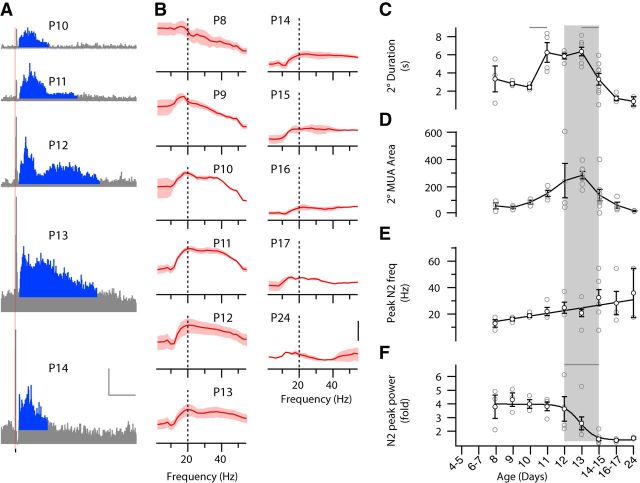
The secondary visual response (N2 and 2°) is dependent on a complex anlage of continuing retinal activity and recurrent activation of corticocortical and thalamocortical loops. In rats and human preterm infants, it is the most dramatically regulated component of the visual response and the most predictive of changes in thalamocortical network properties (Colonnese et al., 2010). Duration of the 2° spiking response showed a complex trajectory, elongating between P10 and P11 and then shortening between P13 and P14 (Fig. 9A,C). The pattern and intensity of evoked oscillations composing the N2 component also changed (Fig. 9B). The frequencies evoked in the L4 LFP matched the frequencies observed for the same ages in the spontaneous activity (Figs. 5, 6). At P8 and P9, visually evoked activity had a peak at <20 Hz with relatively less power at >20 Hz. From P10 until P13, we observed broadband (10–50 Hz) increases in frequency power (Fig. 9D). Animals P14 and older also showed broadband increases in frequency power. However, the amplitude of the response, measured as total 1–50 Hz power, decreased dramatically (Fig. 9F). Therefore, significant visually evoked oscillations were eliminated by eye opening.
Figure 9.
Immature, large-amplitude secondary responses disappear by eye opening. A, Representative peristimulus MUA time histograms (P10–P14) showing secondary responses. Total mean firing rate for L4 is displayed in gray, with firing elevated (>1 SD) over baseline shown in blue. The 2° duration (C) is the number of seconds of blue signal; the 2° MUA area (D) is the total area of blue. Scale bar, 200 spikes/s, 2 s. B, Fold increase in LFP spectral power during secondary response. Population mean (red line) and SEM (shaded) for animals at indicated age. Scale bar, 4×. Elevated spectral power distribution is similar to the rapid oscillation pattern identified during spontaneous activity (Fig. 4). Evoked oscillation power drops between P12 and P14, similar to the loss of spontaneous rapid frequencies at the same ages. C, Duration of 2° spiking response (ANOVA for effect of age, p < 10−3). Secondary spiking responses shorten between P12 and P14. D, Integrated area of 2°spiking (p = 0.014). Evoked spiking peaks at P13 before decaying to adult levels. E, Peak frequency of N2 (p < 10−3). Like spontaneous activity, evoked N2 oscillations began as spindle bursts and steadily increased to broadband β-gamma frequencies. F, Peak fold increase in spectral power of N2 (p < 10−3) is high through the pre-eye-opening period.
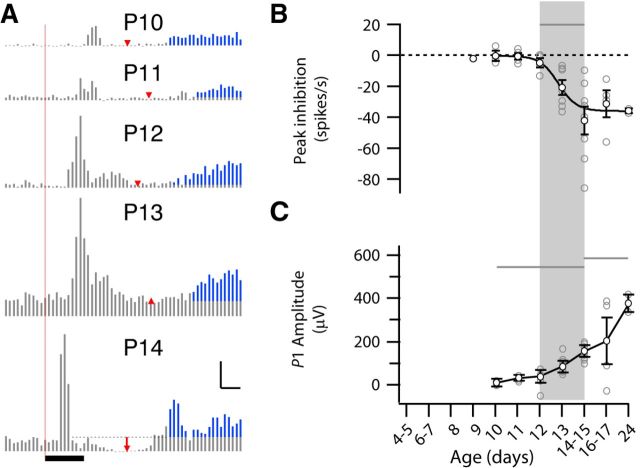
Feedforward inhibition shapes the primary response, generating a positive potential (P1) and inhibiting ongoing activity (Liu et al., 2010; Colonnese, 2014). We quantified poststimulus MUA for evidence of light-evoked inhibition (Fig. 10B). Significant inhibition of baseline activity after the primary visual response was first observed at P14–P15 and its amplitude remained constant through P24 (Fig. 10B). Similarly, P1 amplitudes significantly elevated above younger animals (P4–P10) were first observed on P14–P15 and their amplitude continued to grow through P24 (Fig. 10C).
Figure 10.
Development of feedforward inhibition correlated to the loss of secondary response. A, Representative peristimulus MUA time histogram (P10–P14) showing inhibition of spiking between 1° and 2° response (red arrow). The location is determined by lowest spike rate after the 1° response. Scale bar, 100 spikes/s, 50 ms. Black bar indicates stimulus. B, Amplitude of inhibition as change from baseline in spikes/s (ANOVA for effect of age, p < 10−3). Visually evoked inhibition of spiking develops between P12 and P14, the same time evoked spindle bursts disappear. C, Latency of inhibition (minimum spike rate after 1° response; p < 10−3). Development of light-evoked inhibition shortens latency, which now occurs consistently after the initial response.
Examination of the MUA and LFP depth profiles (Fig. 11) shows that the rapid oscillations of the N2 resemble the spindle burst oscillations occurring spontaneously as they have the primary sink in L4. They further show an increase in the involvement of the whole cortical column during N1 and N2, but the general trends quantified for L4 were also observed in the infragranular and supergranular layers.
Figure 11.
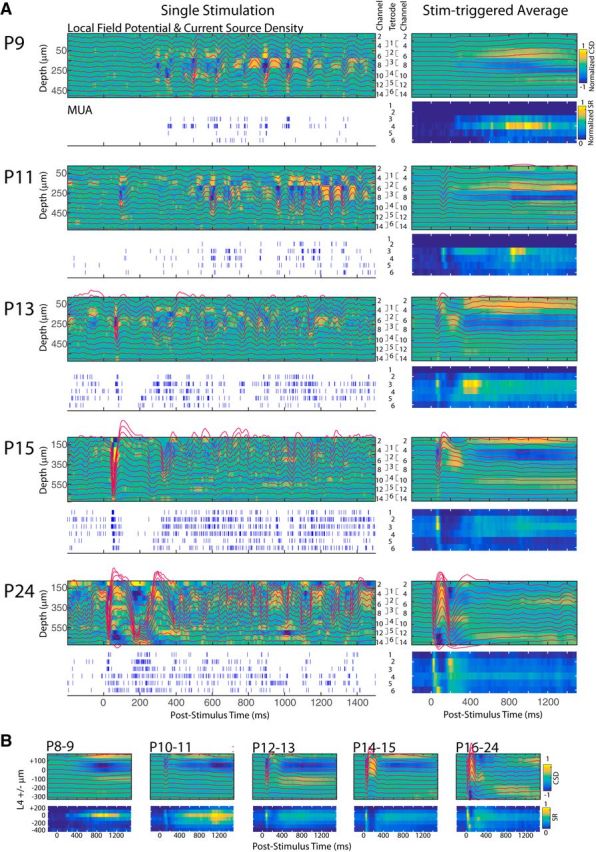
Depth profile of visual evoked responses. A, Left column, Representative single visually evoked response from an animal at key ages. For each animal, the LFP (red line) is overlaid on current source density map (blue is the sink; yellow is the source). Depth of traces is indicated at left; channel number at right. Tetrode configuration for spike recordings is also shown. MUA spike rasters for each tetrode are shown below. A, Right column, Mean visual evoked response for the same animal. MUA spike rates are shown on a color scale. B, Population mean and mean visual response. Depth is aligned to L4 (left).
Background firing rates increased during the period of visual maturation (Fig. 3A), potentially reducing the SNR of visual responses despite the increased visual response amplitude. To determine the interaction between the evoked response and background activity, the SNR for each component of the visual response was calculated. SNR was calculated as firing rates during the primary, secondary, or inhibitory responses as a ratio to the expected firing during the same period as calculated from baseline (Fig. 12A,B). Despite the increase in spiking between P10 and P13, SNR for primary and secondary responses was highest at P10 and decayed with exponential time course (Fig. 12C). The primary response SNR asymptotes occurred close to P7, with most of the decrease occurring by P11. The secondary response decreased more dramatically, approaching 1 (2× baseline) by P13. Therefore, whereas evoked oscillations remain powerful through P14, early spiking responses become obscured relative to increasing spontaneous activity at earlier ages. The SNR of visual-evoked inhibition remained near 1 (no inhibition) from P10–P12 before rapidly developing adult values below zero on P14 (Fig. 12B), similar to the absolute spike rate changes for inhibition (Fig. 10B).
Figure 12.
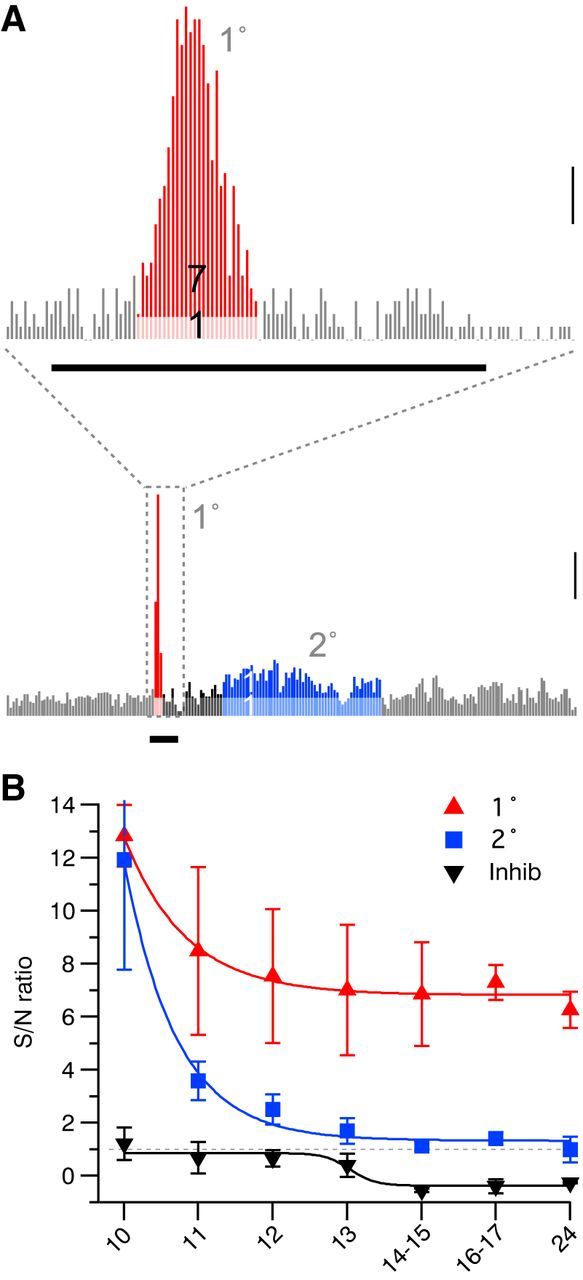
Differential timing of SNR for visual response components. A, Representative peristimulus MUA time histogram (P13) showing the calculation of SNRs of primary (1°, top, red) and secondary (2°, bottom, blue) responses. Mean baseline spike rate is used to calculate the expected spike rate (light red/light blue) and SNR, the ratio of the increased spike rate to baseline, is indicated in dark red/dark blue. Values of 7:1 for 1° and 1:1 for 2° are shown. Scale bar, 100 spikes/s. The thick black bar shows the visual response (100 ms). B, SNR by age for 1° (red, ANOVA for effect of age p < 10−3), 2° (blue, p < 10−3), and inhibitory spike suppression (black, p < 10−3). 1° and 2° response development were best fit by an exponential with similar decay but different asymptotes. Inhibition was fitted as a sigmoid with an inflection between P12 and P14–P15. Visual response SNR decreases before total response amplitude decreases around P14 (Fig. 7-8), which is correlated with the emergence of inhibition.
Discussion
Systematic electrophysiological investigation of activity development in the V1 of nonanesthetized mice in vivo confirms that the mouse possesses multiple characteristics of early cortical activity identified in human neonates born prematurely (Tolonen et al., 2007). These include early spontaneous activity dominated by spindle-shaped oscillations, long periods of network silence (discontinuity), and reverberant, oscillatory responses to sensory stimulation that outlast the stimulus (Khazipov et al., 2013a). The acquisition of mature activity largely occurs as a rapid sequence of transitions that begins at P10 and finishes at eye opening (P14).
By recording daily to track the sequential changes of early activity, we uncovered a novel principle of cortical activity development. Spontaneous resting-state activity of mature cortex can be accounted for by two independent developmental processes (Fig. 13). First, corticothalamic responses to a significant input, spontaneous retinal-waves in V1, smoothly transition from low-frequency oscillations into the broadband β/gamma frequencies observed during cortical activation in adults (McGinley et al., 2015). Second, cortical slow-waves, which are the “idling” state of cortex, are first observed on P10 as isolated bursts and become continuous low-frequency oscillations between P12 and P14. This study will serve as a quantitative foundation and atlas with which to match changes in synapses and circuits to the maturation of emergent cortical network dynamics. They further provide a foundation for examination of the developmental origins of network defects in preclinical models of neurological disorders.
Figure 13.
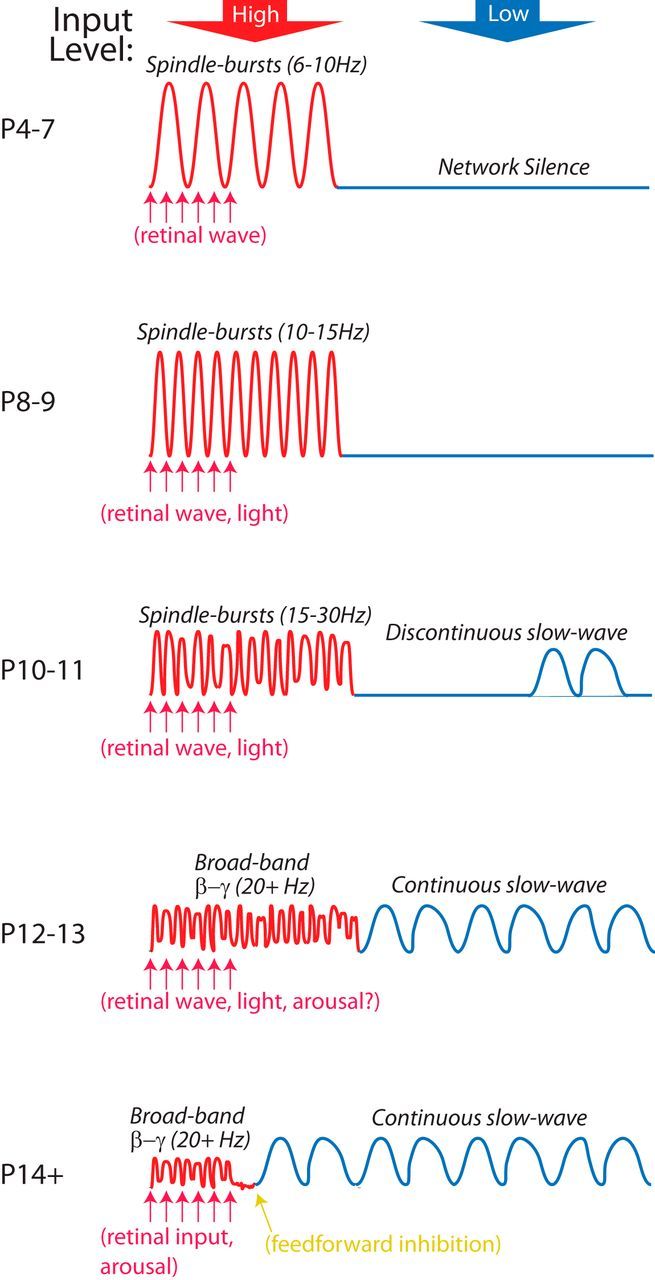
Two processes describing the developmental origins of cortical activity. Synthesis of evoked and spontaneous cortical activity development in the mouse V1. Activity originates as spindle burst oscillations (6 Hz) produced in response to thalamocortical input, which in V1 are generated by retinal waves during the first postnatal week. Circuit changes cause acceleration of these oscillations until they become the broadband high frequencies caused by asynchronous firing in the cortex in response to visual input and arousal. Before the development of feedforward inhibition at P14, thalamocortical input causes long duration rapid activity that can outlast the stimulus (yellow). A second process leads to the development of ongoing activity in the absence of strong input. This activity begins at P10, taking the form of isolated slow waves that become continuous by P12. By P14 (eye opening), slow activity and rapid activity alternate in cortex with arousal state and sensory input.
The mouse as a model for electrophysiological development of cortex
Previous studies of early cortical activity relied on isolation and classification of bursts (Yang et al., 2009; Cichon et al., 2014). Here, we have used mean activity to quantify developmental changes because these measures may be more robust across ages and between laboratories because they avoid the need to create thresholds for isolation and sorting. This method is competent to identify the presence of the major patterns previously described and also allows for comparison with adult animals when individual activity bursts cannot be separated from the continuous background.
The spindle burst oscillations observed here are largely the cortical response to retinal waves. The frequency and appearance of these oscillations are similar to rat spindle bursts, the occurrence of which is strongly reduced by silencing retina and increased by driving wave initiation (Hanganu et al., 2006; Colonnese and Khazipov, 2010). Simultaneous electrophysiology and calcium imaging reveal that spindle burst oscillations occur during retinal waves in neonatal mice (Kummer et al., 2016). Previous studies show that P2–P7 retinal waves drive dense L2/3 calcium events and robust 300–3000 Hz (presumptive MUA) activity on low-impedance electrodes, but we found sparse firing. The low firing rates that we observed likely result from smaller transmembrane currents and poorer action potential pickup by the silicon probes, which can damage superficial tissue and have restricted access to the neuropil relative to microelectrodes. Therefore, we likely underestimate firing and the firing rate and continuity changes between P4 and P7 may reflect this. Further studies may reveal optimal multielectrode array configurations for young mice.
Mice differ from rats in a few notable areas. First, in rats, continuous spontaneous activity and elimination of visually evoked spindle bursts occur simultaneously 2 d before eye opening (Colonnese et al., 2010). In mice, these processes are spread over multiple days and are complete only after the eyes open. A similar species difference has been observed for cortical “UP” states, which develop 2 d earlier in rats (Rochefort et al., 2009; Colonnese, 2014). Because of this, mice may provide a better model of human EEG development, in which continuity emerges in multiple steps in the weeks around term (André et al., 2010). Another difference is the composition of early visual responses. In rats, the primary P9–P11 response is composed of “early-gamma.” a feedforward thalamic oscillation (Khazipov et al., 2013b) dependent on poorly coherent retinal firing. The primary response in mice does not contain early-gamma, but resembles the mature evoked potential. Therefore, murine visual responses, although emerging on the same postnatal day, mature more quickly than in the rat. Another difference is that murine secondary evoked responses are composed of both gamma and spindle burst frequencies, whereas in rats, they contain purely spindle bursts. This suggests that subtle differences in thalamocortical interactions exist between the two species.
Broadband β-gamma activity develops from retinal-wave-driven activity
The relationship between immature oscillations and adult activity patterns is poorly understood. The most prominent hypothesis is that spindle bursts are unique patterns with no homology to adult activities (Tolonen et al., 2007; Colonnese and Khazipov, 2012). However, we show clear developmental progression of spindle burst frequencies to broadband β-gamma frequencies that result from persistent, asynchronous firing during cortical activation (Renart et al., 2010; Polack et al., 2013). This activity is different from the narrow-band gamma oscillations driven by strong visual stimulation combined with arousal, which develops later (Chen et al., 2015; Hoy and Niell, 2015). That the developmental origin of asynchronous activity is the spindle burst is logical because both are the result of thalamic input filtered by cortical networks (Yang et al., 2013; Reinhold et al., 2015). The simplest developmental model is that immature thalamocortical circuitry, particularly the absence of rapid inhibition (Minlebaev et al., 2011), means that retinal excitation drives oscillations. As transmission times mature, the oscillations accelerate. Finally, maturation of feedforward inhibition (Colonnese, 2014; Marques-Smith et al., 2016; Tuncdemir et al., 2016) and intracortical connectivity (Valiullina et al., 2016) desynchronizes thalamic and cortical activity resulting in asynchronous firing.
In contrast, slow-wave activity, which in adults occurs during periods of low arousal and input (McGinley et al., 2015), arises later in development. These frequencies first have significant representation in the mean spectra at P10, as has been observed in medial cortex (Seelke and Blumberg, 2008). This initiation of slow activity is likely mediated by the onset of significant corticocortical synapses (Etherington and Williams, 2011; Valiullina et al., 2016), which can produce giant-depolarizing-potentials (Allène et al., 2008), the cortical network primitive of UP states (Khazipov et al., 2013a). As synaptic density increases and fast inhibition develops, we propose that UP states become more frequent and stable (Rochefort et al., 2009; Sanchez-Vives et al., 2010; Colonnese, 2014), allowing the counterbalancing down states to drive the large fluctuations in the EEG, increasing the power of low frequencies (McCormick et al., 2015).
A recent study in human infants (Benders et al., 2015) showed that maturation of delta brush activities are correlated with thalamic growth, whereas continuous (slow-wave) activity is correlated with cortical growth, confirming the independence of these developmental trajectories. Interestingly, the two developmental processes converge so that spontaneous cortical activity has acquired many of its adult characteristics at eye opening (Hoy and Niell, 2015).
Thalamocortical network properties determine maturation of visual processing
Visual perception requires the development of selective receptive fields (Huberman et al., 2008), but also the maturation of circuit dynamics that determine the temporal specificity, state regulation, and plasticity of visual responses. Early sensory responses have immature properties, including dense firing (Golshani et al., 2009; Rochefort et al., 2009), propensity to generate waves (Smith et al., 2015), and plateau potentials (Colonnese, 2014), all of which combine to amplify retinal inputs (Colonnese et al., 2010) and ensure transmission of retinal waves, but are poorly suited for the transmission of visual information. Our data show that this “contamination” of visual responses by specialized early circuit properties most prominently affects the secondary responses. The developmental profile suggests that evoked spindle bursts transform into the long-latency recurrent potentials associated with access to conscious perception (Pins and Ffytche, 2003). This transformation occurs as a threefold process: (1) increasing ongoing activity reduces the relative importance of secondary spiking, (2) evoked LFP oscillations are eliminated, and (3) duration is shortened. Therefore, multiple circuit changes likely contribute.
An unexpected finding of our study is that this secondary response actually develops before the direct, primary response. Photoreceptor-driven responses of RGCs are largely absent in vitro before P10 (Tian and Copenhagen, 2003), making the origin of N2 unclear. Intrinsically photosensitive retinal ganglion cell (ipRGC) responses occur in retina (Ecker et al., 2010) and thalamocortex (Brown et al., 2010), but are unlikely to contribute to N2 development. ipRGCs already exert behavioral (Johnson et al., 2010) and electrophysiological (Renna et al., 2011; Kirkby and Feller, 2013) effects before P8, when we first observed N2. Furthermore, synaptic blockade in retina eliminates visual responses in rats at equivalent ages (Colonnese et al., 2010). We suggest that the P8–P9 N2 results from massive amplification of very weak retinal output (not detectable in vitro) that triggers runaway excitation even before short-latency responses are coherent enough to reach cortex. The mature SNR of the primary visual response is established earlier than the secondary response, further suggesting that the development of these two components progresses through different mechanisms, the primary response largely reflecting retinal maturation and the secondary determined by the intracortical circuit properties.
Although mediated by different mechanisms with slightly offset timing, the maturation of cortical activity is largely coordinated to occur by eye opening. Whether this coordination is the result of a cascade of dependent events or is due to a single factor (such as a neuromodulator) is unclear. We expect such a transition to be an important checkpoint in the development of neurodevelopmental disorders (Ben-Ari and Spitzer, 2010). By providing a systematic reference for activity development in the mouse, we hope that the present work can provide hypotheses for the role of circuit transformations occurring in normal and disease models (Gonçalves et al., 2013; Rebello et al., 2014; Berzhanskaya et al., 2016).
Footnotes
This work was supported by the National Eye Institute–National Institutes of Health (Grant EY022730). We thank Marnie Phillips for assistance in drafting and editing the manuscript.
The authors declare no competing financial interests.
References
- Ackman JB, Crair MC. Role of emergent neural activity in visual map development. Curr Opin Neurobiol. 2014;24:166–175. doi: 10.1016/j.conb.2013.11.011. [DOI] [PMC free article] [PubMed] [Google Scholar]
- Ackman JB, Burbridge TJ, Crair MC. Retinal waves coordinate patterned activity throughout the developing visual system. Nature. 2012;490:219–225. doi: 10.1038/nature11529. [DOI] [PMC free article] [PubMed] [Google Scholar]
- Allène C, Cattani A, Ackman JB, Bonifazi P, Aniksztejn L, Ben-Ari Y, Cossart R. Sequential generation of two distinct synapse-driven network patterns in developing neocortex. J Neurosci. 2008;28:12851–12863. doi: 10.1523/JNEUROSCI.3733-08.2008. [DOI] [PMC free article] [PubMed] [Google Scholar]
- An S, Kilb W, Luhmann HJ. Sensory-evoked and spontaneous gamma and spindle bursts in neonatal rat motor cortex. J Neurosci. 2014;34:10870–10883. doi: 10.1523/JNEUROSCI.4539-13.2014. [DOI] [PMC free article] [PubMed] [Google Scholar]
- André M, Lamblin MD, d'Allest AM, Curzi-Dascalova L, Moussalli-Salefranque F, S Nguyen The T, Vecchierini-Blineau MF, Wallois F, Walls-Esquivel E, Plouin P. Electroencephalography in premature and full-term infants: developmental features and glossary. Neurophysiol Clin. 2010;40:59–124. doi: 10.1016/j.neucli.2010.02.002. [DOI] [PubMed] [Google Scholar]
- Ben-Ari Y, Spitzer NC. Phenotypic checkpoints regulate neuronal development. Trends Neurosci. 2010;33:485–492. doi: 10.1016/j.tins.2010.08.005. [DOI] [PMC free article] [PubMed] [Google Scholar]
- Benders MJ, Palmu K, Menache C, Borradori-Tolsa C, Lazeyras F, Sizonenko S, Dubois J, Vanhatalo S, Hüppi PS. Early brain activity relates to subsequent brain growth in premature infants. Cereb Cortex. 2015;25:3014–3024. doi: 10.1093/cercor/bhu097. [DOI] [PubMed] [Google Scholar]
- Berry MW, Browne M, Langville AN, Pauca VP, Plemmons RJ. Algorithms and applications for approximate non-negative matrix factorization. Comput Stat Data Anal. 2007;52:155–173. doi: 10.1016/j.csda.2006.11.006. [DOI] [Google Scholar]
- Berzhanskaya J, Phillips MA, Gorin A, Lai C, Shen J, Colonnese MT. Disrupted cortical state regulation in a rat model of fragile X syndrome. Cereb Cortex. 2016 doi: 10.1093/cercor/bhv331. In press. [DOI] [PMC free article] [PubMed] [Google Scholar]
- Blankenship AG, Feller MB. Mechanisms underlying spontaneous patterned activity in developing neural circuits. Nat Rev Neurosci. 2010;11:18–29. doi: 10.1038/nrn2759. [DOI] [PMC free article] [PubMed] [Google Scholar]
- Brockmann MD, Pöschel B, Cichon N, Hanganu-Opatz IL. Coupled oscillations mediate directed interactions between prefrontal cortex and hippocampus of the neonatal rat. Neuron. 2011;71:332–347. doi: 10.1016/j.neuron.2011.05.041. [DOI] [PubMed] [Google Scholar]
- Brown TM, Gias C, Hatori M, Keding SR, Semo M, Coffey PJ, Gigg J, Piggins HD, Panda S, Lucas RJ. Melanopsin contributions to irradiance coding in the thalamo-cortical visual system. PLoS Biol. 2010;8:e1000558. doi: 10.1371/journal.pbio.1000558. [DOI] [PMC free article] [PubMed] [Google Scholar]
- Chen G, Rasch MJ, Wang R, Zhang XH. Experience-dependent emergence of beta and gamma band oscillations in the primary visual cortex during the critical period. Sci Rep. 2015;5:17847. doi: 10.1038/srep17847. [DOI] [PMC free article] [PubMed] [Google Scholar]
- Chipaux M, Colonnese MT, Mauguen A, Fellous L, Mokhtari M, Lezcano O, Milh M, Dulac O, Chiron C, Khazipov R, Kaminska A. Auditory stimuli mimicking ambient sounds drive temporal “delta brushes” in premature infants. PLoS One. 2013;8:e79028. doi: 10.1371/journal.pone.0079028. [DOI] [PMC free article] [PubMed] [Google Scholar]
- Cichon NB, Denker M, Grün S, Hanganu-Opatz IL. Unsupervised classification of neocortical activity patterns in neonatal and pre-juvenile rodents. Front Neural Circuits. 2014;8:50. doi: 10.3389/fncir.2014.00050. [DOI] [PMC free article] [PubMed] [Google Scholar]
- Colonnese M, Khazipov R. Spontaneous activity in developing sensory circuits: Implications for resting state fMRI. Neuroimage. 2012;62:2212–2221. doi: 10.1016/j.neuroimage.2012.02.046. [DOI] [PubMed] [Google Scholar]
- Colonnese MT. Rapid developmental emergence of stable depolarization during wakefulness by inhibitory balancing of cortical network excitability. J Neurosci. 2014;34:5477–5485. doi: 10.1523/JNEUROSCI.3659-13.2014. [DOI] [PMC free article] [PubMed] [Google Scholar]
- Colonnese MT, Khazipov R. “Slow activity transients” in infant rat visual cortex: A spreading synchronous oscillation patterned by retinal waves. J Neurosci. 2010;30:4325–4337. doi: 10.1523/JNEUROSCI.4995-09.2010. [DOI] [PMC free article] [PubMed] [Google Scholar]
- Colonnese MT, Kaminska A, Minlebaev M, Milh M, Bloem B, Lescure S, Moriette G, Chiron C, Ben-Ari Y, Khazipov R. A conserved switch in sensory processing prepares developing neocortex for vision. Neuron. 2010;67:480–498. doi: 10.1016/j.neuron.2010.07.015. [DOI] [PMC free article] [PubMed] [Google Scholar]
- Cossart R. The maturation of cortical interneuron diversity: How multiple developmental journeys shape the emergence of proper network function. Curr Opin Neurobiol. 2011;21:160–168. doi: 10.1016/j.conb.2010.10.003. [DOI] [PubMed] [Google Scholar]
- Dean JM, Bennet L, Back SA, McClendon E, Riddle A, Gunn AJ. What brakes the preterm brain? an arresting story. Pediatr Res. 2014;75:227–233. doi: 10.1038/pr.2013.189. [DOI] [PubMed] [Google Scholar]
- Dehorter N, Vinay L, Hammond C, Ben-Ari Y. Timing of developmental sequences in different brain structures: physiological and pathological implications. Eur J Neurosci. 2012;35:1846–1856. doi: 10.1111/j.1460-9568.2012.08152.x. [DOI] [PubMed] [Google Scholar]
- Ecker JL, Dumitrescu ON, Wong KY, Alam NM, Chen SK, LeGates T, Renna JM, Prusky GT, Berson DM, Hattar S. Melanopsin-expressing retinal ganglion-cell photoreceptors: cellular diversity and role in pattern vision. Neuron. 2010;67:49–60. doi: 10.1016/j.neuron.2010.05.023. [DOI] [PMC free article] [PubMed] [Google Scholar]
- Etherington SJ, Williams SR. Postnatal development of intrinsic and synaptic properties transforms signaling in the layer 5 excitatory neural network of the visual cortex. J Neurosci. 2011;31:9526–9537. doi: 10.1523/JNEUROSCI.0458-11.2011. [DOI] [PMC free article] [PubMed] [Google Scholar]
- Golshani P, Gonçalves JT, Khoshkhoo S, Mostany R, Smirnakis S, Portera-Cailliau C. Internally mediated developmental desynchronization of neocortical network activity. J Neurosci. 2009;29:10890–10899. doi: 10.1523/JNEUROSCI.2012-09.2009. [DOI] [PMC free article] [PubMed] [Google Scholar]
- Gonçalves JT, Anstey JE, Golshani P, Portera-Cailliau C. Circuit level defects in the developing neocortex of fragile X mice. Nat Neurosci. 2013;16:903–909. doi: 10.1038/nn.3415. [DOI] [PMC free article] [PubMed] [Google Scholar]
- Gordon JA, Stryker MP. Experience-dependent plasticity of binocular responses in the primary visual cortex of the mouse. J Neurosci. 1996;16:3274–3286. doi: 10.1523/JNEUROSCI.16-10-03274.1996. [DOI] [PMC free article] [PubMed] [Google Scholar]
- Hanganu IL, Ben-Ari Y, Khazipov R. Retinal waves trigger spindle bursts in the neonatal rat visual cortex. J Neurosci. 2006;26:6728–6736. doi: 10.1523/JNEUROSCI.0752-06.2006. [DOI] [PMC free article] [PubMed] [Google Scholar]
- He BJ. Scale-free brain activity: Past, present, and future. Trends Cogn Sci. 2014;18:480–487. doi: 10.1016/j.tics.2014.04.003. [DOI] [PMC free article] [PubMed] [Google Scholar]
- Hoy JL, Niell CM. Layer-specific refinement of visual cortex function after eye opening in the awake mouse. J Neurosci. 2015;35:3370–3383. doi: 10.1523/JNEUROSCI.3174-14.2015. [DOI] [PMC free article] [PubMed] [Google Scholar]
- Huberman AD, Feller MB, Chapman B. Mechanisms underlying development of visual maps and receptive fields. Annu Rev Neurosci. 2008;31:479–509. doi: 10.1146/annurev.neuro.31.060407.125533. [DOI] [PMC free article] [PubMed] [Google Scholar]
- Ignacio MP, Kimm EJ, Kageyama GH, Yu J, Robertson RT. Postnatal migration of neurons and formation of laminae in rat cerebral cortex. Anat Embryol (Berl) 1995;191:89–100. doi: 10.1007/BF00186782. [DOI] [PubMed] [Google Scholar]
- Johnson J, Wu V, Donovan M, Majumdar S, Rentería RC, Porco T, Van Gelder RN, Copenhagen DR. Melanopsin-dependent light avoidance in neonatal mice. Proc Natl Acad Sci U S A. 2010;107:17374–17378. doi: 10.1073/pnas.1008533107. [DOI] [PMC free article] [PubMed] [Google Scholar]
- Kanold PO, Luhmann HJ. The subplate and early cortical circuits. Annu Rev Neurosci. 2010;33:23–48. doi: 10.1146/annurev-neuro-060909-153244. [DOI] [PubMed] [Google Scholar]
- Khazipov R, Sirota A, Leinekugel X, Holmes GL, Ben-Ari Y, Buzsáki G. Early motor activity drives spindle bursts in the developing somatosensory cortex. Nature. 2004;432:758–761. doi: 10.1038/nature03132. [DOI] [PubMed] [Google Scholar]
- Khazipov R, Colonnese M, Minlebaev M. Neonatal cortical rhythms. In: Rubenstein JL, Rakic P, editors. Neural circuit development and function in the brain: Comprehensive developmental neuroscience. Vol 3. London: Elsevier; 2013a. pp. 131–153. [Google Scholar]
- Khazipov R, Minlebaev M, Valeeva G. Early gamma oscillations. Neuroscience. 2013b;250:240–252. doi: 10.1016/j.neuroscience.2013.07.019. [DOI] [PubMed] [Google Scholar]
- Kirkby LA, Feller MB. Intrinsically photosensitive ganglion cells contribute to plasticity in retinal wave circuits. Proc Natl Acad Sci U S A. 2013;110:12090–12095. doi: 10.1073/pnas.1222150110. [DOI] [PMC free article] [PubMed] [Google Scholar]
- Kirkby LA, Sack GS, Firl A, Feller MB. A role for correlated spontaneous activity in the assembly of neural circuits. Neuron. 2013;80:1129–1144. doi: 10.1016/j.neuron.2013.10.030. [DOI] [PMC free article] [PubMed] [Google Scholar]
- Kummer M, Kirmse K, Zhang C, Haueisen J, Witte OW, Holthoff K. Column-like Ca (2+) clusters in the mouse neonatal neocortex revealed by three-dimensional two-photon Ca (2+) imaging in vivo. Neuroimage. 2016;138:64–75. doi: 10.1016/j.neuroimage.2016.05.050. [DOI] [PubMed] [Google Scholar]
- Liu BH, Li P, Sun YJ, Li YT, Zhang LI, Tao HW. Intervening inhibition underlies simple-cell receptive field structure in visual cortex. Nat Neurosci. 2010;13:89–96. doi: 10.1038/nn.2443. [DOI] [PMC free article] [PubMed] [Google Scholar]
- Marques-Smith A, Lyngholm D, Kaufmann AK, Stacey JA, Hoerder-Suabedissen A, Becker EB, Wilson MC, Molnár Z, Butt SJ. A transient translaminar GABAergic interneuron circuit connects thalamocortical recipient layers in neonatal somatosensory cortex. Neuron. 2016;89:536–549. doi: 10.1016/j.neuron.2016.01.015. [DOI] [PMC free article] [PubMed] [Google Scholar]
- McCormick DA, McGinley MJ, Salkoff DB. Brain state dependent activity in the cortex and thalamus. Curr Opin Neurobiol. 2015;31:133–140. doi: 10.1016/j.conb.2014.10.003. [DOI] [PMC free article] [PubMed] [Google Scholar]
- McGinley MJ, Vinck M, Reimer J, Batista-Brito R, Zagha E, Cadwell CR, Tolias AS, Cardin JA, McCormick DA. Waking state: Rapid variations modulate neural and behavioral responses. Neuron. 2015;87:1143–1161. doi: 10.1016/j.neuron.2015.09.012. [DOI] [PMC free article] [PubMed] [Google Scholar]
- Milh M, Kaminska A, Huon C, Lapillonne A, Ben-Ari Y, Khazipov R. Rapid cortical oscillations and early motor activity in premature human neonate. Cereb Cortex. 2007;17:1582–1594. doi: 10.1093/cercor/bhl069. [DOI] [PubMed] [Google Scholar]
- Minlebaev M, Colonnese M, Tsintsadze T, Sirota A, Khazipov R. Early gamma oscillations synchronize developing thalamus and cortex. Science. 2011;334:226–229. doi: 10.1126/science.1210574. [DOI] [PubMed] [Google Scholar]
- Mitra P, Bokil H. Observed brain dynamics. New York: OUP; 2007. [Google Scholar]
- Murata Y, Colonnese MT. An excitatory cortical feedback loop gates retinal wave transmission in rodent thalamus. eLife. 2016;5:e18816. doi: 10.7554/eLife.18816. pii. [DOI] [PMC free article] [PubMed] [Google Scholar]
- Niell CM, Stryker MP. Highly selective receptive fields in mouse visual cortex. J Neurosci. 2008;28:7520–7536. doi: 10.1523/JNEUROSCI.0623-08.2008. [DOI] [PMC free article] [PubMed] [Google Scholar]
- Pampiglione G. Development of some rhythmic activity in the E.E.G. of young pigs, lambs and puppies. Rev Electroencephalogr Neurophysiol Clin. 1977;7:255–262. doi: 10.1016/S0370-4475(77)80002-6. [DOI] [PubMed] [Google Scholar]
- Pins D, Ffytche D. The neural correlates of conscious vision. Cereb Cortex. 2003;13:461–474. doi: 10.1093/cercor/13.5.461. [DOI] [PubMed] [Google Scholar]
- Polack PO, Friedman J, Golshani P. Cellular mechanisms of brain state-dependent gain modulation in visual cortex. Nat Neurosci. 2013;16:1331–1339. doi: 10.1038/nn.3464. [DOI] [PMC free article] [PubMed] [Google Scholar]
- Rebello TJ, Yu Q, Goodfellow NM, Caffrey Cagliostro MK, Teissier A, Morelli E, Demireva EY, Chemiakine A, Rosoklija GB, Dwork AJ, Lambe EK, Gingrich JA, Ansorge MS. Postnatal day 2 to 11 constitutes a 5-HT-sensitive period impacting adult mPFC function. J Neurosci. 2014;34:12379–12393. doi: 10.1523/JNEUROSCI.1020-13.2014. [DOI] [PMC free article] [PubMed] [Google Scholar]
- Reinhold K, Lien AD, Scanziani M. Distinct recurrent versus afferent dynamics in cortical visual processing. Nat Neurosci. 2015;18:1789–1797. doi: 10.1038/nn.4153. [DOI] [PubMed] [Google Scholar]
- Renart A, de la Rocha J, Bartho P, Hollender L, Parga N, Reyes A, Harris KD. The asynchronous state in cortical circuits. Science. 2010;327:587–590. doi: 10.1126/science.1179850. [DOI] [PMC free article] [PubMed] [Google Scholar]
- Renna JM, Weng S, Berson DM. Light acts through melanopsin to alter retinal waves and segregation of retinogeniculate afferents. Nat Neurosci. 2011;14:827–829. doi: 10.1038/nn.2845. [DOI] [PMC free article] [PubMed] [Google Scholar]
- Rochefort NL, Garaschuk O, Milos RI, Narushima M, Marandi N, Pichler B, Kovalchuk Y, Konnerth A. Sparsification of neuronal activity in the visual cortex at eye opening. Proc Natl Acad Sci U S A. 2009;106:15049–15054. doi: 10.1073/pnas.0907660106. [DOI] [PMC free article] [PubMed] [Google Scholar]
- Rochefort NL, Narushima M, Grienberger C, Marandi N, Hill DN, Konnerth A. Development of direction selectivity in mouse cortical neurons. Neuron. 2011;71:425–432. doi: 10.1016/j.neuron.2011.06.013. [DOI] [PubMed] [Google Scholar]
- Sanchez-Vives MV, Mattia M, Compte A, Perez-Zabalza M, Winograd M, Descalzo VF, Reig R. Inhibitory modulation of cortical up states. J Neurophysiol. 2010;104:1314–1324. doi: 10.1152/jn.00178.2010. [DOI] [PubMed] [Google Scholar]
- Seelke AM, Blumberg MS. The microstructure of active and quiet sleep as cortical delta activity emerges in infant rats. Sleep. 2008;31:691–699. doi: 10.1093/sleep/31.5.691. [DOI] [PMC free article] [PubMed] [Google Scholar]
- Smith GB, Sederberg A, Elyada YM, Van Hooser SD, Kaschube M, Fitzpatrick D. The development of cortical circuits for motion discrimination. Nat Neurosci. 2015;18:252–261. doi: 10.1038/nn.3921. [DOI] [PMC free article] [PubMed] [Google Scholar]
- Thomson DJ. Spectrum estimation and harmonic analysis. Proc IEEE. 1982;70:1055–1096. doi: 10.1109/PROC.1982.12433. [DOI] [Google Scholar]
- Tian N, Copenhagen DR. Visual stimulation is required for refinement of ON and OFF pathways in postnatal retina. Neuron. 2003;39:85–96. doi: 10.1016/S0896-6273(03)00389-1. [DOI] [PubMed] [Google Scholar]
- Tolonen M, Palva JM, Andersson S, Vanhatalo S. Development of the spontaneous activity transients and ongoing cortical activity in human preterm babies. Neuroscience. 2007;145:997–1006. doi: 10.1016/j.neuroscience.2006.12.070. [DOI] [PubMed] [Google Scholar]
- Tran TN, Drab K, Daszykowski M. Revised DBSCAN algorithm to cluster data with dense adjacent clusters. Chemometrics and Intelligent Laboratory Systems. 2013;120:92–96. doi: 10.1016/j.chemolab.2012.11.006. [DOI] [Google Scholar]
- Tuncdemir SN, Wamsley B, Stam FJ, Osakada F, Goulding M, Callaway EM, Rudy B, Fishell G. Early somatostatin interneuron connectivity mediates the maturation of deep layer cortical circuits. Neuron. 2016;89:521–535. doi: 10.1016/j.neuron.2015.11.020. [DOI] [PMC free article] [PubMed] [Google Scholar]
- Valiullina F, Akhmetshina D, Nasretdinov A, Mukhtarov M, Valeeva G, Khazipov R, Rozov A. Developmental changes in electrophysiological properties and a transition from electrical to chemical coupling between excitatory layer 4 neurons in the rat barrel cortex. Front Neural Circuits. 2016;10:1. doi: 10.3389/fncir.2016.00001. [DOI] [PMC free article] [PubMed] [Google Scholar]
- Vanhatalo S, Tallgren P, Andersson S, Sainio K, Voipio J, Kaila K. DC-EEG discloses prominent, very slow activity patterns during sleep in preterm infants. Clin Neurophysiol. 2002;113:1822–1825. doi: 10.1016/S1388-2457(02)00292-4. [DOI] [PubMed] [Google Scholar]
- Yang JW, An S, Sun JJ, Reyes-Puerta V, Kindler J, Berger T, Kilb W, Luhmann HJ. Thalamic network oscillations synchronize ontogenetic columns in the newborn rat barrel cortex. Cereb Cortex. 2013;23:1299–1316. doi: 10.1093/cercor/bhs103. [DOI] [PubMed] [Google Scholar]
- Yang JW, Reyes-Puerta V, Kilb W, Luhmann HJ. Spindle bursts in neonatal rat cerebral cortex. Neural Plast. 2016;2016:3467832. doi: 10.1155/2016/3467832. [DOI] [PMC free article] [PubMed] [Google Scholar]
- Yang JW, Hanganu-Opatz IL, Sun JJ, Luhmann HJ. Three patterns of oscillatory activity differentially synchronize developing neocortical networks in vivo. J Neurosci. 2009;29:9011–9025. doi: 10.1523/JNEUROSCI.5646-08.2009. [DOI] [PMC free article] [PubMed] [Google Scholar]


