

Abstract
During non-rapid eye movement (NREM) sleep, cortical neurons alternate between ON periods of firing and OFF periods of silence. This bi-stability, which is largely synchronous across neurons, is reflected in the EEG as slow waves. Slow-wave activity (SWA) increases with wake duration and declines homeostatically during sleep, but the underlying mechanisms remain unclear. One possibility is neuronal “fatigue”: high, sustained firing in wake would force neurons to recover with more frequent and longer OFF periods during sleep. Another possibility is net synaptic potentiation during wake: stronger coupling among neurons would lead to greater synchrony and therefore higher SWA. Here, we obtained a comparable increase in sustained firing (6 h) in cortex by: (1) keeping mice awake by exposure to novel objects to promote plasticity and (2) optogenetically activating a local population of cortical neurons at wake-like levels during sleep. Sleep after extended wake led to increased SWA, higher synchrony, and more time spent OFF, with a positive correlation between SWA, synchrony, and OFF periods. Moreover, time spent OFF was correlated with cortical firing during prior wake. After local optogenetic stimulation, SWA and cortical synchrony decreased locally, time spent OFF did not change, and local SWA was not correlated with either measure. Moreover, laser-induced cortical firing was not correlated with time spent OFF afterward. Overall, these results suggest that high sustained firing per se may not be the primary determinant of SWA increases observed after extended wake.
SIGNIFICANCE STATEMENT A long-standing hypothesis is that neurons fire less during slow-wave sleep to recover from the “fatigue” accrued during wake, when overall synaptic activity is higher than in sleep. This idea, however, has rarely been tested and other factors, namely increased cortical synchrony, could explain why sleep slow-wave activity (SWA) is higher after extended wake. We forced neurons in the mouse cortex to fire at high levels for 6 h in 2 different conditions: during active wake with exploration and during sleep. We find that neurons need more time OFF only after sustained firing in wake, suggesting that fatigue due to sustained firing alone is unlikely to account for the increase in SWA that follows sleep deprivation.
Keywords: cerebral cortex, fatigue, mouse, NREM sleep, optogenetics, sleep deprivation
Introduction
During non-rapid eye movement (NREM) sleep, cortical and thalamic neurons oscillate between ON states of firing and OFF periods of silence (Steriade et al., 2001, Chauvette et al., 2011). This bistability occurs more or less synchronously in many neurons and is recorded in the EEG as slow waves. During NREM sleep, the amplitude and incidence of slow waves are quantified using slow-wave activity (SWA), the EEG power in the 0.5–4.0 Hz range. SWA increases with wake duration, peaks in early sleep, and declines in late sleep. SWA is considered an index of the homeostatic process “S,” reflecting the increase in sleep need/intensity with wake duration, in conjunction with the circadian factor “C,” which affects primarily sleep timing and duration (Borbély, 1982, Borbély et al., 2016).
However, the mechanisms linking wake duration to SWA remain unclear. Early hypotheses included the possible accumulation of “an endogenous sleep compound which is eliminated or inactivated during sleep” (Borbély et al., 1981) or of “metabolic processes” that need to be reversed in sleep (Feinberg et al., 1978). A long-standing hypothesis is that during wake neurons may accrue “fatigue” due to overall higher firing, which would be reversed in NREM sleep as a result of reduced firing during OFF periods (Rechtschaffen, 1998, Vyazovskiy and Harris, 2013). Neuronal fatigue is usually conceptualized as temporary exhaustion triggered by intense activity due to momentary run-down of energy resources, for example, glycogen (Dalsgaard and Secher, 2007), depletion of synaptic vesicles/calcium (O'Donovan and Rinzel, 1997), or accumulation of adenosine (Brundege and Dunwiddie, 1998, Brambilla et al., 2005, Lovatt et al., 2012). Indeed, it was suggested explicitly that SWA may reflect the buildup of adenosine and the subsequent potentiation of potassium currents that hyperpolarize cortical neurons during the OFF state (Benington and Heller, 1995).
Another hypothesis is that wake would lead to an overall increase in synaptic strength associated with learning and that sleep would then be required to renormalize synaptic weights, with beneficial effects both at the cellular level (energy, supplies) and at the systems level (memory) (Cirelli et al., 2004, Tononi and Cirelli, 2006, 2012, 2014). The increase in SWA after wake would be due primarily to the increase in neuronal synchrony brought about by stronger synaptic coupling, just as its decrease during sleep would be due to reduced synchrony following net synaptic depression. The net increase in synaptic strength during wake and its decrease during sleep is supported by molecular, electrophysiological, and structural and ultrastructural evidence (Tononi and Cirelli, 2014; de Vivo et al., 2016). Moreover, computer simulations show that increased synaptic strength is sufficient to cause higher synchrony, higher SWA, as well as more numerous and prolonged OFF periods (Esser et al., 2007). Accordingly, the onset of ON and OFF periods is more synchronous after extended wake and less so after sleep (Vyazovskiy et al., 2009).
So far, many studies have demonstrated a global increase in SWA after extended wakefulness with object exploration and local increases after specific learning tasks (Hanlon et al., 2011). However, the relative contribution of increased neuronal firing and synaptic plasticity to subsequent SWA cannot easily be disentangled. The occurrence of OFF periods during wake (“local sleep”) after extended exploration of novel objects (Vyazovskiy et al., 2011) could also reflect either fatigue due to excessive firing and/or excessive synaptic potentiation. In this work, we set out to test directly whether a sustained increase in mean cortical firing rate during wake, which is obtained by having animals explore novel objects to promote plasticity, and a comparable increase obtained by optogenetic stimulation during sleep lead to differential effects on neuronal synchrony, SWA, and OFF periods during subsequent NREM sleep.
Materials and Methods
Surgery.
Adult (∼60–90 d old) male transgenic B6.Cg-Tg(Camk2a-Cre)T29–1Stl/J mice that express Cre recombinase in excitatory cortical neurons were used (Jackson Laboratory, stock #005359, RRID:IMSR_JAX:005359). Animals were housed in single cages and kept on a 12h/12 h light/dark cycle with lights on at 10:00 A.M. All animal procedures and experimental protocols followed the National Institutes of Health's Guide for the Care and Use of Laboratory Animals and were approved by the licensing committee. All animal facilities were reviewed and approved by the institutional animal care and use committee of the University of Wisconsin–Madison and were inspected and accredited by the Association for Assessment and Accreditation of Laboratory Animal Care.
Virus injection and electrode implantation were performed in 2 separate surgeries because adeno-associated viruses take up to 3 weeks to become fully expressed and cortical electrodes have a limited viable recording time once implanted due to immune responses or glial buildup (Grill, 2008). Therefore, we waited 3 weeks after virus injection before performing the electrode implant surgery. Both surgeries were performed under isoflurane anesthesia (2% for induction, 1–2% for maintenance) using proper sterile technique. After making a small craniotomy in the skull, the purified adeno-associated virus rAAV5-Ef1a-DIO hChR2 (C128S/D156A-EYFP) (4 × 10¹² virus particles/ml) was stereotaxically injected into the right frontal cortex (from bregma, +1.28 A/P; +1.0 M/L; −1.5 D/V) at 0.1 μl/min for 20 min (total 2 μl of virus), with a 10 min wait after the end of the injection to allow for liquid diffusion into the cortex. This stable step function opsin (SSFO) virus was obtained from the University of North Carolina vector core (RRID:SCR_002448) under an agreement with Dr. Karl Deisseroth at Stanford University. The small craniotomy was covered using the dental acrylic Fusio (Pentron Clinical) and the incision was closed using Vetbond (3M). For chronic polygraphic recordings, gold screws were inserted into the skull above left frontal (+1.4 AP, −1.5 M/L) and right parietal cortex (−2.5A/P, +1.7 M/L) to record EEG activity and stainless steel wires were implanted into the nuchal muscles for EMG. Moreover, a microwire electrode array with 16 electrodes (Tucker-Davis Technologies, RRID:SCR_006495) cemented to an optic fiber ferrule (Doric Lenses) was inserted into the right frontal hemisphere (+1.0 A/P; +1.0 M/L; −1.4 D/V; D/V measured from cortex), along with a laminar probe (Neuronexus) or a second microwire array into the left parietal cortex. Arrays were targeted to the deep cortical layers (mainly layer 5), whereas laminar probes spanned all layers. After 1 week of recovery from the second surgery, animals were connected to a wire bundle to record electrical signals and an optic patch cable to prepare for laser stimulation. Using the RZ2 amplifier and PZ2 preamplifier (Tucker-Davis Technologies, RRID:SCR_006495), EEG (256 Hz, band-pass filtered at 0.1–100 Hz) and EMG (256 Hz, band-pass filtered at 10–50 Hz) signals were continuously collected for several weeks, together with local field potentials (LFPs, 256 Hz, band-pass filtered at 0.1–100 Hz) and multiunit activity (MUA, 24.4 kHz, band-pass filtered at 300–5000 Hz). Thresholds for MUA were set manually <0 mV and waveforms for each threshold-crossing event were saved. Experiments started only after the sleep/wake cycle had normalized and mice were fully entrained to the light/dark cycle, sleeping mostly during the day and staying awake mainly at night. Percentage of sleep and wake (mean ± SD) during the light phase in baseline were consistent with published values (Franken et al., 1999, Huber et al., 2000, Bellesi et al., 2015): wake: 39.8 ± 5.0%, NREM sleep: 50.5 ± 4.6%, REM sleep: 9.7 ± 1.6%.
Sleep deprivation.
Sleep deprivation was performed for 6 h starting at light onset using exposure to novel objects. Because the procedure can be stressful in naive animals, mice were familiarized with the method by placing a new object in the cage every day for several days before the sleep deprivation experiment. During sleep deprivation, mice were given a new object or bedding every time they were inactive and slow waves became evident on real-time EEG monitoring. Mice were never disturbed when they were spontaneously awake, feeding, or drinking. Because some mice continue to stay awake for variable amounts of time after all objects are removed, analysis always started at hour 7, but the exact time was adjusted to begin at the onset of consolidated sleep, defined as the first 30 min window in which sleep accounted for at least 50% of the time and the first 3 min of which also included at least 50% of time spent asleep.
Laser stimulation during NREM sleep (laser-S).
To activate the SSFO rAAV5-Ef1a-DIO-hChR2 (C128S/D156A)-EYFP a 473 nm wavelength laser (OEM Laser Systems) was used. Laser stimulation was delivered remotely by an investigator who was outside of the room housing the mice and was checking the polygraphic traces online. Short pulses of 2.3 ± 1.2 s (mean ± SD) in duration and ∼1 mW in intensity (minimum 100 μW, maximum 15 mW, almost all pulses near 1 mW) were given approximately every 5 min, always during NREM sleep. Laser power and pulse timing were titrated to maintain wake-like, tonic firing in the stimulated electrodes. To match the sleep deprivation experiment, the overall duration of the laser-S experiment was 6 h; the last pulse was given no later than 20 min before the end of the sixth hour to allow SSFO channels to close, thus reducing the risk of carryover effects.
Data analysis.
Frontal and parietal EEG and LFPs and EMG waveforms were exported to the graphic interface SleepSign (Kissei Comtec), in which 4 s epochs were manually scored as wake, NREM sleep, or REM sleep according to established criteria. In wake, muscle activity was high and the EEG was dominated by low-amplitude, high-frequency activity, whereas NREM sleep was characterized by low muscle tone and high-amplitude, low-frequency EEG/LFP activity, and REM sleep by low EMG activity with occasional twitches and strong theta (6–9 Hz) activity. Scoring could not be blind to experimental condition, given the obvious unique features of sleep deprivation (continuous wake for 6 h) and laser-S (high gamma power, see Results). All further analyses were performed using custom scripts in MATLAB (The MathWorks, RRID:SCR_001622). Fast Fourier transforms were calculated using Welch's approximation method on Hanning windows to gather power spectra data from 0 to 120 Hz for each 4 s epoch. MUA was downsampled into 2 ms bins (500 Hz) before all analyses (no spikes were lost due to downsampling). To calculate OFF period measures for MUA (number of OFF periods per minute of NREM sleep, average duration of OFF periods, and percentage of time in NREM sleep spent OFF), each electrode was assigned an OFF period threshold in which all periods of silence equal to or longer than that threshold were counted as OFF periods. The OFF period threshold for an electrode was calculated by fitting the interspike intervals (ISIs) for an electrode to a gamma distribution using the MATLAB function “gamfit.” A number of ISIs equal to the number of ISIs used for fitting were drawn from this distribution and the 99th percentile for ISI length from this set of ISIs was the OFF period threshold. A close variation of this process was used in previously published work (Vyazovskiy et al., 2011). However, the current analysis was performed at the single electrode level, whereas previously (Vyazovskiy et al., 2011) OFF measures were calculated on MUA collapsed across several electrodes (for validation of the current method, see Results). We also performed OFF period analysis on spike data collapsed across all electrodes of an array for each mouse. This collapsed spike train was then treated as firing from a single electrode and the analysis was performed as above.
To calculate synchrony of ON periods between electrodes, contributing electrodes from each mouse were considered in groups. Each electrode from a mouse in turn was the “target” electrode, whereas all other electrodes from the same array were “other” electrodes (mice that contributed only one electrode were excluded from this analysis). ON periods were defined for each electrode as the entire time spent in NREM sleep that was not classified as an OFF period for that electrode (as defined above). The start of each ON period (i.e., the end of each OFF period) in the target electrode was the center of a time window of 48 ms. Other electrodes that also had ON periods starting within this 48 ms window were counted as “synchronous.” The proportion of other electrodes marked as synchronous provided a synchrony score for the beginning of each ON period in the target electrode. For example, if 4 of 4 other electrodes were synchronous, then the score for that ON period was 1. If only 1 of 4 other electrodes was synchronous, the score was instead 0.25. The total synchrony score for an electrode was the average of the synchrony score across all of the ON period onsets for a given time period. This process was repeated for the ends of the ON periods.
Histology and colocalization studies.
Mice were deeply anesthetized under 3% isoflurane and transcardially perfused with 0.9% saline, followed by 4% paraformaldehyde (PFA) in phosphate buffer. Brains were removed and placed in 4% PFA for at least 24 h and then sliced into 50-μm-thick sections on a vibratome, mounted onto glass slides, covered in Vectashield (Vector Laboratories, H-1000, RRID:AB_2336789) and imaged using a light microscope (Leica Microsystems, RRID:SCR_008960) to verify virus expression and electrode placement in the cortex. To estimate the percentage of cells infected by the virus, we injected four additional mice of the same strain, sex, and age as above with a nearly identical virus containing only EYFP (rAAV5-EF1a-DIO-EYFP; University of North Carolina, RRID:SCR_002448). After allowing ∼1 month for viral expression, mice were perfused and brains were sliced as above. A subset of slices was then selected for NeuN staining. Infection rate was estimated in the “main injection area,” which could be easily identified as the homogenous bright fluorescent area surrounding the injection. In all mice, this region spanned >1 mm rostrocaudally and corresponded to the area where the recording electrodes were located in implanted mice. To estimate the infection rate, we took 3 sections from each mouse within this area: 1 section that included the injection track, and 2 other sections located 0.5 mm rostral and 0.5 mm caudal to the central section. Sections were first left for 1 h in 10% normal goat serum (NGS; MP Biomedicals, catalog #08642921, RRID:AB_2335031) in 0.05 m PBS and then incubated in rabbit anti-NeuN overnight at room temperature (Millipore, ABN78, RRID:AB_10807945, 1:200 in PBS). The next day, sections were washed 5 times for 5 min each in PBS and then left in 10% NGS for 25 min. Next, sections were incubated in anti-rabbit Alexa Fluor 568 for 1 h at room temperature (Life Technologies, A11011, RRID:AB_2534078, 1:1000 in PBS), then washed again, mounted onto glass slides, and covered in Vectashield. One mouse was excluded due to faint viral expression. Within the remaining three mice, images from the main injection area of each section were taken using a confocal microscope (Olympus). Several (3–5) nonoverlapping image stacks (5–10 μm thick) were taken per section, depending on image quality and injection area, for a total of 39 stacks across the 3 mice. Images were analyzed with ImageJ using an algorithm that first collapsed stacks into a maximum projection and then automatically detected NeuN+ spots and marked them as regions of interest (ROIs). ROIs that contacted any of the four margins of the image were discarded because the mean EYFP fluorescence inside them could not be fully assessed. A fluorescence threshold was manually set after visual inspection and applied uniformly to all images. EYFP fluorescence was then measured across all ROIs. NeuN+ cells that contained an average EYFP fluorescence above threshold were counted as double-labeled (NeuN+ EYFP+) cells.
Results
We compared 2 experimental conditions associated with a similar sustained increase in cortical neuronal activity: 6 h of extended wake with exposure to novel objects and 6 h of optogenetic stimulation of cortical pyramidal neurons during sleep. Twenty adult male Camk2a-Cre mice were used in the study, all of which showed fairly widespread virus expression in the frontal cortex, limited to the right hemisphere, and had microwire arrays well placed within the expression area, as determined by histological examination (Fig. 1A). The arrays in the right frontal cortex each included 16 electrodes that are referred to as “ipsilateral” electrodes. These electrodes spanned the cortical area injected with the virus that was subjected to optogenetic stimulation. Electrodes placed in the left parietal cortex are referred to as “contralateral” electrodes (with neither viral expression nor optogenetic stimulation; Fig. 1B). The 16 ipsilateral electrodes were organized into 2 parallel rows of 8 that spanned 1.4 mm in the anteroposterior direction and 0.5 mm mediolaterally and their tips were located at the same cortical depth, mainly in layer 5 (Fig. 1B). The extent of virus infection was estimated in three other Camk2a-Cre mice, not used for the two main experiments, in which we counted how many cells in the main injected area expressed the neuronal nuclear marker NeuN and contained rAAV5-EF1a-DIO-EYFP (see Materials and Methods for details). This virus localizes throughout the cell, especially within the nucleus, and is almost identical to the one we used for the laser experiment, the expression of which is instead excluded from the nucleus (Yizhar et al., 2011). In the 3 animals, 62.7 ± 19.6% of NeuN+ cells were also EYFP+ (39 images, mean ± SD; Fig. 1C), suggesting that, within the main injection area, most excitatory neurons were infected.
Figure 1.
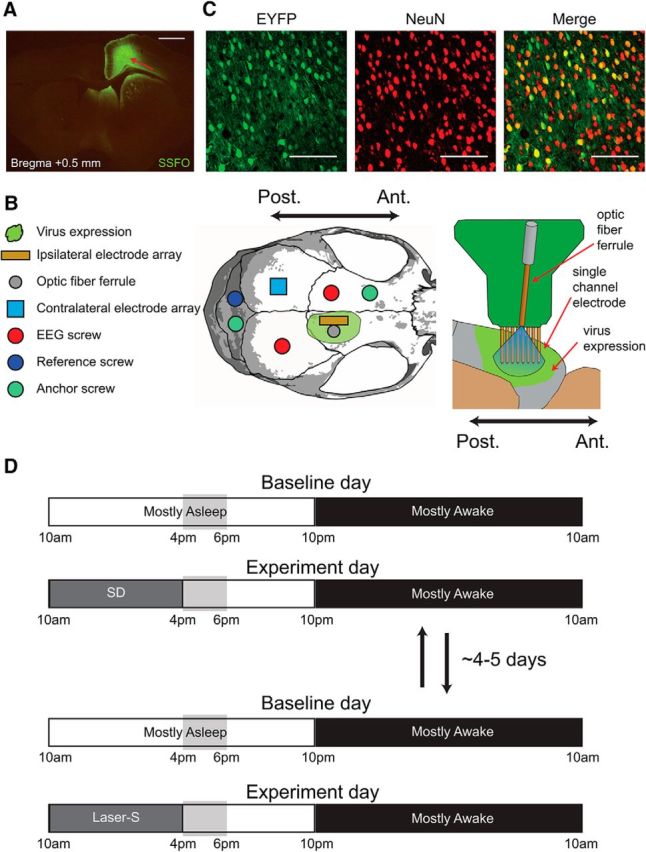
Experimental design. A, Representative example of virus expression in one mouse. Virus expression spread 2–3 mm in the anterior/posterior direction and remained within the right hemisphere. Red arrow denotes visible electrode tracks. Scale bar, 1 mm. B, Placement of electrodes and screws in reference to the virus expression, as well as details of the microwire electrode array with 16 electrodes, of which only one row of eight is shown. C, Example of EYFP (left) and NeuN (middle) expression in a confocal image taken near the injection site and combined overlay of both images (right). Scale bars, 100 μm. D, Experimental design. The two experiments (baseline + SD and baseline + laser-S) were spaced ∼4–5 d apart and their order was counterbalanced. Vertical gray boxes indicate the time window in which most of the analysis was done, corresponding to the first 2 h after sleep deprivation or laser-S and the same time of day during baseline (hours 7–8 of the light period).
In each mouse, 2 experiments were performed: sleep deprivation and laser stimulation during NREM sleep (laser-S), usually spaced ∼4–5 d apart and run in counterbalanced order. Both experiments lasted 2 d, with the first day being the baseline day in which mice were allowed to sleep undisturbed (Fig. 1D). On day 2, during the first 6 h of the light period, mice were either kept awake by exposure to novel objects (sleep deprivation) or allowed to sleep but received laser stimulation during NREM sleep (laser-S). Sleep that followed sleep deprivation or laser-S was analyzed starting at hour 7 of the light period and compared with the same time period of the preceding baseline day. Firing from all electrodes was manually inspected across both experimental days and only those electrodes that showed a stable signal across both days were selected for analysis. Most mice (13 of 20) contributed electrodes for both experimental conditions; in the remaining seven mice, data from only sleep deprivation or laser-S could be used due to decreased quality and stability of the recordings (see below). Overall, 16 mice contributed data for sleep deprivation and 17 mice contributed for laser-S. Three measures were used to assess the effects of sleep deprivation or laser-S: (1) the left frontal and right parietal EEG to detect broad changes in brain activity outside the virus expression/stimulated area; (2) LFP recordings from ipsilateral and contralateral electrodes; and (3) MUA from the same electrodes.
Sleep deprivation increases cortical firing and is followed by increases in SWA and time spent OFF during sleep
Sleep deprivation by novel objects reduced the total time spent asleep to <1% of the 6 h, with the few minutes of sleep spent in NREM sleep (data not shown). To obtain an overall estimate of neuronal activity during sleep deprivation, we focused on the ipsilateral electrodes, the same ones targeted by laser stimulation (n = 59, 16 mice), and, for each of them, we expressed the mean firing rate for hours 1–6 of the sleep deprivation day as a percentage of the corresponding firing rate during hours 1–6 of the baseline day. In most electrodes, neuronal activity during sleep deprivation increased relative to the same circadian time in baseline, when mice are mostly asleep. As a result, mean firing rate during sleep deprivation increased by 72.13 ± 47.49% (mean ± SD, 59 electrodes, 16 mice; Wilcoxon signed-rank test, p = 2.65 * 10−11; Fig. 2A). Not surprisingly, a similar increase was present in contralateral channels (data not shown).
Figure 2.
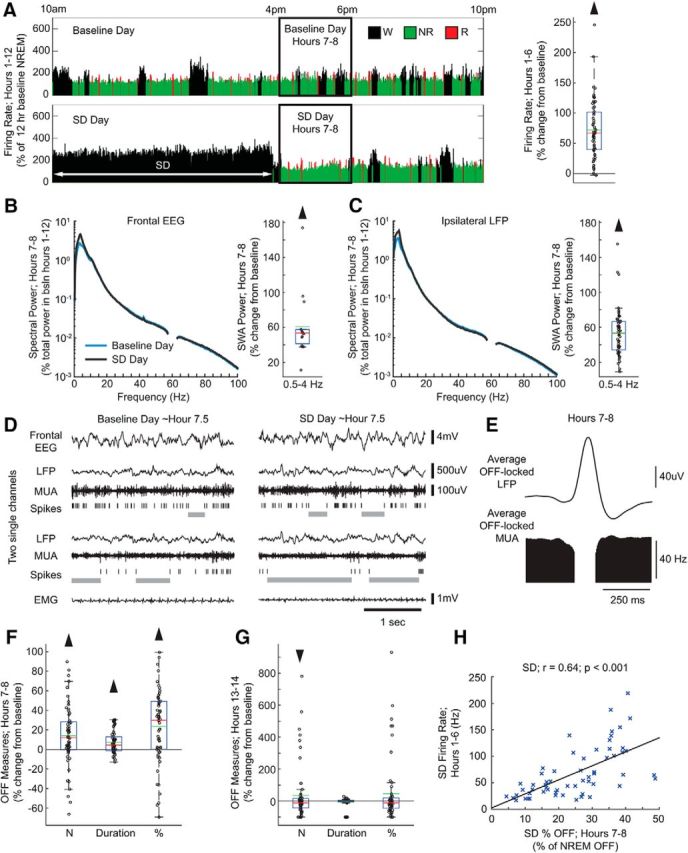
Sleep deprivation experiment. A, Left, Firing rate in a representative electrode during the light period of baseline and sleep deprivation days. Firing rate is plotted for each 4 s epoch and expressed as a percentage of hours 1–12 non-rapid eye movement (NREM) sleep average firing rate during the baseline day. Right, Firing rate for all electrodes during sleep deprivation hours 1–6 plotted as percentage change from the corresponding firing rate in baseline (59 electrodes, 16 mice). In this and the following box plots, red and green lines denote median and mean, respectively; the blue box extends from the 25th to 75th percentile, and the black whiskers extend to 2.7 SDs. B, Left, Mean spectrograms for frontal left EEG during hours 7–8 of the sleep deprivation day (as percentage of total spectral power during hours 1–12 of the baseline day) (15 electrodes, 15 mice; Wilcoxon signed-rank test, p = 6.10 * 10−5). Here and in C, frequencies from 57 to 63 Hz are not displayed due to an artifact from a notch filter used to suppress 60 Hz electrical noise. Right, Power in the slow-wave activity (SWA) band (0.5–4 Hz) in NREM sleep during hours 7–8 of the sleep deprivation day plotted as percentage change from the corresponding baseline value. C, Same as in B for ipsilateral (right) local field potentials (LFPs) (59 electrodes, 16 mice; Wilcoxon signed-rank test, p = 2.39 * 10−11). D, Representative example of electrophysiological measures at approximately hour 7.5 in the baseline day and sleep deprivation day. OFF periods are shown as gray bars under spike rasters. E, Average LFP waveform locked to all detected OFF periods from all electrodes in hours 7–8 of the sleep deprivation day. F, OFF period measures after sleep deprivation (hours 7–8) plotted as a percentage change from the corresponding baseline. Number of OFF periods is per minute of NREM sleep (59 electrodes, 16 mice; Wilcoxon signed-rank test, p = 0.0003). Duration is the average duration of all OFF periods (p = 0.0001). Percentage of time spent in OFF periods is expressed as a percentage of total time spent in NREM sleep (p = 4.44 * 10−5). G, Same as in F for the first 2 h of the dark period (hours 13–14) (59 electrodes, 16 mice; Wilcoxon signed-rank test; number: p = 0.03, duration: p = 0.52, percentage: p = 0.05). H, Correlation plot between firing rates during hours 1–6 of sleep deprivation day and percentage of NREM sleep time spent in OFF periods in hours 7–8 of the same day for all 59 electrodes. r, Pearson's rho. Black line is a least-squares fit (59 electrodes, 16 mice; linear correlation; r = 0.64 p = 4.72 * 10−8).
As expected, mice showed a sleep rebound when they were allowed to sleep. During the first 2 h after sleep deprivation, time spent in NREM sleep increased at the expense of wake (percentage of time spent in each state, hours 7–8 of baseline day vs hours 7–8 sleep deprivation day, mean ± SD; wake: 37.5 ± 9.5% vs 17.6 ± 7.9%, NREM: 52.1 ± 7.6% vs 71.8 ± 7.1%, REM: 10.4 ± 2.8% vs 10.5 ± 2.7%). SWA also increased at the beginning of the recovery period in both the left frontal EEG (Fig. 2B) and the right parietal EEG (percentage increase in sleep deprivation vs baseline; 15 electrodes, 15 mice; 32.3 ± 23.3%, mean ± SD; Wilcoxon signed-rank test, p = 6.10 * 10−5), and this increase was specific for the low EEG frequencies (Fig. 2B). A similar specific increase in SWA was seen in the LFPs from all ipsilateral electrodes (Fig. 2C). We then focused on measures of OFF periods (Fig. 2D). First, we tested whether OFF periods as identified at the single-electrode level corresponded to OFF periods as defined previously based on the positive peak of the LFP slow waves (negative peak of the scalp EEG slow waves) or on a preselected time of silence across all electrodes (Vyazovskiy et al., 2009). We found that this was the case. Specifically, we isolated single electrodes and examined the OFF-period-triggered average of LFP traces and found that single-electrode OFF periods aligned well with LFP positive peaks (Fig. 2E). Next, to measure changes in neuronal activity during recovery sleep, we calculated, for each ipsilateral electrode, the incidence of OFF periods (number/minute of NREM sleep), their average duration, as well as the percentage of time OFF (total time spent in OFF periods, expressed as percentage of total time in NREM sleep) in hours 7–8 of the sleep deprivation day, and compared these measures with the same circadian time in the baseline day (Fig. 2D). Time spent in OFF periods increased in the first 2 h after sleep deprivation relative to the same circadian time in baseline due to an increase in both number and duration of OFF periods (Fig. 2F); all changes had returned to baseline levels or lower by the first 2 h of the dark period (Fig. 2G). Moreover, time spent OFF in the first 2 h after sleep deprivation was correlated with mean firing rates during the 6 h of extended wake (Fig. 2H). Therefore, after sustained high firing in wake for 6 h, neurons spent more time OFF, a change that was reversible in a few hours. This change was detectable at the level of individual electrodes. We also calculated OFF period measures after collapsing all electrodes within each mouse and treating the collapsed MUA as a single MUA trace, similar to previous work (Vyazovskiy et al., 2009). Results were similar: number and duration of OFF periods, as well as percentage of time spent OFF, increased significantly in hours 7–8 after sleep deprivation relative to baseline (16 mice; mean ± SD, Wilcoxon signed-rank test, N: +10.1 ± 17.9%; p = 0.03; duration: +7.3 ± 9.2%; p = 0.008; percentage OFF: +18.8 ± 24.5%; p = 0.009). As reported previously in rats (Vyazovskiy et al., 2009), firing rate during the ON periods also increased in the first 2 h after sleep deprivation relative to baseline (+7.2 ± 11.9%; Wilcoxon signed-rank test, p = 6.74 * 10−5).
Laser stimulation during sleep increases local cortical firing without causing arousal and is followed by a decrease in SWA and no changes in time spent OFF during sleep
The goal of the laser-S experiment was to force neurons in a small cortical area to fire during NREM sleep at levels comparable to those reached during sleep deprivation, but without waking up the mice. Because high firing had to be maintained for several hours, an SSFO was used, which introduces a steady cationic current into neurons and thus increases their overall excitability (Yizhar et al., 2011). An advantage of SSFOs is that affected neurons are more likely to still fire in their natural patterns, albeit at a higher rate, making the increased activity more physiologically relevant compared with repeated electrical stimulation or acute optogenetic stimulation using opsins with fast kinetics (Yizhar et al., 2011). Brief laser pulses (mostly ∼2 s at ∼1 mW) were delivered only during NREM sleep, on average every 5 min, for a total of ∼60 pulses during hours 1–6 of the laser-S day. During this time, the percentage of wake, NREM sleep, and REM sleep did not differ from baseline (Fig. 3A). The average duration of sleep and wake episodes, as well as number of brief awakenings (wake bouts of ≤16 s), also did not change between hours 1–6 of the baseline and laser-S days (Fig. 3A). SWA during NREM sleep showed a small but significant decrease in the ipsilateral (right) parietal EEG (percentage change in laser-S vs baseline = −7.4 ± 9.8%; Wilcoxon signed-rank test, p = 0.007) and the contralateral (left) frontal EEG (Fig. 3B), whereas gamma power (30–55 Hz) was increased significantly in the frontal EEG only (Fig. 3B). In contrast to the small changes in global measures of sleep, laser stimulation clearly affected LFP spectral power and neuronal activity at the local level. As mentioned, we estimated that ∼63% of neurons were infected with the virus in the main injected area and, because of the especially low power required for SSFO activation (Yizhar et al., 2011) and the fact that our laser light was focused on this area, we assume that most of them were activated. However, due to the complex nature of light diffusion within the cortex, we cannot estimate the total number of neurons activated by laser stimulation nor can we be sure that all infected neurons were activated to the same extent. Indeed, the effects of the optogenetic stimulation varied across electrodes, either because of variable levels of virus expression and/or because of changes in light intensity at the different electrode sites. Therefore, some electrodes were strong responders, showing a sustained increase in firing across the 6 h, whereas others showed weak or no responses or even a decrease in firing during laser stimulation (Fig. 3C). When all ipsilateral electrodes were considered together (n = 66, 15 mice) across the entire 6 h, including both sleep and wake, there was an overall significant increase in mean firing rate of 53.6 ± 57.8% relative to baseline (percentage change hours 1–6 laser-S vs hours 1–6 baseline, mean ± SD; Wilcoxon signed-rank test, p = 8.82 * 10−10). This increase, however, was significantly smaller than the increase seen during sleep deprivation. Because matching the two experimental conditions (sleep deprivation and laser-S) by overall increase in firing rate was key to the goal of the study, we then selected, among all ipsilateral electrodes (n = 66), only those with a laser-induced increase in firing rate that was within the mean ± SD observed during sleep deprivation (72.1 ± 47.5%). This selection resulted in 32 sleep-deprivation-matched electrodes, with an overall increase in mean firing rate of 66.1 ± 28.3% (Fig. 3D). During baseline, sleep-deprivation-matched electrodes did not show any obvious difference relative to the remaining ipsilateral electrodes: for instance, during hours 1–6 of the baseline day, their mean firing rates and SWA power in NREM sleep varied within the same range as the other electrodes (data not shown). During laser stimulation, firing in these sleep-deprivation-matched responders was wake-like with little evidence of bi-stability and, during the 6 h of laser stimulation, the incidence of OFF periods during NREM sleep decreased by ∼90% and the few remaining OFF periods were shorter, resulting in an almost complete lack of time OFF (Fig. 3E). Sleep-deprivation-matched electrodes also showed a noticeable shift in LFP power throughout the entire duration of the experiment, including an ∼30% decrease in SWA and an ∼100% increase in gamma power (Fig. 3F). There was no correlation between changes in SWA and gamma power during the 6 h of laser stimulation and both changes were also visible in raw spectrograms in which LFP power was not normalized by the total power during baseline. During the 6 h of laser stimulation, contralateral channels showed no significant changes in firing rate (3.0 ± 15.8%, mean ± SD; Wilcoxon signed-rank test, p = 0.36), OFF measures (% OFF: 9.2 ± 26.1%, p = 0.30), or LFP SWA power (1.1 ± 6.4%, p = 0.50) relative to baseline.
Figure 3.
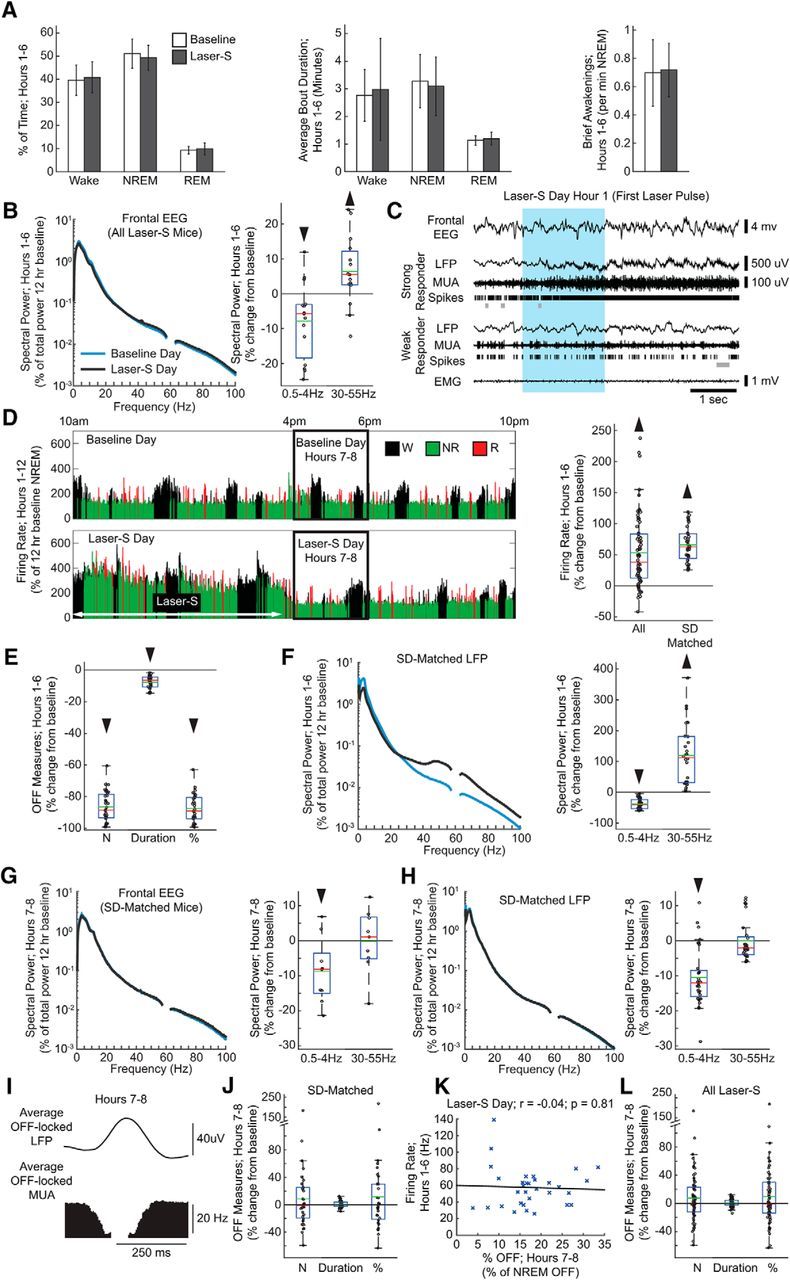
Laser-S experiment. A, Left, Percentage of time spent in wake, NREM sleep, and rapid eye movement (REM) sleep in hours 1–6 (17 mice; Wilcoxon signed-rank test; wake: p = 0.55, NREM: p = 0.24, REM: p = 0.28). Middle, Average bout duration for wake and sleep in hours 1–6 (Wilcoxon signed-rank test; wake: p = 0.55, NREM: p = 0.49, REM: p = 0.08). Right, Number of brief awakenings (wake bouts ≤16 s) per minute of NREM sleep in hours 1–6 (Wilcoxon signed-rank test; p = 0.69). Error bars indicate SD. B, Left, Mean spectrogram for frontal left EEG in hours 1–6 (percentage of total spectral power during hours 1–12 of the baseline day). Here and in other panels, frequencies from 57 to 63 Hz are not displayed due to an artifact from a notch filter used to suppress 60 Hz electrical noise. Right, Power in SWA (0.5–4 Hz) and gamma (30–55 Hz) bands for each frontal EEG in laser-S day plotted as percentage change from the baseline day (15 electrodes, 15 mice; Wilcoxon signed-rank test; SWA: p = 0.02, gamma: p = 0.03). In this and the following box plots, red and green lines denote the median and the mean, respectively; the blue box extends from the 25th to 75th percentile, and the black whiskers extend to 2.7 SDs. C, Representative example of electrophysiological measures in strong and weak responding electrodes at onset of laser stimulation. OFF periods are shown as gray bars under spike rasters. The blue box denotes the duration of a blue laser pulse. D, Left, Firing rate in a representative strong responding electrode during the light period of the baseline and laser-S days. Firing rate is plotted for each 4 s epoch, and expressed as a percentage of hours 1–12 NREM sleep average firing rate during the baseline day. Right, Firing rate for all electrodes and sleep-deprivation-matched electrodes during laser-S hours 1–6 plotted as a percentage change from the corresponding firing rate in baseline (Wilcoxon signed-rank test; all: n = 66, p = 8.82 * 10−10, sleep-deprivation-matched: n = 32, p = 7.95 * 10−7). E, OFF period measures during hours 1–6 of laser-S for sleep-deprivation-matched electrodes. Percentage change in laser-S from the baseline day is plotted for each OFF measure. Number of OFF periods is per minute of NREM sleep (32 electrodes, 11 mice; Wilcoxon signed-rank test, p = 7.95 * 10−7). Duration is the average duration of all OFF periods (p = 7.95 * 10−7). Percentage of time spent in OFF periods is expressed as a percentage of total time spent in NREM sleep (p = 7.95 * 10−7). F, Left, Mean spectrogram for the LFPs of sleep-deprivation-matched electrodes during hours 1–6 (percentage of total spectral power during hours 1–12 of the baseline day) (32 electrodes, 11 mice; Wilcoxon signed-rank test; delta: p = 7.95 * 10−7, gamma: p = 7.95 * 10−7). Right, Power in SWA and gamma bands for the laser-S day plotted as percentage change from the baseline. Note that the spectrograms shown are all scaled uniformly 0–100 Hz by a single value, the total power across all frequency bins in the baseline day hours 1–12. G, Left, Mean spectrograms for frontal EEG during hours 7–8 of the laser-S day (percentage of total spectral power during hours 1–12 of the baseline day). Right, Power in the SWA and gamma bands plotted as percentage change from the baseline (9 electrodes, 9 mice; Wilcoxon signed-rank test, delta: p = 0.03 gamma: p = 0.91). H, Same as in G for the LFPs of sleep-deprivation-matched electrodes (32 electrodes, 11 mice; Wilcoxon signed-rank test; SWA: p = 6.59 * 10−7, gamma: p = 0.24). I, Average LFP waveform in sleep-deprivation-matched electrodes locked to all detected OFF from all electrodes in hours 7–8 of the laser-S day. J, OFF period measures in sleep-deprivation-matched electrodes after laser-S (hours 7–8) plotted as a percentage change from the corresponding baseline. Number of OFF periods is per minute of NREM sleep (32 electrodes, 11 mice; Wilcoxon signed-rank test, p = 0.68). Duration is the average duration of all OFF periods (p = 0.91). Percentage of time spent in OFF periods is expressed as a percentage of total time spent in NREM sleep (p = 0.55). K, Correlation plot between firing rates during hours 1–6 of laser-S day and percentage of time spent in OFF periods in hours 7–8 for sleep-deprivation-matched electrodes. r, Pearson's rho. Black line is a least-squares fit (59 electrodes, 16 mice; Linear correlation; r = −0.04 p = 0.81). L, Same as in J for all ipsilateral electrodes in laser-S (66 electrodes, 17 mice; Wilcoxon signed-rank test; number: p = 0.34, duration: p = 0.19, percentage: p = 0.28).
During the first 2 h after laser-S (hours 7–8), SWA was slightly decreased in both left frontal EEG (Fig. 3G) and right parietal EEG (data not shown) compared with baseline. The LFPs of the sleep-deprivation-matched channels no longer had elevated gamma power, but still showed a significant decline in SWA relative to baseline, albeit smaller than during stimulation (Fig. 3H). As before, we found that OFF periods were well correlated with positive LFP peaks (Fig. 3I). However, in sleep-deprivation-matched electrodes, none of the OFF measures changed significantly in the first 2 h after laser-S (Fig. 3J) or later (data not shown). Moreover, time spent OFF in the first 2 h after laser stimulation did not correlate with mean firing rates during the 6 h of optogenetic stimulation (Fig. 3K). OFF measures also did not change if all ipsilateral electrodes were considered (Fig. 3L). Electrodes placed in the contralateral parietal cortex, which received neither light exposure nor virus injection, showed no change in firing rate during laser-S (3.0 ± 15.8%, mean ± SD; Wilcoxon signed-rank test, p = 0.36) and no changes in OFF periods after laser stimulation (data not shown). These results were confirmed when calculating OFF period measures after collapsing across all electrodes for each mouse (sleep-deprivation-matched electrodes, 11 mice; mean ± SD, Wilcoxon signed-rank test; number: 12.6 ± 45.4%, p = 0.76; duration: 1.3 ± 4.6%, p = 0.70; percentage time OFF: 16.0 ± 53.4, p = 0.64). In contrast to the recovery sleep after sleep deprivation, after laser stimulation, mean firing rates during the ON periods in hours 7–8 showed no change relative to baseline in sleep-deprivation-matched electrodes (−1.9 ± 14.4%; p = 0.21).
Cortical synchrony increases after sleep deprivation but not after laser stimulation
Next, we looked at the effects of sleep deprivation and laser-S on neuronal coupling by measuring the extent to which the onset and offset of ON periods in each electrode were locked to those in the other electrodes of the same array (Fig. 4A; see Materials and Methods for details). Consistent with previous work in rats (Vyazovskiy et al., 2009), neurons were significantly more likely to start and end their ON periods synchronously in the first 2 h of recovery sleep after sleep deprivation (Fig. 4B; ON starts, 48 ms window; 55 electrodes, 12 mice; 23.9 ± 31.8%, mean ± SD; Wilcoxon signed-rank test, p = 1.72 * 10−6) and these results were robust across a series of time windows used to define synchronicity from 48 to 148 ms. Moreover, SWA and synchrony measures were correlated (Fig. 4C). In contrast, no increase in synchrony measures was seen after laser stimulation. In fact, the onset of the ON periods was significantly less synchronous across sleep-deprivation-matched electrodes (30 electrodes, 9 mice; −2.5 ± 25.8%, mean ± SD; Wilcoxon signed-rank test, p = 0.03) and both onsets and offsets showed less synchrony when calculated across all ipsilateral electrodes (Fig. 4D; 63 electrodes, 14 mice; 0.6 ± 25.6%, mean ± SD; Wilcoxon signed-rank test, p = 0.001). Therefore, both SWA and synchrony measures decreased after optogenetic stimulation, but they were not correlated (Fig. 4E). No changes were present in the contralateral electrodes (Fig. 4F). The results again were confirmed using different time windows (100 and 148 ms; data not shown).
Figure 4.
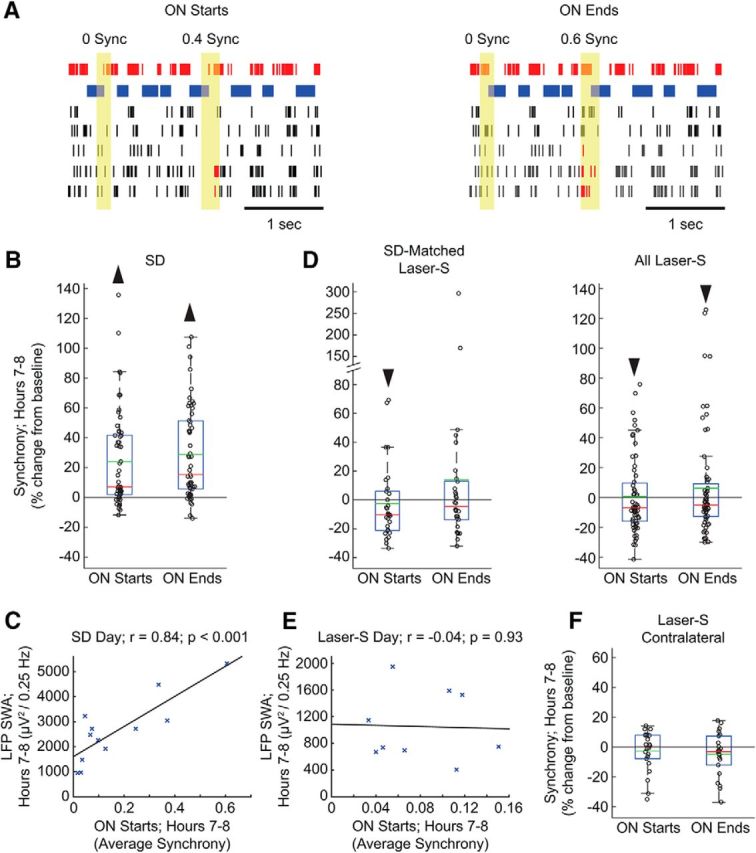
Changes in ON period synchrony after sleep deprivation and laser stimulation. A, Examples of synchrony measurements across the onset and offset of ON periods. The top electrode is the one being evaluated (the target electrode), with ON periods (spikes) shown in red and OFF periods shown in blue. In the other five electrodes of the same array, spikes are shown in black, except when a corresponding ON period starts or ends in synchrony with the target electrode, in which case spikes are shown in red. Synchrony was measured within a window of 48 ms centered over the beginning and ending of the ON periods of the target electrode (yellow area). For better visualization, the size of this window is not drawn to scale. Note that only the start and end of ON periods count as possible synchrony events and that shorter silences within an ON period that do not pass the OFF period threshold are not ON period boundaries. B, Synchrony measures in hours 7–8 after sleep deprivation shown for each electrode as a percentage of the synchrony in the baseline day hours 7–8 (55 electrodes, 12 mice; Wilcoxon signed-rank test; ON starts: p = 1.72 * 10−6, ON ends: p = 6.51 * 10−8). In the box plots, data points are shown as black circles, red and green lines denote the median and the mean, respectively; the blue box extends from the 25th to 75th percentile, and the black whiskers extend to 2.7 SDs from the mean. C, Correlation plot between average LFP SWA and average synchrony for start of ON periods in hours 7–8 of the sleep deprivation day for all 12 mice used for synchrony analysis. r, Pearson's rho. Black line is a least-squares fit (12 mice; Linear correlation; r = −0.84 p = 0.0006). D, Same as in B for laser-S electrode subsets (sleep-deprivation-matched: 30 electrodes, 9 mice; Wilcoxon signed-rank test; ON starts: p = 0.03, ON ends: p = 0.37; all laser-S: 63 electrodes, 14 mice; Wilcoxon signed-rank test; ON starts: p = 0.001, ON ends: p = 0.04). E, Correlation plot between average LFP SWA and average synchrony for start of ON periods in hours 7–8 of the laser-S day (9 mice; linear correlation; r = −0.04 p = 0.93). F, Same as in B for contralateral laser-S electrodes (22 electrodes, 5 mice; Wilcoxon signed-rank test; ON starts: p = 0.66, ON ends: p = 0.12).
Discussion
Changes in SWA and cortical synchrony after sleep deprivation
We measured sleep SWA, OFF measures, and cortical synchrony after extended wake with exposure to novel objects and after optogenetic cortical stimulation during NREM sleep. Both experimental conditions induced a comparable, sustained (6 h) increase in mean cortical firing (∼70% relative to baseline). As expected, the increase in firing rate was widespread in both left and right cortex during sleep deprivation and was restricted to the targeted area during laser stimulation. The results show that sustained high firing induced by exposure to novel objects during wake was followed, during subsequent sleep, by an increase in SWA, cortical neuronal synchrony, and the number and duration of OFF periods. Moreover, the increase in SWA was correlated with both neuronal synchrony and time spent OFF. These findings are fully consistent with the results observed in the rat cortex (Vyazovskiy et al., 2009), confirming in two rodent species that homeostatic changes in SWA due to sleep deprivation are linked to changes in both cortical synchrony and OFF periods measures. Based on previous studies, we hypothesize that increased synchrony in the transition into ON and OFF periods is a reflection of increased neuronal coupling due to net synaptic potentiation occurring during prior wake (Vyazovskiy et al., 2009, Tononi and Cirelli, 2014).
Changes in SWA and cortical synchrony after optogenetic stimulation during sleep
After laser stimulation, high firing was confined to the main injection area, where we estimate that ∼63% of neurons were infected by the virus. In the same area, and only during laser stimulation, we also found an increase in gamma power (Fig. 3), which has been observed frequently as a result of inhibitory firing (Whittington et al., 2011, Buzsáki and Wang, 2012). Therefore, although our stimulation targeted excitatory cells, it also most likely led to increased compensatory firing of fast spiking inhibitory interneurons recruited to maintain the balance between excitation and inhibition.
None of the effects observed after sleep deprivation was observed after sustained firing induced by optogenetic stimulation during sleep: SWA and cortical synchrony decreased, the number and duration of OFF periods did not change, and SWA was not correlated with cortical synchrony and time spent OFF. Therefore, a wake-like, tonic increase in firing comparable to that observed during active exploration, but produced by optogenetic activation during sleep, fails to trigger homeostatic changes in subsequent SWA and associated neural signatures. In fact, SWA and neural synchrony not only failed to increase, but declined significantly. Just as wake leads to a net increase in synaptic strength, presumably because of a neuromodulatory milieu that favors learning through synaptic potentiation, NREM sleep leads to a net decrease in synaptic strength, presumably through a neuromodulatory milieu that favors synaptic depression (Harley, 1991, Seol et al., 2007). It has been hypothesized that, at least in mammalian cortex, this sleep-dependent down-selection of synaptic strength would be activity dependent (Tononi and Cirelli, 2014). Therefore, we speculate that increased firing induced by optogenetic stimulation during sleep may have promoted additional synaptic depression, thereby explaining the decline in SWA and neuronal synchrony. In pilot experiments, optogenetic stimulation for several hours during wake, in conjunction with active exploration, often resulted in seizures or cortical spreading depression and prevented the analysis of subsequent sleep.
Mechanisms underlying the decline in SWA after optogenetic stimulation during sleep
In general, the synchrony of neuronal firing is strongly correlated with the amplitude of EEG signals (Musall et al., 2014). Because the effects of extended wake are global, they are expected to be similar, and thus correlated, at every scale: from the synchrony of firing of the few units near the recording tip to the amplitude of the local LFP, reflecting the input (mainly postsynaptic potentials) from thousands of neurons surrounding the recording electrode (Buzsáki et al., 2012), to the overall EEG. Indeed, extended wake increased both SWA and synchrony measures in a correlated manner and the increase in SWA was also observed in the contralateral hemisphere, with no statistical differences between left and right cortex (Fig. 2B,C). In contrast, optogenetic stimulation primarily affects neurons locally, which may lead to complex interactions between direct local effects on firing synchrony and indirect effects on inputs from neighboring regions. This may account for the observation that, after optogenetic stimulation, both SWA and synchrony measures declined, but not in a correlated manner. Moreover, the decline in SWA was significantly larger ipsilaterally than contralaterally (Fig. 3G,H).
Changes in intrinsic excitability might also contribute to the decline of SWA after optogenetic stimulation. For instance, the noninactivating hyperpolarization-activated cation current Ih plays a crucial role in the generation of the slow oscillation (McCormick and Bal, 1997, Blethyn et al., 2006). In the hippocampus, Ih is decreased by stimulation paradigms that induce LTD and increased by LTP (Fan et al., 2005, Brager and Johnston, 2007), but only in association with strong firing (theta bursts but not tetanus, which elicits few action potentials). However, whereas long-lasting homeostatic changes in intrinsic excitability mediated by Ih (Fan et al., 2005) might affect SWA after optogenetic stimulation, they cannot easily account for the associated decline of neuronal synchrony.
Several recent studies have shown that increased activation of specific cortical areas during wake results in a local increase in SWA during subsequent sleep, but in most cases, it is not straightforward to tease apart the role of neuronal activity from that of synaptic plasticity (for review, see Hanlon et al., 2011). However, a few studies contrasted conditions providing similar amounts of wake stimulation (activity) with or without a learning component (plasticity). In humans, SWA increased over right parietal cortex after a visuomotor task requiring learning compared with a kinematically identical task that did not require learning (Huber et al., 2004, Landsness et al., 2009). Similar results have been obtained using a reaching task in rodents and comparing the training and the posttraining phase (Hanlon et al., 2009), indicating that changes in SWA reflect the effects of synaptic plasticity above and beyond any effect of neuronal activity. Finally, a study in humans used transcranial paired-associative stimulation in wake to deliver the same number of paired stimuli, but at time intervals meant to induce spike-timing-dependent synaptic potentiation or depression, respectively (Huber et al., 2008). The potentiation paradigm locally increased SWA during subsequent sleep, whereas the depression paradigm decreased it, suggesting that changes in SWA are driven primarily by changes in synaptic plasticity, which is consistent with the present results.
Conclusions
In summary, our findings demonstrate that sustained neuronal activation induced by active exploration in wake leads to an increase in SWA, neuronal synchrony, and neuronal OFF periods during subsequent sleep, which is consistent with the expected consequences of a net increase in synaptic strength in cortical circuits (Tononi and Cirelli, 2014). In contrast, a comparable, wake-like local increase in neuronal activity obtained by optogenetic stimulation during sleep was followed by a local decrease in SWA and neuronal synchrony, with no change in OFF periods. Therefore, the increase in SWA and OFF periods after extended wake is unlikely to result from neuronal fatigue induced by excessive firing as such. Instead, it appears that neuronal activation leads to homeostatic changes in sleep SWA only if it occurs in the neuromodulatory, metabolic, and neurochemical milieu of active wake, which influences multiple cellular functions including the ionic balance of interstitial spaces (Ding et al., 2016) and favors learning through synaptic potentiation (Tononi and Cirelli, 2014, de Vivo et al., 2016). Indeed, in previous studies, we found that rats in which cortical noradrenergic levels had been depleted using chronic lesions of the locus ceruleus did not show the expected cortical induction of plasticity-related genes during wake, and had a blunted SWA response during subsequent sleep (Cirelli et al., 1996, Cirelli and Tononi, 2000, 2004, Cirelli et al., 2005). In the current study, the tone of the noradrenergic and other neuromodulatory systems was low because the mice were asleep, so laser-induced high firing occurred in a state that as a whole is not conducive to synaptic potentiation (Leonard et al., 1987, Bramham and Srebro, 1989). We cannot rule out, however, that laser stimulation also caused neurons to fire in a random pattern uncoupled from wake behavior and physiological sensory inputs. Although this may have contributed to the observed decrease in SWA after optogenetic stimulation, SSFO was chosen specifically to increase neuronal excitability while preserving as much as possible the endogenous pattern of firing. Finally, a recent study found that even sleep-like slow waves occurring during wake due to systemic atropine injections can lead to an increase in NREM sleep duration as long as subcortical areas are activated and the experimental animals are actively behaving (Qiu et al., 2015). This possibility should be tested further by experiments aimed at decoupling the effects of neuronal activity and plasticity during wake.
Footnotes
This work was supported by the National Institutes of Health (Grant 1R01MH091326 to G.T. and Grants 1R01MH099231 and 1P01NS083514 to G.T. and C.C.). We thank Dr. Ofer Yizhar (Weizmann Institute of Science, Rehovot, Israel) for valuable input regarding the use of SSFO. G.T. is involved in a research study in humans supported by Philips Respironics. This study is not related to the work presented in the current manuscript. The remaining authors declare no competing financial interests.
References
- Bellesi M, de Vivo L, Tononi G, Cirelli C. Effects of sleep and wake on astrocytes: clues from molecular and ultrastructural studies. BMC Biol. 2015;13:66. doi: 10.1186/s12915-015-0176-7. [DOI] [PMC free article] [PubMed] [Google Scholar]
- Benington JH, Heller HC. Restoration of brain energy metabolism as the function of sleep. Prog Neurobiol. 1995;45:347–360. doi: 10.1016/0301-0082(94)00057-O. [DOI] [PubMed] [Google Scholar]
- Blethyn KL, Hughes SW, Tóth TI, Cope DW, Crunelli V. Neuronal basis of the slow (<1 Hz) oscillation in neurons of the nucleus reticularis thalami in vitro. J Neurosci. 2006;26:2474–2486. doi: 10.1523/JNEUROSCI.3607-05.2006. [DOI] [PMC free article] [PubMed] [Google Scholar]
- Borbély AA. A two process model of sleep regulation. Hum Neurobiol. 1982;1:195–204. [PubMed] [Google Scholar]
- Borbély AA, Baumann F, Brandeis D, Strauch I, Lehmann D. Sleep deprivation: effect on sleep stages and EEG power density in man. Electroencephalogr Clin Neurophysiol. 1981;51:483–495. doi: 10.1016/0013-4694(81)90225-X. [DOI] [PubMed] [Google Scholar]
- Borbély AA, Daan S, Wirz-Justice A, Deboer T. The two-process model of sleep regulation: a reappraisal. J Sleep Res. 2016;25:131–143. doi: 10.1111/jsr.12371. [DOI] [PubMed] [Google Scholar]
- Brager DH, Johnston D. Plasticity of intrinsic excitability during long-term depression is mediated through mGluR-dependent changes in I(h) in hippocampal CA1 pyramidal neurons. J Neurosci. 2007;27:13926–13937. doi: 10.1523/JNEUROSCI.3520-07.2007. [DOI] [PMC free article] [PubMed] [Google Scholar]
- Brambilla D, Chapman D, Greene R. Adenosine mediation of presynaptic feedback inhibition of glutamate release. Neuron. 2005;46:275–283. doi: 10.1016/j.neuron.2005.03.016. [DOI] [PubMed] [Google Scholar]
- Bramham CR, Srebro B. Synaptic plasticity in the hippocampus is modulated by behavioral state. Brain Res. 1989;493:74–86. doi: 10.1016/0006-8993(89)91001-9. [DOI] [PubMed] [Google Scholar]
- Brundege JM, Dunwiddie TV. Metabolic regulation of endogenous adenosine release from single neurons. Neuroreport. 1998;9:3007–3011. doi: 10.1097/00001756-199809140-00016. [DOI] [PubMed] [Google Scholar]
- Buzsáki G, Wang XJ. Mechanisms of gamma oscillations. Annu Rev Neurosci. 2012;35:203–225. doi: 10.1146/annurev-neuro-062111-150444. [DOI] [PMC free article] [PubMed] [Google Scholar]
- Buzsáki G, Anastassiou CA, Koch C. The origin of extracellular fields and currents: EEG, ECoG, LFP and spikes. Nat Rev Neurosci. 2012;13:407–420. doi: 10.1038/nrn3241. [DOI] [PMC free article] [PubMed] [Google Scholar]
- Chauvette S, Crochet S, Volgushev M, Timofeev I. Properties of slow oscillation during slow-wave sleep and anesthesia in cats. J Neurosci. 2011;31:14998–15008. doi: 10.1523/JNEUROSCI.2339-11.2011. [DOI] [PMC free article] [PubMed] [Google Scholar]
- Cirelli C, Tononi G. Differential expression of plasticity-related genes in waking and sleep and their regulation by the noradrenergic system. J Neurosci. 2000;20:9187–9194. doi: 10.1523/JNEUROSCI.20-24-09187.2000. [DOI] [PMC free article] [PubMed] [Google Scholar]
- Cirelli C, Tononi G. Locus ceruleus control of state-dependent gene expression. J Neurosci. 2004;24:5410–5419. doi: 10.1523/JNEUROSCI.0949-04.2004. [DOI] [PMC free article] [PubMed] [Google Scholar]
- Cirelli C, Pompeiano M, Tononi G. Neuronal gene expression in the waking state: a role for the locus coeruleus. Science. 1996;274:1211–1215. doi: 10.1126/science.274.5290.1211. [DOI] [PubMed] [Google Scholar]
- Cirelli C, Gutierrez CM, Tononi G. Extensive and divergent effects of sleep and wakefulness on brain gene expression. Neuron. 2004;41:35–43. doi: 10.1016/S0896-6273(03)00814-6. [DOI] [PubMed] [Google Scholar]
- Cirelli C, Huber R, Gopalakrishnan A, Southard TL, Tononi G. Locus ceruleus control of slow-wave homeostasis. J Neurosci. 2005;25:4503–4511. doi: 10.1523/JNEUROSCI.4845-04.2005. [DOI] [PMC free article] [PubMed] [Google Scholar]
- Dalsgaard MK, Secher NH. The brain at work: a cerebral metabolic manifestation of central fatigue? J Neurosci Res. 2007;85:3334–3339. doi: 10.1002/jnr.21274. [DOI] [PubMed] [Google Scholar]
- de Vivo L, Bellesi M, Marshall W, Bushong EA, Ellisman MH, Tononi G, Cirelli C. Ultrastructural evidence for synaptic scaling across the wake/sleep cycle. Science. 2016 doi: 10.1126/science.aah5982. In press. [DOI] [PMC free article] [PubMed] [Google Scholar]
- Ding F, O'Donnell J, Xu Q, Kang N, Goldman N, Nedergaard M. Changes in the composition of brain interstitial ions control the sleep-wake cycle. Science. 2016;352:550–555. doi: 10.1126/science.aad4821. [DOI] [PMC free article] [PubMed] [Google Scholar]
- Esser SK, Hill SL, Tononi G. Sleep homeostasis and cortical synchronization: I. Modeling the effects of synaptic strength on sleep slow waves. Sleep. 2007;30:1617–1630. doi: 10.1093/sleep/30.12.1617. [DOI] [PMC free article] [PubMed] [Google Scholar]
- Fan Y, Fricker D, Brager DH, Chen X, Lu HC, Chitwood RA, Johnston D. Activity-dependent decrease of excitability in rat hippocampal neurons through increases in I(h) Nat Neurosci. 2005;8:1542–1551. doi: 10.1038/nn1568. [DOI] [PubMed] [Google Scholar]
- Feinberg I, March JD, Fein G, Floyd TC, Walker JM, Price L. Period and amplitude analysis of 0.5–3 c/sec activity in NREM sleep of young adults. Electroencephalogr Clin Neurophysiol. 1978;44:202–213. doi: 10.1016/0013-4694(78)90266-3. [DOI] [PubMed] [Google Scholar]
- Franken P, Malafosse A, Tafti M. Genetic determinants of sleep regulation in inbred mice. Sleep. 1999;22:155–169. [PubMed] [Google Scholar]
- Grill WM. Signal considerations for chronically implanted electrodes for brain interfacing. In: Reichert WM, editor. Indwelling neural implants: strategies for contending with the in vivo environment. Boca Raton, FL: CRC; 2008. pp. 41–62. [PubMed] [Google Scholar]
- Hanlon EC, Faraguna U, Vyazovskiy VV, Tononi G, Cirelli C. Effects of skilled training on sleep slow wave activity and cortical gene expression in the rat. Sleep. 2009;32:719–729. doi: 10.1093/sleep/32.6.719. [DOI] [PMC free article] [PubMed] [Google Scholar]
- Hanlon EC, Vyazovskiy VV, Faraguna U, Tononi G, Cirelli C. Synaptic potentiation and sleep need: clues from molecular and electrophysiological studies. Curr Top Med Chem. 2011;11:2472–2482. doi: 10.2174/156802611797470312. [DOI] [PubMed] [Google Scholar]
- Harley C. Noradrenergic and locus coeruleus modulation of the perforant path-evoked potential in rat dentate gyrus supports a role for the locus coeruleus in attentional and memorial processes. Prog Brain Res. 1991;88:307–321. doi: 10.1016/S0079-6123(08)63818-2. [DOI] [PubMed] [Google Scholar]
- Huber R, Deboer T, Tobler I. Effects of sleep deprivation on sleep and sleep EEG in three mouse strains: empirical data and simulations. Brain Res. 2000;857:8–19. doi: 10.1016/S0006-8993(99)02248-9. [DOI] [PubMed] [Google Scholar]
- Huber R, Ghilardi MF, Massimini M, Tononi G. Local sleep and learning. Nature. 2004;430:78–81. doi: 10.1038/nature02663. [DOI] [PubMed] [Google Scholar]
- Huber R, Määttä S, Esser SK, Sarasso S, Ferrarelli F, Watson A, Ferreri F, Peterson MJ, Tononi G. Measures of cortical plasticity after transcranial paired associative stimulation predict changes in electroencephalogram slow-wave activity during subsequent sleep. J Neurosci. 2008;28:7911–7918. doi: 10.1523/JNEUROSCI.1636-08.2008. [DOI] [PMC free article] [PubMed] [Google Scholar]
- Landsness EC, Crupi D, Hulse BK, Peterson MJ, Huber R, Ansari H, Coen M, Cirelli C, Benca RM, Ghilardi MF, Tononi G. Sleep-dependent improvement in visuomotor learning: a causal role for slow waves. Sleep. 2009;32:1273–1284. doi: 10.1093/sleep/32.10.1273. [DOI] [PMC free article] [PubMed] [Google Scholar]
- Leonard BJ, McNaughton BL, Barnes CA. Suppression of hippocampal synaptic plasticity during slow-wave sleep. Brain Res. 1987;425:174–177. doi: 10.1016/0006-8993(87)90496-3. [DOI] [PubMed] [Google Scholar]
- Lovatt D, Xu Q, Liu W, Takano T, Smith NA, Schnermann J, Tieu K, Nedergaard M. Neuronal adenosine release, and not astrocytic ATP release, mediates feedback inhibition of excitatory activity. Proc Natl Acad Sci U S A. 2012;109:6265–6270. doi: 10.1073/pnas.1120997109. [DOI] [PMC free article] [PubMed] [Google Scholar]
- McCormick DA, Bal T. Sleep and arousal: thalamocortical mechanisms. Annu Rev Neurosci. 1997;20:185–215. doi: 10.1146/annurev.neuro.20.1.185. [DOI] [PubMed] [Google Scholar]
- Musall S, von Pföstl V, Rauch A, Logothetis NK, Whittingstall K. Effects of neural synchrony on surface EEG. Cereb Cortex. 2014;24:1045–1053. doi: 10.1093/cercor/bhs389. [DOI] [PubMed] [Google Scholar]
- O'Donovan MJ, Rinzel J. Synaptic depression: a dynamic regulator of synaptic communication with varied functional roles. Trends Neurosci. 1997;20:431–433. doi: 10.1016/S0166-2236(97)01124-7. [DOI] [PubMed] [Google Scholar]
- Qiu MH, Chen MC, Lu J. Cortical neuronal activity does not regulate sleep homeostasis. Neuroscience. 2015;297:211–218. doi: 10.1016/j.neuroscience.2015.03.070. [DOI] [PMC free article] [PubMed] [Google Scholar]
- Rechtschaffen A. Current perspectives on the function of sleep. Perspect Biol Med. 1998;41:359–390. doi: 10.1353/pbm.1998.0051. [DOI] [PubMed] [Google Scholar]
- Seol GH, Ziburkus J, Huang S, Song L, Kim IT, Takamiya K, Huganir RL, Lee HK, Kirkwood A. Neuromodulators control the polarity of spike-timing-dependent synaptic plasticity. Neuron. 2007;55:919–929. doi: 10.1016/j.neuron.2007.08.013. [DOI] [PMC free article] [PubMed] [Google Scholar]
- Steriade M, Timofeev I, Grenier F. Natural waking and sleep states: a view from inside neocortical neurons. J Neurophysiol. 2001;85:1969–1985. doi: 10.1152/jn.2001.85.5.1969. [DOI] [PubMed] [Google Scholar]
- Tononi G, Cirelli C. Sleep function and synaptic homeostasis. Sleep Med Rev. 2006;10:49–62. doi: 10.1016/j.smrv.2005.05.002. [DOI] [PubMed] [Google Scholar]
- Tononi G, Cirelli C. Time to be SHY? Some comments on sleep and synaptic homeostasis. Neural Plast. 2012;2012:415250. doi: 10.1155/2012/415250. [DOI] [PMC free article] [PubMed] [Google Scholar]
- Tononi G, Cirelli C. Sleep and the price of plasticity: from synaptic and cellular homeostasis to memory consolidation and integration. Neuron. 2014;81:12–34. doi: 10.1016/j.neuron.2013.12.025. [DOI] [PMC free article] [PubMed] [Google Scholar]
- Vyazovskiy VV, Harris KD. Sleep and the single neuron: the role of global slow oscillations in individual cell rest. Nat Rev Neurosci. 2013;14:443–451. doi: 10.1038/nrn3494. [DOI] [PMC free article] [PubMed] [Google Scholar]
- Vyazovskiy VV, Olcese U, Lazimy YM, Faraguna U, Esser SK, Williams JC, Cirelli C, Tononi G. Cortical firing and sleep homeostasis. Neuron. 2009;63:865–878. doi: 10.1016/j.neuron.2009.08.024. [DOI] [PMC free article] [PubMed] [Google Scholar]
- Vyazovskiy VV, Olcese U, Hanlon EC, Nir Y, Cirelli C, Tononi G. Local sleep in awake rats. Nature. 2011;472:443–447. doi: 10.1038/nature10009. [DOI] [PMC free article] [PubMed] [Google Scholar]
- Whittington MA, Cunningham MO, LeBeau FE, Racca C, Traub RD. Multiple origins of the cortical gamma rhythm. Dev Neurobiol. 2011;71:92–106. doi: 10.1002/dneu.20814. [DOI] [PubMed] [Google Scholar]
- Yizhar O, Fenno LE, Davidson TJ, Mogri M, Deisseroth K. Optogenetics in neural systems. Neuron. 2011;71:9–34. doi: 10.1016/j.neuron.2011.06.004. [DOI] [PubMed] [Google Scholar]