Abstract
Synaptic plasticity is sensitive to the rate and the timing of presynaptic and postsynaptic action potentials. In experimental protocols inducing plasticity, the imposed spike trains are typically regular and the relative timing between every presynaptic and postsynaptic spike is fixed. This is at odds with firing patterns observed in the cortex of intact animals, where cells fire irregularly and the timing between presynaptic and postsynaptic spikes varies. To investigate synaptic changes elicited by in vivo-like firing, we used numerical simulations and mathematical analysis of synaptic plasticity models. We found that the influence of spike timing on plasticity is weaker than expected from regular stimulation protocols. Moreover, when neurons fire irregularly, synaptic changes induced by precise spike timing can be equivalently induced by a modest firing rate variation. Our findings bridge the gap between existing results on synaptic plasticity and plasticity occurring in vivo, and challenge the dominant role of spike timing in plasticity.
SIGNIFICANCE STATEMENT Synaptic plasticity, the change in efficacy of connections between neurons, is thought to underlie learning and memory. The dominant paradigm posits that the precise timing of neural action potentials (APs) is central for plasticity induction. This concept is based on experiments using highly regular and stereotyped patterns of APs, in stark contrast with natural neuronal activity. Using synaptic plasticity models, we investigated how irregular, in vivo-like activity shapes synaptic plasticity. We found that synaptic changes induced by precise timing of APs are much weaker than suggested by regular stimulation protocols, and can be equivalently induced by modest variations of the AP rate alone. Our results call into question the dominant role of precise AP timing for plasticity in natural conditions.
Keywords: computational model, in vivo, macaque monkey, natural firing patterns, synaptic plasticity
Introduction
Action potentials (APs) transmit information; synaptic plasticity underlies learning and memory. These two principles have guided neuroscience for over half a century. Yet linking the two by measuring activity-elicited synaptic changes in intact animals remains extremely challenging.
Experimental studies in in vitro preparations have shown that the induction of synaptic long-term potentiation (LTP) and long-term depression (LTD) depends on the following: (1) the firing rates of presynaptic and postsynaptic neurons (Dudek and Bear, 1992; Sjöström et al., 2001); and (2) the precise timing of presynaptic and postsynaptic APs (Magee and Johnston, 1997; Markram et al., 1997; Bi and Poo, 1998; Campanac and Debanne, 2008). How do these two key findings translate to intact animals? Does one of the effects dominate the other? These questions remain open as in vivo conditions differ in a number of ways from in vitro conditions in which most synaptic changes were measured. One important difference lies in the firing statistics: in the majority of experimental protocols used to induce plasticity in vitro, the imposed spike trains are regular and the relative timing between every presynaptic and postsynaptic spike is constant; whereas in natural firing patterns observed in the cortex of intact animals, cells fire irregularly (Softky and Koch, 1993) and the timing between presynaptic and postsynaptic spikes varies (Cohen and Maunsell, 2009). Aside from other potentially important differences, here we ask how much the firing statistics impact the relative influence of firing rate and spike timing on synaptic plasticity. To address this question, we used numerical simulations and mathematical analysis of models of synaptic plasticity. Our approach allows us to dissect the effects of firing rate and spike timing, and produce experimentally testable predictions.
Plasticity models of different complexities and degrees of biological realism have been developed to capture the link between one or several stimulation protocols and induced plasticity. The classical spike timing-based models capture pair-based spike-time-dependent plasticity (STDP), referred to as the pair-based model, but do not account for the firing rate dependence of plasticity (Gerstner et al., 1996; Kempter et al., 1998; Song et al., 2000; but see Izhikevich et al., 2003). To account for the firing rate dependence and nonlinearities of plasticity induction, more complex models have been proposed following two different directions: (1) phenomenological spike timing-based models extend pair-based models by including effects of additional spikes or the membrane potential to compute plasticity (for review, see Morrison et al., 2008; Clopath et al., 2010); (2) biophysically inspired models link the calcium dynamics evoked by presynaptic and postsynaptic activity to observed plasticity outcomes (pioneered by Shouval et al., 2002; for review, see Graupner and Brunel, 2010). Here we concentrate on one model from each of these two classes: a spike timing model based on spike-triplets (referred to as the triplet-based model) (Pfister and Gerstner, 2006), and a calcium-based model (referred to as the calcium-based model) (Graupner and Brunel, 2012). We furthermore contrast the results with the behavior of the widely used classical spike-pair based model (Gerstner et al., 1996; Kempter et al., 1998; Song et al., 2000).
In all three plasticity models, we examine the magnitude of synaptic changes induced by imposing strong but realistic timing constraints between presynaptic and postsynaptic spikes, and we compare it with changes induced by increasing solely the presynaptic and postsynaptic firing rates without any timing constraint. We quantify the relative influence of timing and firing rate on synaptic plasticity in a variety of firing conditions, including activity patterns recorded in vivo in awake, behaving macaque monkeys. Our overarching conclusion is that, for natural firing patterns, synaptic changes induced by spike timing can be reproduced by a modest variation of the firing rate in absence of any timing constraints. This finding challenges the dominant view that spike timing plays a central role in long-term synaptic plasticity.
Materials and Methods
Two mutually coupled integrate-and-fire neurons.
We consider two integrate-and-fire neurons, which are connected by recurrent synapses. The dynamics of the membrane potential, Vi(t) (with i = 1, 2), is given by the following:
where τm = 10 ms is the membrane time constant. An AP is emitted when the membrane potential crosses a fixed threshold VT = 20 mV. The membrane potential is subsequently reset to a value VR = 10 mV. The neurons receive external inputs Ii and synaptic inputs Isyn corresponding to the mutual synaptic connections (see below).
Synaptic inputs.
The postsynaptic current elicited by APs in the presynaptic neuron occurring at times ti is given by the following:
 |
where δs is the transmission latency with δs = 1.5 ms (Markram et al., 1997). J describes the plastic part of the synaptic weight given by J = Imax w, where w implements the synaptic learning rule varying between 0 and 1 (see below). Imax determines the maximally mediated current by the synapse. The synaptic gating variable, s(t), is characterized by an instantaneous increase after a presynaptic spike and an exponential decay as follows:
 |
τs = 3 ms is the synaptic decay time constant (Hestrin, 1993).
Models of synaptic plasticity.
We investigate three different models describing the temporal evolution of the plastic synaptic weight variable, w, as a function of presynaptic and postsynaptic activity.
Pair-based learning rule.
For every pair of presynaptic and postsynaptic spikes separated by a time lag Δ, the amount of synaptic change reads (Song et al., 2000; van Rossum et al., 2000; Rubin et al., 2001) as follows:
 |
We used parameter values from Bi and Poo, (2001): A+ = 0.0096, t+ = 16.8 ms, A− = 0.0053, and τ− = 33.7 ms.
Triplet-based learning rule.
Changes in the synaptic efficacy are driven by presynaptic and postsynaptic spikes, which trigger the following detector variables (Pfister and Gerstner, 2006):
 |
 |
 |
Here r1 is a detector of presynaptic spikes occurring at ti, whereas o1 and o2 are two detectors of postsynaptic spikes occurring at tj.
After a presynaptic spike, the weight decreases by an amount that is proportional to the value of the postsynaptic variable o1. Hence, a presynaptic spike arrival at time ti triggers a change given by the following:
A postsynaptic spike at time tj triggers a change that depends on the presynaptic variable r1 and the second postsynaptic variable o2, effectively implementing the triplet rule, as follows:
A2+ and A2− denote the amplitude of the weight change whenever there is a pre-post or a post-pre pair. Similarly, A3+ denotes the amplitude of the 1-pre-2-post triplet term for potentiation, if the interval between the two postsynaptic spikes is on the order of τy. That is, spike triplets are detected if a previous postsynaptic spike has led to an increase of o2 and it contributes to the potentiation (Eq. 9). ϵ is a small positive constant to ensure that the weight is updated before the detectors o2. In other words, the synaptic weight w is updated first according to Equation 9 and o2 is increased by 1 (Eq. 7) afterward (Pfister and Gerstner, 2006). Following Pfister and Gerstner (2006), the 2-pre-1-post triplet contribution to depression was set to zero, i.e., A3− = 0. Including A3− and its time constant τx in the fitting routine did not considerably improve the match with the data. The pair-based learning rule is recovered by setting A3+ = 0.
In contrast to the model proposed in Pfister and Gerstner (2006), we include soft boundaries to restrict the synaptic weight to w ∈ (0, 1) for better comparison with the other models. This is implemented by multiplying the LTD and the LTP update terms with w and (1− w). Because of this change and the inclusion of additional experimental data, the parameters of the model were refitted to experimental data (Table 1). τ+ and τ− are kept the same as in the pair-based model.
Table 1.
Parameters obtained by fitting the triplet-based model to visual cortex plasticity data of regular and jittered spike-pairs (Sjöström et al., 2001)a
a Only A2−, A3− and τy have been refitted with respect to the minimal all-to-all model in Pfister and Gerstner (2006).
b Values were left unchanged.
Calcium-based learning rule.
Here, the postsynaptic calcium concentration drives changes in w according to the following:
τcb is the time constant of synaptic efficacy changes happening on the order of seconds to minutes. The first two terms in Equation 10 describe in a highly simplified fashion calcium-dependent signaling cascades leading to synaptic potentiation and depression, respectively. The synaptic efficacy variable tends to increase, or decrease, when the instantaneous calcium concentration, c(t), is above the potentiation (θp) or the depression threshold (θd), respectively (Θ denotes the Heaviside function, Θ[c − θ] = 0 for c < θ and Θ[c − θ] = 1 for c ≥ θ). The parameter γp (respective γd) measures the rate of synaptic increase (respective decrease) when the potentiation (respective depression) threshold is exceeded.
The last term in Equation 10 is an activity-dependent noise term, Noise(t) = , where σ measures the amplitude of the noise, η(t) is a Gaussian white-noise process with unit variance, and the Θ function gives an activity dependence to noise (it is present whenever calcium is above the potentiation and/or depression thresholds). This term accounts for activity-dependent fluctuations (for more details, see Graupner and Brunel, 2012).
In contrast to the model proposed by Graupner and Brunel (2012), in the absence of activity, the synapse has a continuum of stable states in Equation 10. In other words, w is stable at every value (0, 1) for c < θd, θp. Because of this change and the inclusion of additional experimental data, the parameters of the model were refitted to experimental data (see below).
We examined two variants of the postsynaptic calcium implementation: (1) the linear calcium dynamics (as in Graupner and Brunel, 2012) where contributions from presynaptic and postsynaptic spikes add linearly (this variant is used throughout the manuscript and in the analytical derivation); and (2) a nonlinear version of calcium dynamics that accounts for the nonlinear summation of presynaptically and postsynaptically evoked transients when the postspike occurs after the prespike. It describes the nonlinear portion of the NMDAR-mediated calcium current, which is triggered by the coincident occurrence of postsynaptic depolarization from the postspike and presynaptic activation from the prespike. This version was used in Figure 9 and the corresponding paragraph. Below we describe the details of calcium dynamics in the two variants of the implementation.
Figure 9.
Synaptic plasticity in the calcium-based model with nonlinear calcium dynamics. A, B, Fits of the calcium-based model with nonlinear calcium dynamics to the experimental data obtained for regular (A) and irregular (B) spike-pairs (Sjöström et al., 2001) (same depiction as Fig. 1A). C, Change in synaptic strength versus time lag between presynaptic and postsynaptic spike for regular spike-pairs presented at low frequency. The change is elicited by 75 spike-pairs occurring at 1 Hz. D, Change in synaptic strength as a function of the time lag between presynaptic and postsynaptic spikes for irregular (orange) and regular spike-pairs (blue) at different firing rates (see top of each panel). E, Change in synaptic strength as a function of firing rate for several values of the correlation coefficient ρ and time lag Δ. F, Sensitivity of synaptic changes to spike-pair correlations. G, Sensitivity of synaptic changes to firing rate changes. E–G, Same depiction as in Figure 5B, E, H, respectively, but for the calcium-based model with nonlinear calcium dynamics. D–G, The reported synaptic changes are in response to a 10 s stimulation.
- The linear calcium dynamics (see Figs. 1, 3, 5, 6, 7, 8) are described by the following:
where c is the total calcium concentration, τCa the calcium decay time constant, and Cpre and Cpost the presynaptically and postsynaptically evoked calcium amplitudes. The sums run over all presynaptic and postsynaptic spikes occurring at times ti and tj, respectively. The time delay, D, between the presynaptic spike and the occurrence of the corresponding postsynaptic calcium transient accounts for the slow rise time of the NMDAR-mediated calcium influx. Because of δs < D, the postsynaptic current occurs before the calcium transient. Without loss of generality, we set the resting calcium concentration to zero and use dimensionless calcium concentrations.
- In the nonlinear calcium dynamics (see Fig. 9), calcium transients evoked by presynaptic spikes, cpre, are described as follows:
where τCa is the calcium decay time constant and Cpre the presynaptically evoked calcium amplitude. The sums run over all presynaptic spikes occurring at times ti. D is the time delay between prespike and the calcium transient (see above). Postsynaptically evoked transients, cpost, are given by the following:
where τCa is the calcium decay time constant and Cpost the postsynaptically evoked calcium amplitude. The sums run over all postsynaptic spikes occurring at times tj. ξ implements the increase of the NMDA-mediated current in case of coincident presynaptic activation and postsynaptic depolarization. ξ determines by which amount the postsynaptically evoked calcium transient is increased in case of preceding presynaptic stimulation, in which case cpre ≠ 0. ξ is related to the experimentally measured nonlinearity factor, n (Nevian and Sakmann, 2006; peak calcium amplitude normalized to the expected linear sum of presynaptically and postsynaptically evoked calcium transients) by the following:
We use for the maximal nonlinearity factor n = 2 consistent with data from Nevian and Sakmann (2006).
Figure 1.
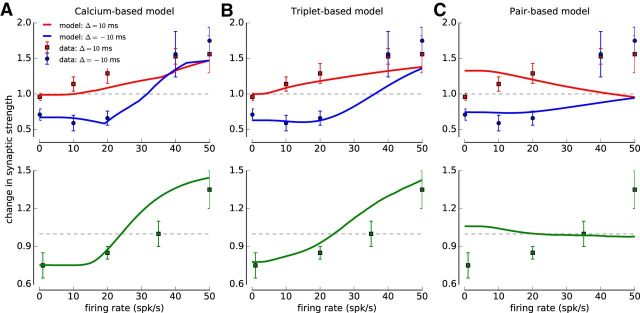
Pair-, triplet-, and calcium-based models and visual cortex plasticity data from regular and jittered spike-pairs. A–C, The change of the synaptic strength is shown as a function of the spike-pair presentation frequency for regular pre-post pairs (top row; Δ = 10 ms, red squares and lines), regular post-pre pairs (top row; Δ = −10 ms, blue circles and lines), and jittered spike-pairs (bottom row; green squares and lines) as occurring in the calcium-based (with linear calcium dynamics, A), the triplet-based (B), and the pair-based (C) models. Only the calcium- and the triplet-based models are fitted to the experimental data. The data-points are taken from plasticity experiments in cortical slices (mean ± SEM) (Sjöström et al., 2001).
Figure 3.
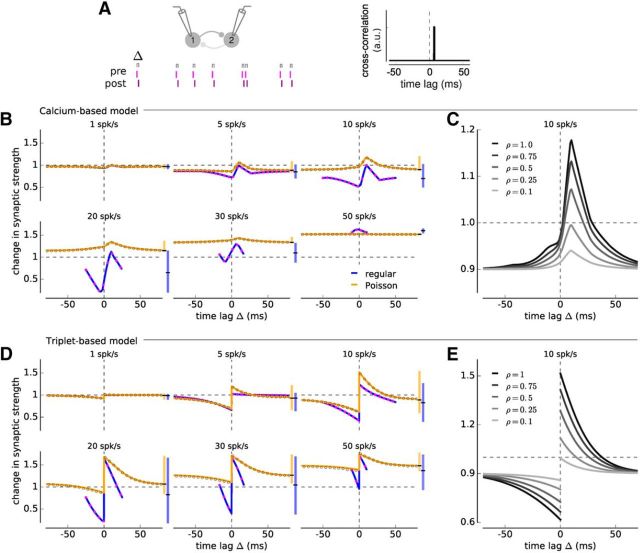
Change in synaptic strength in response to irregular and regular spike-pairs in the calcium- and triplet-based models. A, Illustration of two neurons driven to fire irregular spike-pairs with fixed time lag Δ (top). The cross-correlation function of irregular spike-pairs is given by a δ function with a peak at Δ. B, Change in synaptic strength as a function of the time lag between presynaptic and postsynaptic spikes for irregular (orange) and regular spike-pairs (blue) at different firing rates for the calcium-based model with linear calcium dynamics. Vertical range bar on the right of each panel in the same color represents the range of synaptic changes attained at each rate and for both cases. Vertical black line in the range bar indicates the baseline change in synaptic strength. Gray and magenta open circles represent simulations of the full model with irregular and regular spike-pair stimulations. C, Change in synaptic strength as a function of Δ for different pre-post correlation coefficients ρ for the calcium-based model with linear calcium dynamics. Same depiction as in B, but for several values of ρ. The firing rate of presynaptic and postsynaptic neurons is 10 spk/s. D, E, Same as B, C, but for the triplet-based model. All changes are in response to a stimulation for 10 s. Presynaptic and postsynaptic neurons have identical firing rates.
Figure 5.
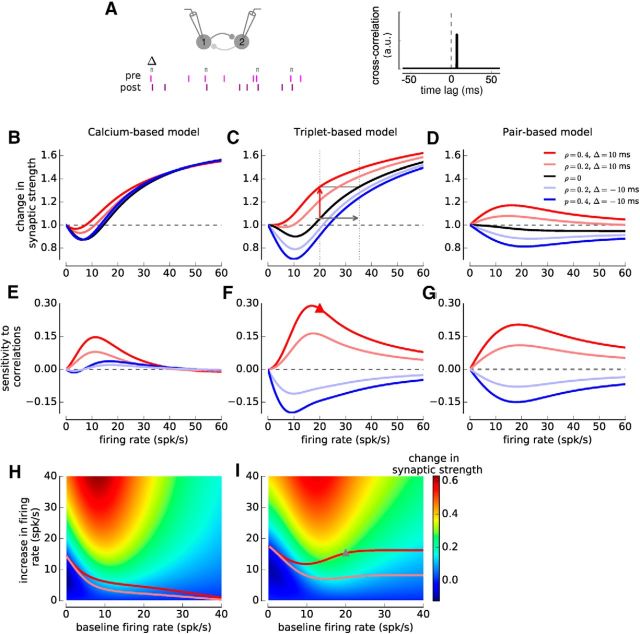
Comparing the sensitivity of synaptic changes to spike-pair correlations and firing rate variations. A, Illustration of two neurons firing with correlation coefficient ρ < 1. The presynaptic neuron is made to fire a Poisson spike train, and each presynaptic spike evokes a postsynaptic spike at a fixed time lag Δ with probability p = ρ (see Materials and Methods). A fraction 1-p of uncorrelated postsynaptic spikes is added to keep the firing rate independent of p. The cross-correlation function is given by a δ function with an amplitude proportional to ρ (right). B–D, Change in synaptic strength as a function of firing rate for several values of the correlation coefficient ρ and time lag Δ in the calcium- (with linear calcium dynamics, B), the triplet- (C), and the pair-based (D) models. Five cases are shown: (1) uncorrelated Poisson spike trains, ρ = 0 (black); (2) pre-post pairs with Δ = 10 ms at ρ = 0.2 (light red) and ρ = 0.4 (dark red); and (3) post-pre pairs with Δ = −10 ms at ρ = 0.2 (light blue) and ρ = 0.4 (dark blue). E–G, Sensitivity of synaptic changes to spike-pair correlations in the calcium- (E), triplet- (F), and pair-based (G) models. See Equation 25 for the definition, and red arrow in C for an illustration of sensitivity to correlations at 20 spk/s. The red triangle in F represents the corresponding value. H, I, Sensitivity of synaptic changes to firing rate changes in the calcium- (H) and triplet-based (I) models. See Equation 26 for the definition. The gray arrow in C indicates sensitivity to firing rate changes for a baseline rate of 20 spk/s, and an increase of 15.3 spk/s. The gray triangle in I represents the corresponding value. Color plots represent the synaptic change as function of baseline firing rate (x-axis) and increase in firing rate (y-axis). Light and dark red lines indicate the firing rate increase evoking the same synaptic change as spike-pair correlations with ρ = 0.2 and ρ = 0.4, respectively.
Figure 6.
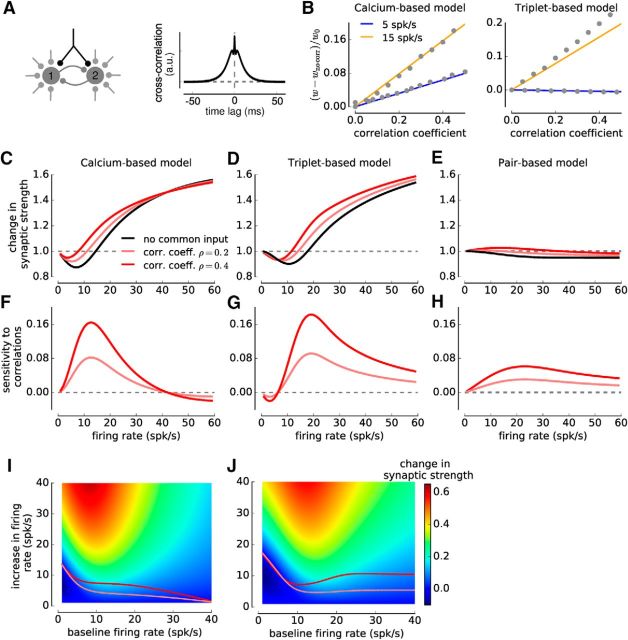
Comparing the sensitivity of synaptic changes with common-input correlations and firing rate changes. A, Illustration of two mutually coupled integrate-and-fire neurons that are driven by a barrage of independent (gray) and common fluctuating inputs (black). The fraction of common input, c, is varied and sets the correlation between the two neurons. The cross-correlation function can be determined mathematically (right; see Materials and Methods) (Ostojic et al., 2009). B, Increase in synaptic strength as function of the correlation coefficient between both neurons. The simulation results (circles) are well approximated by a linear increase, the slope of which can be determined mathematically (colored lines; see Materials and Methods). The slope depends on the baseline firing rate (two examples shown for the calcium- and the triplet-based models). C–E, Change in synaptic strength as a function of the firing rate of uncorrelated, intermediate and strongly correlated integrate-and-fire neurons, for the calcium- (with linear calcium dynamics, C), the triplet- (D), and the pair-based (E) models. Both neurons receive (1) no common input (ρ = 0, black), (2) weak common input yielding ρ = 0.2 (light red), and (3) strong common input yielding ρ = 0.4 (dark red). F–H, Sensitivity of synaptic plasticity to correlations (Eq. 25) as a function of the firing rate, for the calcium- (E), the triplet- (G), and the pair-based (H) models. The correlation coefficients are ρ = 0.2 (light red) and ρ = 0.4 (dark red). I, J, Sensitivity of synaptic plasticity to firing rate changes (Eq. 26) for the calcium- (I) and triplet-based (J) models. Color code illustrates the synaptic change for a given baseline firing rate (x-axis) and increase in firing rate (y-axis). Light and dark red lines indicate the firing rate increase evoking the same synaptic change as correlations from common input with ρ = 0.2 and ρ = 0.4, respectively, for the respective baseline rate.
Figure 7.

Dependence of synaptic changes on dissimilar presynaptic and postsynaptic firing rates. A, Change in synaptic strength for uncorrelated integrate-and-fire neurons, for the calcium-based model (with linear calcium dynamics, left) and the triplet-based model (right). The coefficient of variation for both neurons was fixed to 1 independently of the firing rate. B, Sensitivity to correlations (Eq. 25). Additional increase in synaptic strength obtained by adding common inputs leading to a correlation coefficient ρ = 0.4. C, Firing rate increase in both presynaptic and postsynaptic neurons needed to reproduce the synaptic changes induced by common-input correlations with ρ = 0.4 (B). All changes are in response to a 10 s stimulation.
Figure 8.
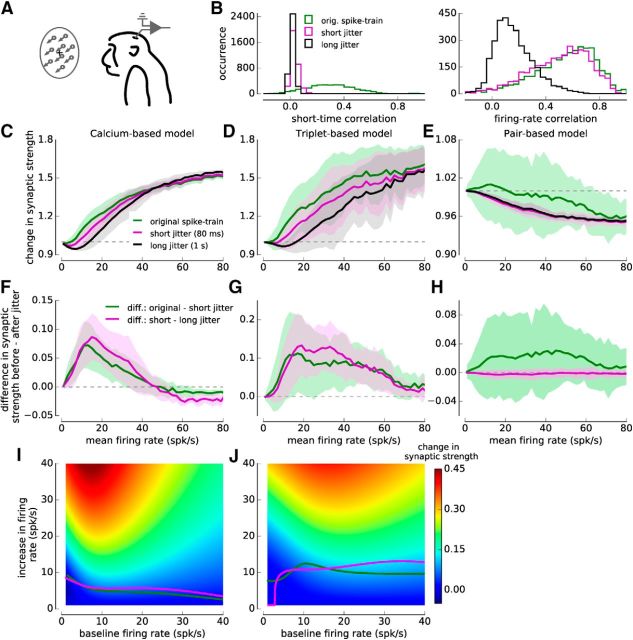
Synaptic plasticity induced by spiking activity recorded in monkey area MT. A, Illustration of multiunit recordings in monkey area MT. Moving dots stimuli were displayed for 500 ms while the monkeys fixated. B, Short and long time-scale correlations in the monkey data. Applying a Gaussian jitter with zero mean and a 80 ms SD eliminates short-time but preserved firing rate correlations (magenta lines), whereas a jitter with a 1 s SD eliminates short and strongly reduces long time-scale correlations (black lines). C–E, Change in synaptic strength induced by experimentally recorded spiking activity in the calcium- (with linear calcium dynamics, C), the triplet- (D), and the pair-based models (E). The mean and the SD of the change in synaptic strength is shown as function of the mean firing rate (bin size 2 spk/s) for the original spike trains and the jittered surrogate spike trains. F–H, Sensitivity to short-time correlations and firing rate correlations in the calcium- (F), the triplet- (G), and the pair-based models (H). The mean and the SD of the difference in synaptic strength from the original spike train and the short jittered spike train (green); as well as for the synaptic strength difference between the spike trains with short and long jitter (magenta; bin size 2 spk/s) is shown. I, J, Sensitivity of synaptic strength to firing rate changes in the calcium- (I) and the triplet-based model (J). Color code illustrates the synaptic change for a given baseline firing rate (x-axis) and increase in firing rate (y-axis) based on the spike train with long jitter (C, D, black line). Magenta and the green lines indicate the firing rate increase evoking the same synaptic change as short-time and firing rate correlations as depicted in F, G. All data and changes are derived from 10-s-long epochs of the recorded firing patterns.
The total calcium concentration is the sum of the presynaptic and the postsynaptic contributions, c(t) = cpre(t) + cpost(t).
Fitting the plasticity models to experimental data.
To compare the triplet- and the calcium-based models, we fitted both to experimental plasticity data obtained from synapses between layer V neurons in the rat visual cortex (Figure 1; Sjöström et al., 2001). Parameter sets reproducing the cortical data were provided in the original publications of those models (Pfister and Gerstner, 2006; Graupner and Brunel, 2012). However, the changes here, which consisted of including soft boundaries in the triplet-model and removing the bistable term in the calcium-based model, made refitting necessary. Our fits furthermore included the plasticity dataset obtained through jittered spike-pairs (Sjöström et al., 2001, their Fig. 8).
The stimulation protocols used by Sjöström et al. (2001) combine spike timing and firing rate components by varying the presentation frequency of regular and jittered spike-pairs. When spike-pairs are presented regularly (with fixed interpair intervals) with fixed Δ, they find that pre-post pairs (Δ = 10 ms) induce no change at low presentations frequencies, whereas post-pre pairs (Δ = −10 ms) evoke LTD. Both pairings evoked LTP at high rates due to the interaction between subsequent spike-pairs (Figure 1; Sjöström et al., 2001). In the jittered variant of that protocol, the time of the presynaptic spike is drawn from a flat distribution (−15, 15) ms, and Δ is drawn from the same distribution (Sjöström et al., 2001). The jittering of spike-pairs and time differences leads to LTD at low rates (<35 spk/s) and LTP at high firing rates (>35 spk/s) (Figure 1; Sjöström et al., 2001).
We defined the goodness of fit to the experimental data by a cost function, which is the sum of all squared distances between data points and the values obtained from the triplet- or the calcium-based model normalized by the squared SEM of each data point. We drew initial parameter values from a uniform distribution and use the downhill simplex algorithm to search for the minimum of the cost function. The fit is repeated >109 times, and the parameter set with the lowest cost function is used (Table 1, triplet-based; Table 2, calcium-based model).
Table 2.
Parameters obtained by fitting the calcium-based model to visual cortex plasticity data of regular and jittered spike-pairs (Sjöström et al., 2001)a
| Parameter | Unit | Linear calcium dynamics | Nonlinear calcium dynamics |
|---|---|---|---|
| τCa | ms | 22.27212 | 18.93044 |
| Cpre | 0.84410 | 0.86467 | |
| Cpost | 1.62138 | 2.30815 | |
| θd | 1 | 1 | |
| θp | 2.009289 | 4.99780 | |
| γd | 137.7586 | 111.82515 | |
| γp | 597.08922 | 894.23695 | |
| τcb | s | 520.76129 | 707.02258 |
| D | ms | 9.53709 | 10 |
| n | 1 | 2 |
a Calcium amplitudes and thresholds are scaled by θd without loss of generality. The nonlinearity factors are 1 for the linear implementation (i.e., linear summation of presynaptically and postsynaptically evoked calcium transients) and 2 for the nonlinear implementation (Nevian and Sakmann, 2006).
The pair-based model exhibits very weak firing rate dependence; we therefore choose not to fit the model to the data (Fig. 1A) and use the parameters obtained when fitting the pair-based model to spike-pair data from hippocampal cultures: A+ = 0.0096, τ+=16.8 ms, A− = 0.0053, τ− = 33.7 ms (60 regularly spaced spike-pairs at 1 Hz for various time lags Δ) (Bi and Poo, 2001).
We consider the change in synaptic strength as the ratio between the synaptic strength after and before the stimulation protocol w/w0. w0 = 0.5 in all simulations and calculations such that the maximally evoked change remains in the interval (0, 2).
Spike trains and measures of correlations.
Here we specify the notations used for spike trains and measures of correlation between simulated spike trains. Correlation measures for neural activity recorded in awake monkeys are described separately below.
A spike train is represented as the time series as follows:
 |
where tj for j = 1, …, p is the series of spike times ordered in time on the interval (0, T).
The instantaneous firing rate ν(t) is defined as follows:
where the brackets denote averaging over trials. Because the firing is stationary in the simulated spike trains, ν(t) = ν0 for all t.
The cross-correlation function between the spike trains s(1)(t) and s(2)(t) of two neurons is as follows:
 |
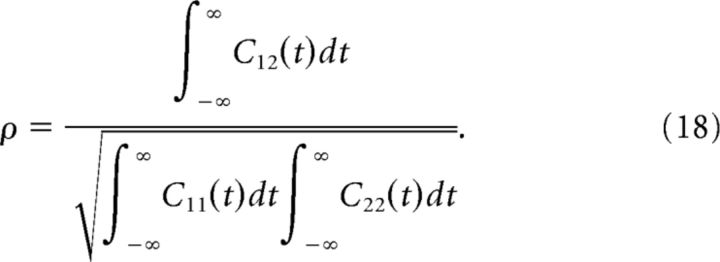
To quantify the strength of correlations in the stationary cases (see Regular and irregular spike-pair correlations, Correlations from common inputs), we use the spike-count correlation coefficient in the limit of long time-bins (de la Rocha et al., 2007). This correlation coefficient, which we call ρ, is related to auto- and cross-correlation functions via the following:
 |
Firing patterns of mutually coupled neurons.
To study changes in synaptic efficacy induced by firing rate and correlations under different conditions, we generated presynaptic and postsynaptic spikes by (1) imposing spike-pair correlations, (2) simulating correlations emerging from common inputs and (3) making neurons fire as recorded in awake macaque monkeys. The stimulation is imposed for a duration T = 10 s, independently of the firing rate (so that the total number of emitted spikes varies with the firing rate).
-
Regular- and irregular spike-pair correlations (see Figs. 3–5). As in experiments, regularly spaced spike-pairs were imposed with time difference Δ between presynaptic and postsynaptic spikes, at varying frequencies ν (Sjöström et al., 2001).
Irregular spike-pairs were generated using discretely correlated Poisson processes. The presynaptic neuron emitted spikes with Poisson statistics at rate νpre. Each of these presynaptic spikes induced with probability p a postsynaptic spike with a fixed time lag Δ. The postsynaptic neuron in addition emits independent spikes with Poisson statistics at a rate νpost − pνpre, so that the total postsynaptic firing rate is νpost. In this case, the cross-correlation function between presynaptic and postsynaptic spike trains is C(t) = pδ(t − Δ)/νpost, and the correlation coefficient is ρ = . If νpost < νpre, the probability p is constrained to be smaller or equal to νpost/νpre.
Similarly to whole-cell plasticity experiments, this type of spike-pair patterns can be induced by injecting strong currents in the integrate-and-fire model. For simplicity, we directly simulated the spike patterns. Input integration and synaptic inputs play no role in this stimulation protocol.
-
Correlations from common inputs (see Figs. 6, 7, 9). The two neurons received Gaussian white-noise mimicking the barrage of synaptic inputs received in vivo. A fraction c of these inputs was shared between the two neurons, the remaining part being independent (de la Rocha et al., 2007), so that the total input to neuron i reads as follows:
Here η1, η2, and ηc are three uncorrelated Gaussian white-noise processes of zero mean and unit variance. The total input current to each neuron is a Gaussian white-noise process with mean μi and variance τmσi2, and c represents the fraction of the input that is shared between the neurons. As c is varied, the total input and hence the firing rate of the neuron remains constant, whereas the correlation between the output spike trains of the neurons changes. This allowed us to precisely distinguish between effects of correlations and firing rate on synaptic plasticity. The values of μi and σi were set so that the neurons fire at desired firing rates and with coefficients of variation close to 1. The cross-correlation function for this case can be determined analytically (Ostojic et al., 2009), which we used to calculate synaptic changes (see below). For small fractions c of shared inputs, the correlation coefficient defined in Equation 18 is well approximated (de la Rocha et al., 2007) by the following:
where νi is the output firing rate of the neuron i and CVi is the coefficient of variation of its interspike intervals. We use this formula to represent our results as functions of correlation coefficient ρ when varying c. Explicit expressions for ν and CV as functions of the input parameters μ and σ are given for example in Brunel (2000).
Firing patterns as recorded in area MT of awake macaque monkeys (see Fig. 8) We impose natural firing patterns from simultaneously recorded single units on both model neurons and study the weight dynamics of the recurrent connections. From each recording during which macaque monkeys watch moving dot stimuli, 2, 3, or 4 single units were identified through spike sorting, yielding 2, 6, or 12 synaptic dynamics (from the permutations of the 2, 3, or 4 neurons), respectively (see below). As for Case 1, input integration and synaptic inputs play no role here.
Figure 4.
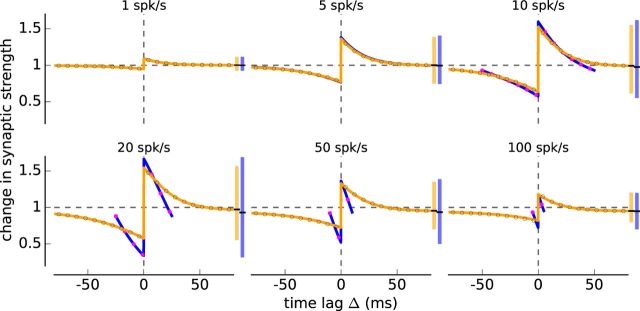
Change in synaptic strength in response to irregular and regular spike-pairs in the pair-based model. Change in synaptic strength as a function of the time lag between presynaptic and postsynaptic spikes for irregular (orange) and regular spike-pairs (blue) at different firing rates (see top of each panel). Same depiction as in Figure 3B, but for the pair-based model.
Single-unit activity recorded in awake macaque monkeys.
Data were collected from area MT of awake, actively fixating macaque monkeys that were seated 57 cm from the screen using single tungsten microelectrodes with an impedance of 0.5–2 MΩ. Signals were sampled at 40 kHz, amplified, and processed using a Plexon MAP box. Visual stimulation during data collection consisted of random dot kinematograms (RDKs) presented at full Michelson contrast (dot luminance was 42 cd/m2) against a dark background (0.1 cd/m2). Dot density of the RDKs was 3 dots/degree2. RDKs were presented at a size of 10 degrees to fill the parafoveal receptive fields of the MT neurons with a dot lifetime of 200 ms and a diameter of 0.1° for individual dots. RDKs moving in different directions around the circle were presented continuously, for 500 ms each, to determine the direction-tuning of the recorded neurons (for more details on animal training and physiological recording, see Jazayeri et al., 2012).
Spikes were sorted into distinct clusters based on the information contained in their waveform shape and spike timing, along the principles outlined by Lewicki (1998) using the Plexon Offline Sorter 2.8.0 software. Doing so, we managed to distinguish signals from individual neurons from each other and from multiunit activity. Although it is widely recognized that there can be considerable drift in waveform shape, presumably because of physical movement between the electrode tip and the neurons, this drift usually occurs on long timescales. Signals were stable on the timescale of the individual recordings, typically <3 min, reported here.
The sorted spike trains from an entire session (average length 129.9 ± 39.1 s) were divided into epochs of 10 s and treated as independent chunks of data for all analysis and simulations (only the cross-correlograms and correlations coefficients in Fig. 2G–J are calculated based on an entire recording to reduce fluctuations). In turn, all plasticity data presented emerge from 10 s stimulation with generated and natural spike trains. The properties of the recorded spiking activities are displayed in Figure 2.
Figure 2.
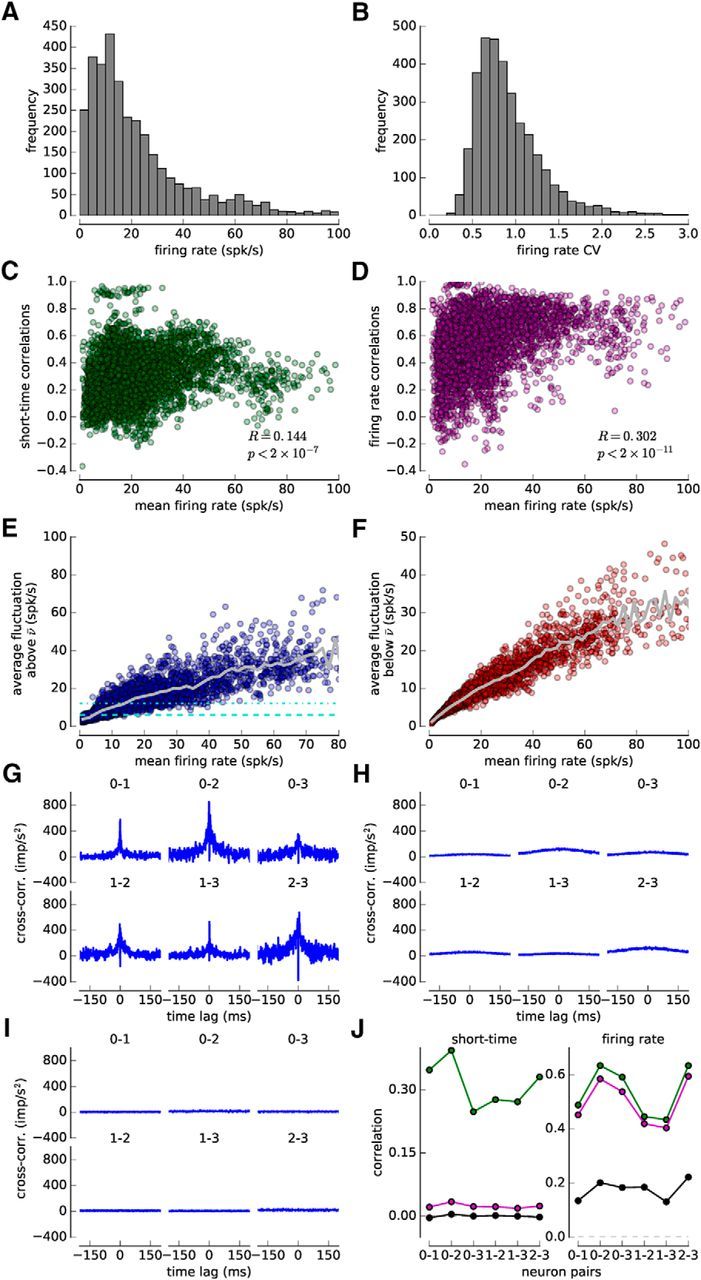
Properties of the spiking activity recorded in macaque monkeys. A, Distribution of single-unit firing rates (mean ± SD, 23.2 ± 22.0; 255 single units divided into 10-s-long epochs yielding N = 3360 entries). B, Distribution of the firing rate CV, that is, the SD of the firing rate variations (ν(t, J)) divided by the mean firing rate (mean ± SD, 0.92 ± 0.40). C, Mean firing rate of both units versus short-time correlations for all simultaneously recorded spike-pair (N = 3908 epochs with a duration of 10 s). The Pearson correlation coefficient R and the corresponding p value are shown. D, Mean firing rate of both units versus firing rate correlations for all simultaneously recorded spike-pairs (N = 3908 epochs with a duration of 10 s). The Pearson correlation coefficients R and the corresponding p value are shown. E, Average firing rate fluctuations above the mean for all epochs as a function of the mean firing rate, i.e., ν[ν > ν̄]. Gray line indicates the mean fluctuation. Turquoise dashed and dashed-dotted lines indicate average fluctuations of 6 and 12 spk/s, respectively. F, Average firing rate fluctuations below the mean firing rate, i.e., ν[ν < ν̄]. Same depiction as in E for firing rate excursions below the mean. G, Spike train cross-correlation functions of four simultaneously recorded example units. Four units yield six neuron pairs (neuron numbers per pair in panel). H, Average spike train cross-correlation functions of four simultaneously recorded example units after a short jitter of 80 ms. Applying a Gaussian jitter with zero mean and a SD of 80 ms eliminates short-time correlations on time-scales <80 ms. I, Average spike train cross-correlation functions of four simultaneously recorded example units after a long jitter of 1 s. Applying a Gaussian jitter with zero mean and a SD of 1 s eliminates short-time and firing rate correlations on time-scales <1 s. The average cross-correlograms after 100 jitters are shown for each neuron pair in H, I. J, Short-time (left) and firing rate (right) correlations for the four example units of G–I. Correlation coefficient of original recordings shown in green, after short jitter (SD, 80 ms) in magenta and after long jitter (SD, 1 s) in black. Magenta and the black points are averages of correlation coefficients calculated after applying the respective jitter 100 times.
The spiking activity of the recorded units is nonstationary and varies over a wide range of time-scales. Common activity changes induced by the stimulus presentations follow the experimental protocol (500 ms stimulus duration) and vary on the order of hundreds of milliseconds in response to stimulus onset and offset. Adaptation through varying amounts of attention and/or changes in the excitability of the local circuit results in a decrease in firing rate during the recording session and leads to activity changes on the order of tens of seconds. Coordinated changes in recorded spiking activity could in principle also occur from slow electrode drift.
We quantify firing covariations at short and long time-scales using spike-count correlations with different window lengths (Cohen and Kohn, 2011). To isolate activity covariations at a given time-scale, we used the jitter method (Fujisawa et al., 2008; Harrison and Geman 2009; Renart et al., 2010). The idea is to subtract from the spike count ni(t) the instantaneous mean firing rate ν(t,J) at time t, where the time-scale of the instantaneous mean firing rate is determined by J. The covariance between the spike counts of the two cells is as follows:
 |
where ni(t) = KT(t) * si(t) is the spike-count obtained by convolving the spike train si(t) with a normalized Gaussian kernel KT of width T = 20 ms. The instantaneous firing rate νi(t,J) is obtained through jittering the spike train by adding to each spike an independent Gaussian random variable of zero mean and SD J, which only eliminates correlations on time-scales ≪ J. As we are interested in correlations on the time-scale of T = 20 ms, we used J = 4T = 80 ms. Because we use both a Gaussian kernel KT(t) to convolve the spike train (ni(t;T) = KT(t) * si(t)) and a Gaussian distribution of jitter times, we calculated ν(t, J) by convolving the measured spike train si(t) with a normalized Gaussian kernel of SD (for more details, see Renart et al., 2010).
The normalized correlation coefficient is given by the following:
 |
The calculated correlation coefficients from Equation 23 are called short-time correlations (see Figs. 2C, 8B), and they are a measure of correlations at time-scales relevant for spike timing-dependent learning (e.g., see Figs. 3B,D, 4, STDP kernels).
We furthermore quantified covariations of the instantaneous firing rates by calculating the correlation coefficient as in Equation 23, but with the covariance between the instantaneous mean firing rate as given by the following:
which we call firing rate correlations (see Figs. 2D, 8B). Here, ν̄i and ν̄j are the mean activities. The distribution of the short-time and the firing rate correlations in the original data are shown in Figure 8B, and the cross-correlation functions of four simultaneously recorded units are shown in Figure 2G.
To assess the impact of short-time and firing rate correlations on synaptic changes, we selectively eliminate short-time and firing rate correlations through jittering. Applying an independent Gaussian jitter of zero mean and SD of 80 ms eliminates short-time correlations but largely preserves firing rate correlations (see Figs. 2H,J, 8B). A Gaussian jitter with a SD of 1 s abolishes short-time and greatly reduces firing rate correlations, in particular stimulus-induced firing rate variations (see Figs. 2I,J, 8B). We generated 100 surrogate datasets per jitter and imposed them on the two neurons. The synaptic changes after jittering shown in Figure 8C–E are the averaged across 100 final synaptic weights using the jittered spike data. Also, the short-time- and firing rate correlation coefficients after jittering are the average coefficients from the 100 surrogate spike trains (Fig. 8B).
Synaptic plasticity dynamics for correlated neurons.
The main aim of our study is to quantitatively compare the influence of firing rates and spike correlations on synaptic changes in irregularly firing neurons. Here we describe the mathematical framework that allows us to disentangle and compare the effects of firing rate and correlations. The general framework is independent of the considered plasticity model. Results for specific plasticity models are given in Analytical solutions of synaptic plasticity dynamics.
The synaptic efficacy w(T) at the end of a stimulation protocol of duration T is a random variable, the value of which depends on the learning rule, the precise realization of the presynaptic and postsynaptic spike trains, their firing rates, and their correlation. The average synaptic efficacy w̄(T) can be written as follows:
 |
where w̄no corr is the average synaptic efficacy attained for uncorrelated presynaptic and postsynaptic spike trains of rates νpre and νpost. The quantity w̄corr represents the additional change in synaptic efficacy induced by correlations between the presynaptic and postsynaptic spike trains. We call w̄corr the sensitivity of synaptic strength to correlations. This sensitivity to correlations depends both on the correlation function C(t) between the presynaptic and postsynaptic spike trains and individual firing rates of the neurons.
To quantify the influence of firing rates and spike correlations, we compare the sensitivity of synaptic strength with correlations to the sensitivity to firing rates δw̄no corr, defined as the change between the synaptic strength attained at a given, baseline presynaptic and postsynaptic firing rate, and the synaptic strength attained by increasing the firing rates by a given amount δν as follows:
 |
This sensitivity depends both on the baseline firing rates νpre,νpost, and the amount of increase in the firing rates δν.
The expression given in Equation 25 allows us to quantify the relative effect of firing rate and correlations by comparing the two functions w̄no corr(νpre,νpost,T) and w̄corr(νpre,νpost,c(t),T). It is fully general (in particular valid for any correlation function C(t) between the presynaptic and postsynaptic spike trains), but cumbersome to analyze. We therefore study Equation 25 in specific firing regimes (induced by different stimulation protocols), in which it simplifies and becomes easier to manipulate.
Irregular spike-pair correlations.
Irregular spike-pairs are generated using discretely correlated Poisson processes (see Case 1 in Firing patterns of mutually coupled neurons). In this case, the correlation function C(t) between the presynaptic and postsynaptic spike trains is given by the following:
 |
where p is the probability that a presynaptic spike induces a postsynaptic spike with delay Δ, and δ(t) is the Dirac δ function. The contribution of correlations to synaptic plasticity w̄corr is therefore a function of the time lag Δ and probability p, as well as of firing rates νpre and νpost. In that case, mathematical expressions for w̄corr can be derived for all plasticity models considered in this study (see Analytical solutions of synaptic plasticity dynamics).
If the probability p of adding a postsynaptic spike is small, wcorr is linear in p, so that Equation 25 can be rewritten as follows:
where
 |
We refer to the function κT(Δ) as the synaptic plasticity kernel. κT(Δ) depends on the firing rates νpre and νpost, and the protocol duration T. In the following, we do not indicate these dependencies explicitly.
Weak correlations of arbitrary shape.
We next turn to the case of a correlation function C(t) of arbitrary shape, but weak amplitude (C(t)≪1 for all t). To determine the effect of correlations on synaptic changes analytically, we approximate two integrate-and-fire neurons with a continuous correlation function C(t) by a linear superposition of discretely correlated Poisson processes with time lags Δ (Kempter et al., 1998; Gütig et al., 2003). In this approximation, the presynaptic spike train is assumed to be Poisson with rate νpre. Each presynaptic spike generates a postsynaptic spike at time lag Δ with probability p(Δ) = C(Δ)νpost. Additional uncorrelated postsynaptic spikes occur at a rate (1 − ∫dtC(t))νpost. If the correlations are weak, i.e., ∫dtC(t)≪1, the total synaptic change can be approximated by a sum of synaptic changes induced by discrete Poisson processes at a given time lag (Eq. 28) as follows:
 |
where κT(t) is the synaptic plasticity kernel introduced in Equation 29 for discretely correlated Poisson processes. Equation 30 shows that the influence of correlations on synaptic changes is fully specified by the knowledge of the correlation function and the plasticity kernel, as long as correlations are weak. Studying the effect of correlations on synaptic changes in discretely correlated Poisson processes is therefore highly informative on the effect of correlations on synaptic changes in general.
Correlations from common inputs.
As a specific example of weak correlations, we consider the case of integrate-and-fire neurons receiving a small fraction of common inputs. In that situation, the correlation function between the spike trains can be computed using the linear approximation (Ostojic et al., 2009) and reads as follows:
where the first term on the right-hand side is the correlation due to common inputs, and the two last terms are correlations due to direct connections from neuron 1 to neuron 2 and in the opposite direction. Analytic expressions for Cci(t) and Cconn(t) are given in Ostojic et al. (2009). In the above equation, the amplitudes of correlations due to the synaptic connections depend on the synaptic efficacies w̄1→2 and w̄2→1, so that w̄1→2 appears in both the left and right hand sides of Equation 30.
Assuming for simplicity that the inputs to the two neurons are identical, we have w̄2→1 = w̄1→2 = w̄ and ν1 = ν2 = ν. Inserting Equation 31 into Equation 30, we get the following:
where
 |
 |
Finally, Equation 32 can be used to determine self-consistently the synaptic efficacy at the end of the stimulation protocol as follows:
 |
In Equation 35, common inputs influence only w̄ci. As the correlation function Cci is proportional to the fraction of common inputs c, so is w̄ci. Using Equation 20, we then obtain a linear relation between w̄ci and the correlation coefficient ρ that determines the slope in Figure 6B.
Analytical solutions of synaptic plasticity dynamics.
In the previous section, we presented the mathematical framework used to quantify the relative effect of firing rates and correlations on synaptic changes, independently of the learning rule. Here we give analytical expressions for specific learning rules. For the pair- and triplet-based learning rules, the average synaptic weight at the end of the stimulation protocol (see Eq. 25) can be computed explicitly as function of the firing rates and the correlation function between the presynaptic and postsynaptic neurons. For the calcium-based learning rule, analytic expressions can be derived in the case of uncorrelated and discretely correlated Poisson processes. Those expression can be exploited to determine the plasticity kernel, which in turn allows us to use Equation 30 to determine the outcome of synaptic dynamics for arbitrary correlation functions.
Pair- and triplet-based learning rules.
Here we provide an analytical solution for the dynamics of w in the case of the triplet-based learning rule. The solution of the dynamics for the pair-based learning rule can be deduced as a special case by setting A3+ = 0. In that case, the asymptotic synaptic efficacy limT→∞w̄(T) is independent of mean firing rates (see Eq. 47), so that for the standard pair-based learning rule, mean firing rates affect only the transient dynamics of synaptic efficacy, and not its steady-state value.
For the plasticity rule defined in Equations 8 and 9, the dynamics of the average synaptic weight (Gjorgjieva et al., 2011) can be written as follows:
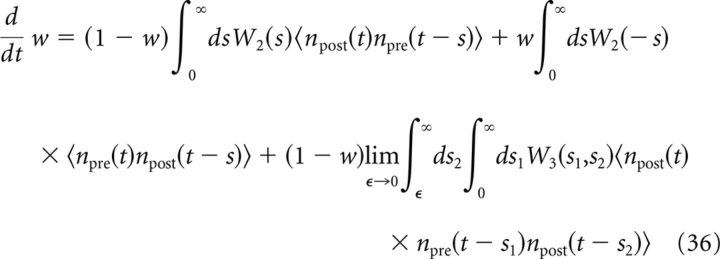 |
where npre(t) and npost(t) are the presynaptic and postsynaptic spike trains, brackets denote averaging over realizations, and the plasticity kernels are given by the following:
 |
and
The second- and third-order correlations between presynaptic and postsynaptic spike trains entering in Equation 36 can be expressed as follows:
 |
where C(t) is the cross-correlation function defined in Equation 17, Apost(t) denotes the auto-correlation of the postsynaptic spike train and C(3)(s1,s2) is the normalized third-order covariance, which will be neglected in the following.
Introducing
 |
 |
 |
Equation 36 reduces to the following:
 |
The solution of Equation 45 reads as follows:
where w0 is the value of the mean synaptic efficacy at the start of the stimulation protocol and
 |
 |
For the pair-based model (A3+ = 0), w̄∞ is independent of νpre and νpost as pointed out earlier.
For discretely correlated Poisson processes with time lag Δ and intensity ρ (see Case 1 in Firing patterns of mutually coupled neurons), the correlation function is given by the following:
 |
hence
 |
 |
While Equations 46 and 47 give the outcome of synaptic dynamics for arbitrary correlation functions, in practice analytical expressions for correlation functions are available only for weak correlations. In that limit, the synaptic efficacy at the end of the stimulation protocol is given by Equation 30 where w̄no corr(T) is the synaptic weight reached in absence of correlation as follows:
with wno corr∞ and τno correff obtained by setting C+ = 0, C− = 0 and C3 = 0 in Equation 47.
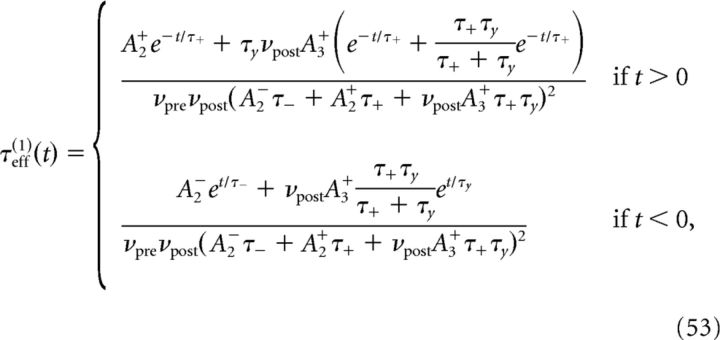
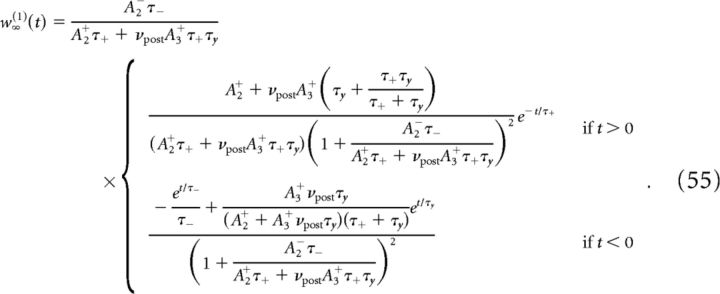
To determine the plasticity kernel κT(t), we compute the functional derivative of Equation 46 with respect to C(t), i.e., we linearize around w̄no corr(T) while taking C(t) = ϵδ(t − Δ). The expressions for C+, C− are then given by replacing p/νpost with ϵ in Equations 48 and 49. Expanding Equation 47 to first order in ϵ yields the following:
 |
with
 |
 |
 |
 |
Calcium-based learning rule.
The dynamics of the synaptic efficacy w in the calcium-based learning rule can be calculated analytically if single calcium transients induce small changes in the synaptic efficacy (Graupner and Brunel, 2012). In that case, Equation 10 can be approximated by an Ornstein-Uhlenbeck process, which is governed by the fraction of time the calcium transient spends above the potentiation and depression thresholds, αp and αd, respectively. The probability density function (pdf) of w is a time-dependent Gaussian as follows:
 |
where w0 is the initial value of w at t = 0. w̄ is the average value of w in the limit of a very long protocol equivalent to the minimum of the quadratic potential during the protocol, σw is the SD of w in the same limit, and τeff is the characteristic time-scale of the temporal evolution of the pdf of w as follows:
 |
 |
 |
Γp (Γd) is the potentiation (depression) rate multiplied by the average time spent above the potentiation (depression) threshold, i.e., Γp = γpαp (Γd = γdαd).
The fractions of time αp and αd the calcium transient spends above the potentiation and depression thresholds depend on the details of the stimulation protocol. In the case where the spike trains of presynaptic and postsynaptic neurons are uncorrelated Poisson processes, the amplitude distribution of the compound calcium trace has been calculated analytically for the linear calcium dynamics (Gilbert and Pollak, 1960). We extend this calculation to the case of discretely correlated Poisson processes. Details of the calculation are provided below.
One way of directly comparing the calcium- and the triplet-based models is to perform a Taylor expansion of Equations 57–59 in terms of presynaptic and postsynaptic firing rates (Kempter et al., 1998). The equation obtained for αp and αd in the calcium model (Eq. 66), however, appears not to be analytical around νpre = νpost = 0, and this precludes a direct analytical comparison between the two models.
Calcium amplitude distribution for spike-pair correlated neurons.
The calcium concentration of the linear calcium dynamics c(t) is a shot-noise process given by Equation 11. We compute the probability density P(c) of the postsynaptic calcium amplitude. To this end, we consider a surrogate point process that leads to a statistically equivalent shot-noise process. This surrogate point process is a Poisson process of rate νpre + νpost − pνpre. Each event generated by this Poisson process is randomly assigned to one of three classes: (1) presynaptic spike, (2) presynaptic with an associated postsynaptic spike at a time lag Δ, and (3) postsynaptic spike. Each event is independently assigned to one of these three classes with probabilities {p1,p2,p3}, where
 |
 |
 |
An event belonging to the class a, with a ∈ 1,2,3 generates a calcium transient F(a, t) where
 |
The calcium concentration c(t) can then be represented by a shot-noise process
 |
where {ti} is a Poisson process with rate n = νpre + νpost − pνpre and ai are random variables that take on one of three values {1, 2, 3}, chosen independently for each ti with probabilities {p1, p2, p3}.
Following Gilbert and Pollak (1960), the calcium distribution P(c) satisfies the following equation:
 |
where G(u) is the mean time F(a, t) spends above the level u (averaging over the random variable a). More precisely, if we introduce for each value of a the measure dga(u) defined such that the measure of the interval u1 < u ≤ u2 is equal to the Lebesgue measure of the set of times for which u1 < F(a,t) ≤ u2, then
 |
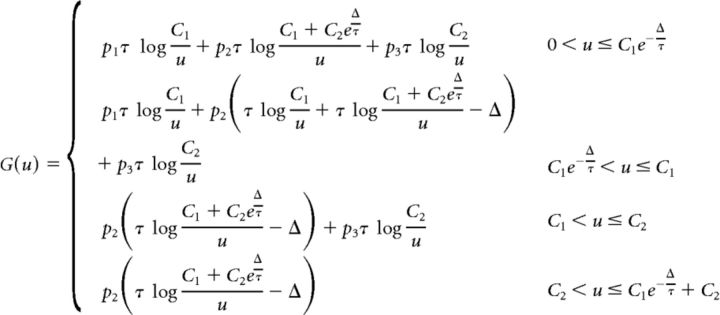
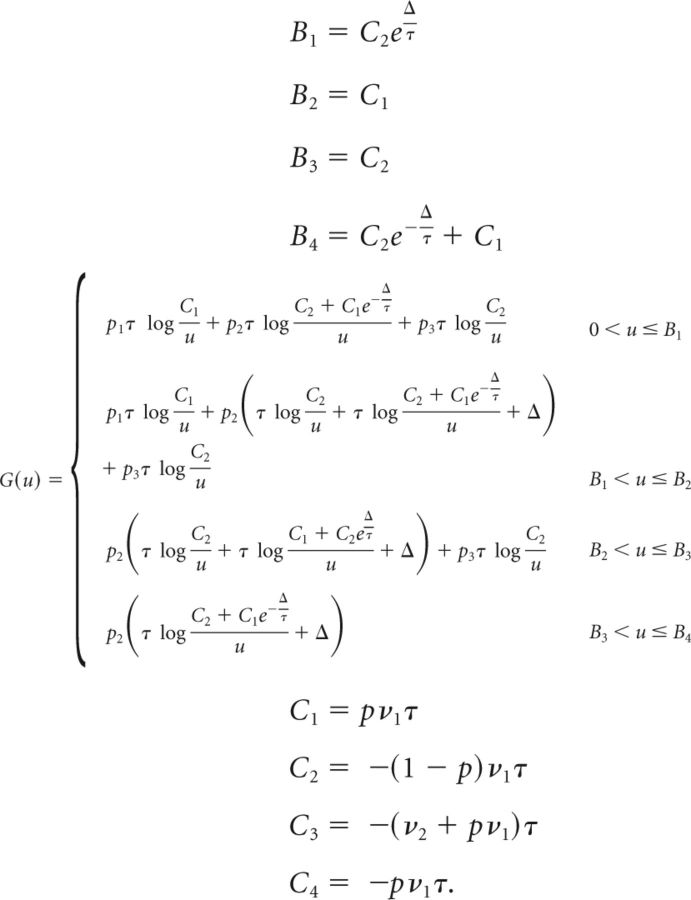
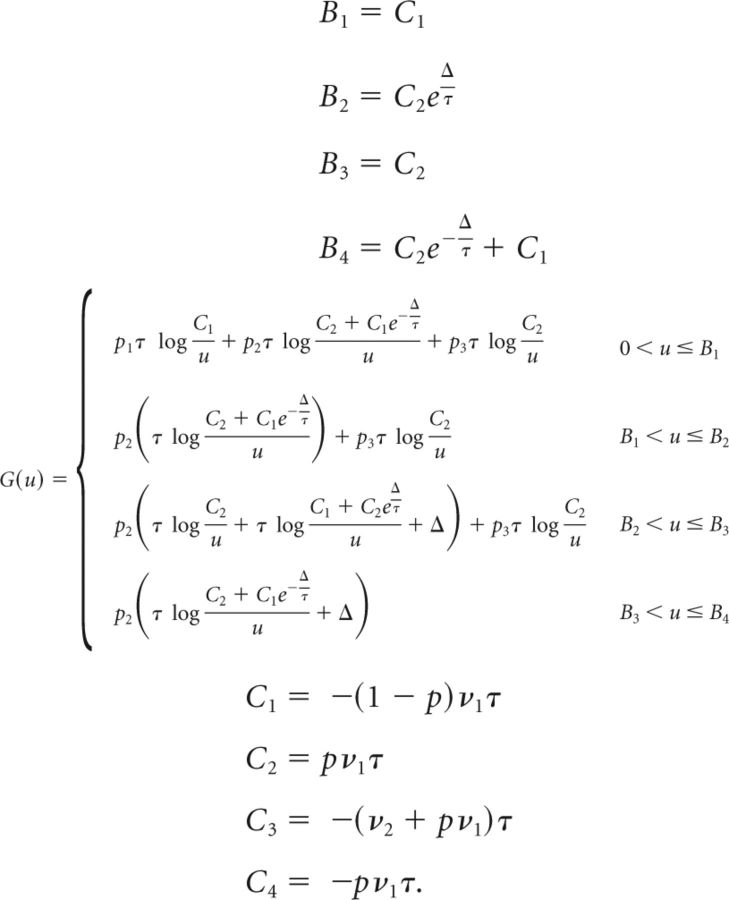
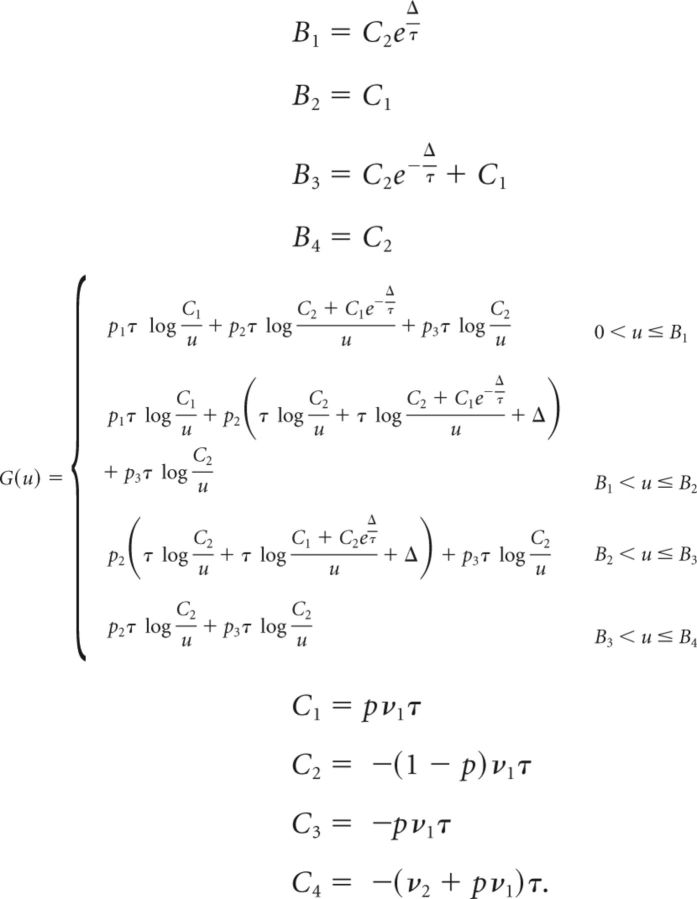
The explicit expression for G(u) depends on the precise value of the parameters Cpre, Cpost and Δ. From the obtained expression for G(u) (given below), the solution P(c) of Equation 64 can be shown to satisfy the following:
 |
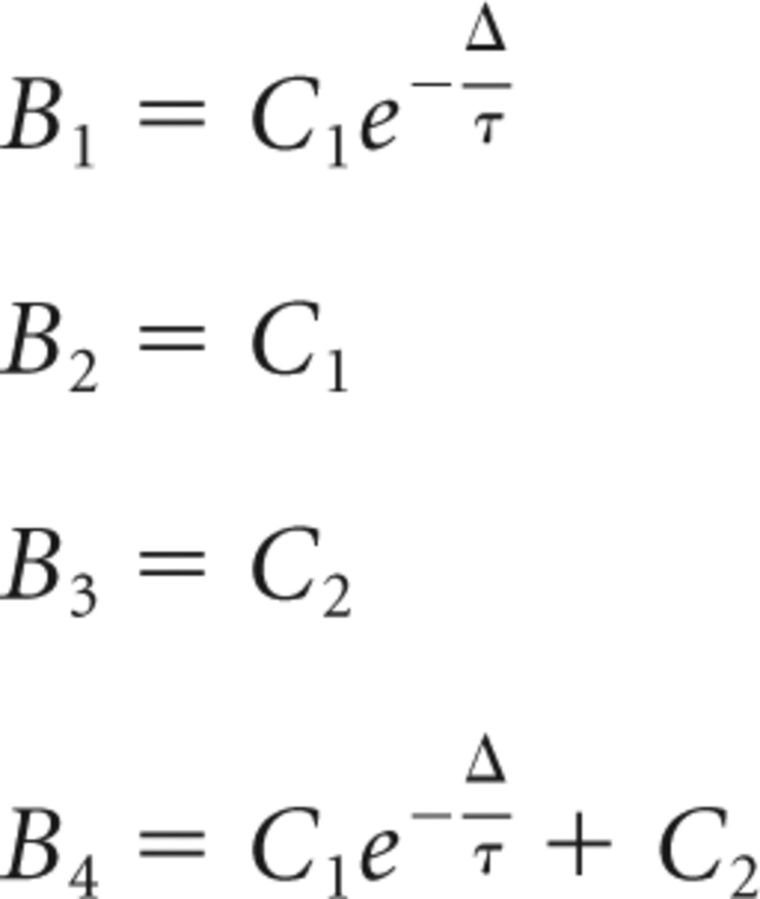
where Bi and Ci for i = 1 … 4 are constants (expressions given below). The calcium distribution is obtained from Equation 66 by numerical integration.
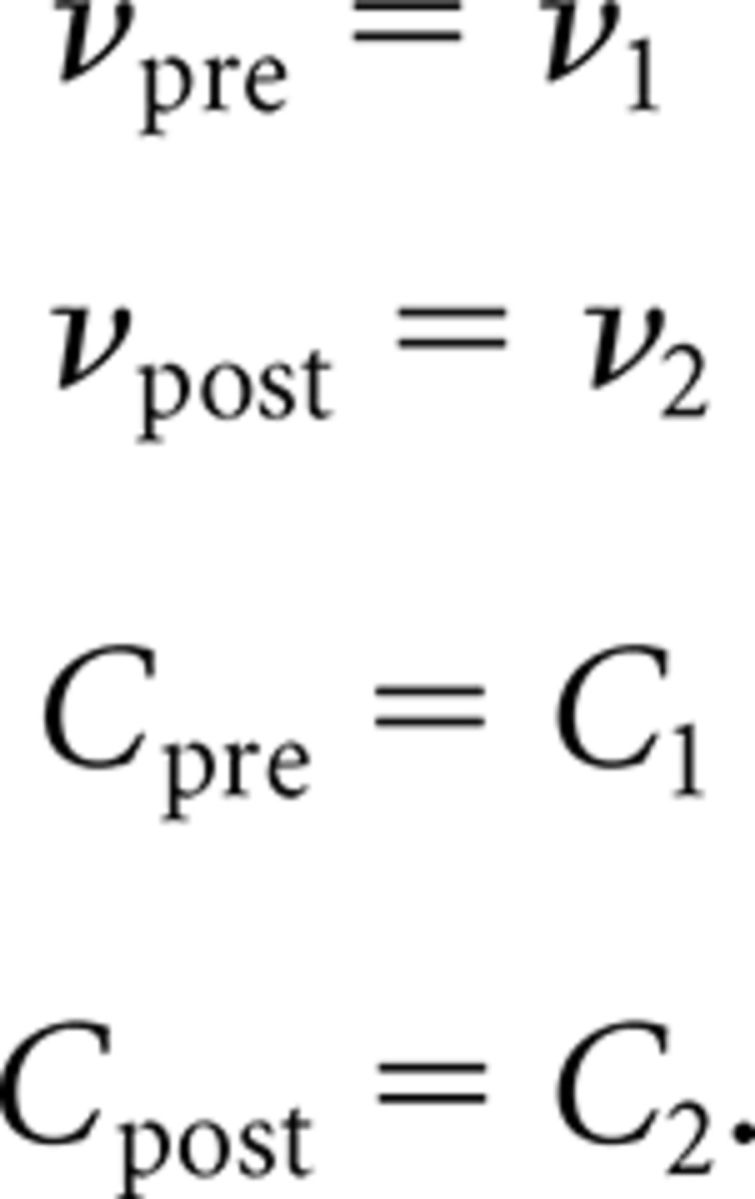
Below we give the full expressions of G(u), {Bi} and {Ci} in the relevant regions of the parameter space (we assume Cpre < Cpost). The full derivation of Equation 66 is given only for the first case (the derivation in the other cases is equivalent). To save space, we use the following abbreviations:
 |
Computation of G(u), {Bi} and {Ci} as follows:
- The derivative of G is then
so that Eq. (64) becomes
Differentiating with respect to c yields the following:
where
The solution of Equation 67 is then given by the following:

Results
To investigate synaptic changes elicited by in vivo-like irregular firing at different rates and realistic correlations between presynaptic and postsynaptic spikes, we used numerical simulations and mathematical analysis of a calcium-based model (Graupner and Brunel, 2010) and a triplet-based plasticity model (Pfister and Gerstner, 2006). To allow for comparison, the parameters of both models were fitted to plasticity results obtained in the visual cortex in vitro (Fig. 1; see Materials and Methods) (Sjöström et al., 2001). We considered three incrementally more realistic firing patterns: (1) irregular spike-pairs, (2) correlated spike trains generated by common inputs to the presynaptic and postsynaptic neurons, and (3) physiological firing patterns recorded in area MT of awake behaving macaque monkeys. For each case, we quantitatively compared synaptic modifications induced by changes in firing rate and by spike timing correlations for a stimulation with a fixed duration of 10 s, so that the total number of spikes varies with the firing rate.
Sensitivity to spike timing is reduced when spike-pairs occur irregularly
As a first step toward natural firing patterns, we studied plasticity induced by spike-pairs with fixed time lag between presynaptic and postsynaptic spikes but irregular occurrence (Fig. 3A). In that case, the presynaptic neuron is driven to fire a spike train with Poisson statistics, and the postsynaptic neuron fires a spike with time lag Δ before or after each presynaptic spike (Fig. 3A). Both the time lag and the firing rate were systematically varied, and the resulting synaptic changes were computed mathematically (see Materials and Methods).
We compared synaptic changes induced by irregular spike-pairs to those induced by regular spike-pairs used in classical STDP protocols. Two important distinctions clearly emerged: (1) the dependence on firing rate is different in the two protocols, with the irregular spike-pairs inducing less depression and more potentiation than regular pairs at intermediate firing rates (Fig. 3B,D; e.g., 5, 10, 20, 30 spk/s); and (2) the dependence on spike timing is different in the two protocols, the dependence of synaptic changes on the time lag being markedly reduced in the irregular protocol (Fig. 3B,D). These two effects are found both in the calcium- and triplet-based models, and to a much weaker extent in the classical spike-pair based model (Fig. 4). The analytical calculations of the change in synaptic strength (Figs. 3B,D, 4, lines) provides an excellent match to the simulations of the full models (Figs. 3B,D, 4, open circles), which greatly facilitates parameter exploration.
We characterized the dependence on firing rates using the baseline or average change in synaptic strength (Figs. 3B,C, 4, horizontal black line in the range bar on the right of each panel). The baseline is the change in synaptic strength at large time lags for irregular spike-pairs and the average change in synaptic strength for regular spike-pairs. For irregular spike-pairs, the baseline was elevated compared with regular spike-pairs (Fig. 3B,C). This elevation is explained by the occurrence of short interpair intervals in spike trains generated by a Poisson process even at low firing rates. Short interspike intervals, regardless of the time lag, induce potentiation in the calcium- and triplet-based models (Fig. 1A,B, stimulation with regularly spaced spike-pairs at 50 Hz). The difference in baseline/average strength vanishes at low firing rates, where the chance to observe short intervals is small, and at high firing rates, where both stimulation protocols contain short intervals (Fig. 3B,C).
To quantify the influence of the time lag on synaptic changes, we examined the variation around the baseline/average synaptic change (illustrated as vertical range bar on the right of each panel in Fig. 3B,C). In the irregular spike-pair protocol, this variation is reduced compared with the regular spike-pair protocol. The maximal and minimal synaptic changes with respect to the baseline/average are smaller for irregular spike-pairs in all models (Figs. 3B,C, 4). In all models, the reduction in plasticity amplitude is particularly strong for decreases with respect to baseline/average synaptic strength occurring at negative time lags (Figs. 3B,C, 4). This suggests that synaptic depression in particular requires the repeated, regular presentation of spike-pairs with fixed time lag. Interactions between irregularly-spaced spike-pairs with negative time lag destroy this requirement and almost completely abolish synaptic depression induced by post-pre spike-pairs.
So far, neurons were driven to fire irregularly, but every presynaptic spike was followed by a postsynaptic spike, leading to the strongest possible timing constraints (i.e., correlation coefficient ρ = 1 between presynaptic and postsynaptic spike trains). The obtained synaptic changes therefore provide an upper bound for the effect of spike timing on plasticity. To relax this strong timing constraint, we next allowed only a fraction p of presynaptic spikes to be followed by a postsynaptic spike after a fixed time lag Δ (Fig. 5A). For simplicity, we keep the overall firing rates of the two neurons equal by introducing a fraction 1-p of uncorrelated postsynaptic spikes (Fig. 5A). In this setting, the fraction p is equivalent to the correlation coefficient between the presynaptic and postsynaptic spike trains (ρ = p) and quantifies the strength of timing constraints. Decreasing p (i.e., ρ) from 1 (fully correlated spike trains) to 0 (uncorrelated spike trains) does not impact the shape of STDP curve but progressively decreases its magnitude (Fig. 3C,E). Realistic correlations range up to ρ = 0.4 (Cohen and Kohn, 2011), which corresponds to an ∼50% reduction of the synaptic changes relative to the upper bound given by ρ = 1 (Fig. 3C,E).
In summary, a simple modification of the standard spike timing stimulation protocol, consisting of presenting spike-pairs irregularly rather than periodically, strongly changes the dependence of synaptic changes on both firing rate and spike timing.
Synaptic changes induced by spike timing can be reproduced by varying the firing rate alone
We next asked how the magnitude of synaptic changes from spike-pair correlations compares with changes from increases in firing rate for uncorrelated presynaptic and postsynaptic neurons.
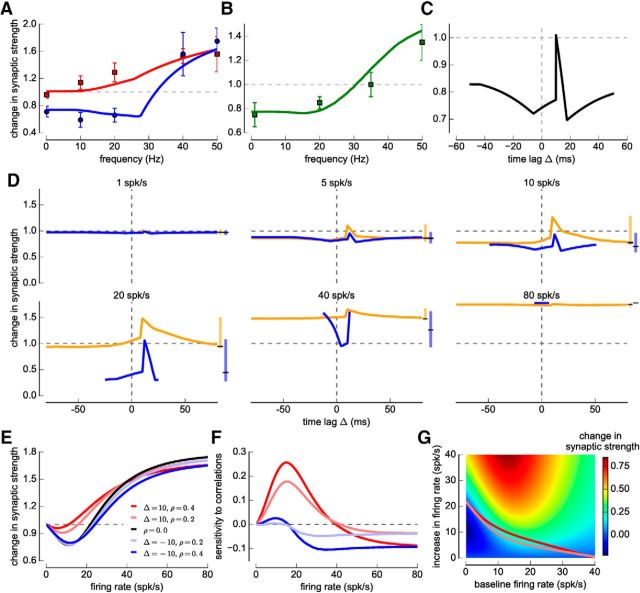
Increasing the rate of uncorrelated (ρ = 0), irregular firing in presynaptic and postsynaptic neurons gives a Bienenstock-Cooper-Munro-like curve (Bienenstock et al., 1982) in the calcium- and the triplet-based models: no synaptic change at low rates, depression at intermediate, and potentiation at high firing rates (Fig. 5B,C, black lines). The decrease in slope of change in synaptic strength versus firing rate beyond 20–30 spk/s is due to the multiplicative scaling of the learning rules. In contrast, synaptic changes in the classical pair-based model depend only weakly on firing rate: the equilibrium value of the synaptic strengths attained for a long induction protocol is independent of firing rate, but the timescale needed to reach this asymptote decreases with firing rate (Rubin et al., 2001), so that in a fixed-duration protocol used here (T = 10 s), the change in synaptic strength shows a weak dependence on firing rate (Fig. 5D, black line).
Adding spike-pair correlations with fixed positive time lags (ρ > 0 and Δ = 10 ms) increases synaptic strength (Fig. 5B–D) with respect to the uncorrelated case in all models, whereas correlations with short negative time lags decrease synaptic strength (Fig. 5B–D; e.g., Δ = −10 ms) in the triplet- and the pair-based models. Strikingly, in both calcium and triplet-based models, the magnitude of synaptic changes elicited by adding correlations can in most cases also be induced by increasing or decreasing the firing rates of both neurons in the absence of correlations (Fig. 5B,C). For instance, for the triplet-based model, the synaptic strength increase obtained by correlating spike trains at 20 spk/s (ρ = 0.4) is 0.28, and the same change in synaptic strength can be attained by increasing the firing rate in the absence of correlations to 35.3 spk/s (an increase by 76.5%; Fig. 5C). However, in the triplet model, correlations with negative time lags induce stronger synaptic depression than what can be reproduced by varying the firing rate of uncorrelated neurons alone.
To further contrast the variation of synaptic plasticity with respect to spike-pair correlations and firing rate, we systematically compared the change in synaptic strength induced by adding correlations to uncorrelated spike trains, to the change induced by a firing rate increase of uncorrelated neurons. We call those measures sensitivity to correlations or rate variations, respectively. The sensitivity to correlations is the difference in synaptic strength between the correlated and the uncorrelated value, for a given firing rate (for the definition, see Eq. 25; for an illustration, see Fig. 5C). The sensitivity to rate changes is the difference between the synaptic strength attained at a baseline firing rate and the synaptic strength attained by increasing the firing rate by a given amount (for the definition, see Eq. 26; for an illustration, see Fig. 5C). Both quantities depend on the starting or baseline firing rate of the neurons, and the sensitivity to correlations in addition depends on the time lag Δ and the correlation coefficient ρ (Fig. 5E–I). We did not calculate the sensitivity to rate changes for the pair-based model as the dependence on firing rate is very weak (see above).
The sensitivity of synaptic plasticity to spike-correlations reaches a maximum at low firing rates (∼12 spk/s for the calcium-, ∼17 spk/s for the triplet-, and ∼19 spk/s for the pair-based model) and decreases as the firing rates are increased further (Fig. 5E–G). Similarly, the sensitivity to rate changes displays a maximum at low firing rates and vanishes at high firing rates in the calcium- and the triplet-based models (Fig. 5H,I). Both models exhibit a good quantitative match in their sensitivities to rate changes (compare Fig. 5H and Fig. 5I). To quantitatively compare the effects of correlations and firing rates, we computed the amount of firing rate increase needed to reproduce the synaptic changes induced by correlations of a given strength (Fig. 5H,I, light and dark red lines). In the calcium-based model, the sensitivity to correlations vanishes at high firing rates; in turn, its relative influence compared with rate changes decreases with firing rate (Fig. 5H; see Discussion). Because the influence on plasticity of both correlations and firing rate covary with the baseline firing rate in the triplet-model, their relative impact remains approximately constant over a large range of firing rates in that case (most changes induced by spike timing correlations, ρ = 0.4, can be reproduced by increasing the firing rate by <16 spk/s; Fig. 5I).
Together, our results show that synaptic changes due to spike timing can in most cases be reproduced by varying the firing rate in the absence of constraints on spike timing. Correlations and rate changes both have a strong impact on synaptic plasticity at low baseline firing rates (<20 spk/s). As the baseline firing rates are increased, the impact of additional correlations or rate changes decreases.
Correlations due to common inputs
In physiological conditions, the timing between correlated presynaptic and postsynaptic spikes is variable, unlike the fixed-pair correlations considered in previous sections. We now turn to correlations generated by common inputs to presynaptic and postsynaptic neurons (Fig. 6A), a realistic source of correlations. We show that our central finding obtained for fixed-pair correlations directly extends to this case: the effects of pre-post correlations on synaptic plasticity can be reproduced by a modest variation of the firing rates in absence of correlations.
We consider two integrate-and-fire neurons mutually coupled by plastic synapses (Fig. 6A). The two neurons receive fluctuating inputs mimicking the barrage of synaptic inputs neurons receive in vivo. A fraction of this input is shared between the two neurons, the remaining part being independent (de la Rocha et al., 2007). Varying the fraction of shared input allows us to vary the amplitude of the correlation between the two neurons without changing their firing rates, which can be controlled independently. We again compare the effects of correlations and firing rate on synaptic changes.
Increasing the fraction of common inputs increases the correlation coefficient between presynaptic and postsynaptic spike trains and leads to a change in synaptic strength (Fig. 6B). The relationship between the correlation coefficient and the induced synaptic change appears to be approximately linear over a large range (for illustration, see Fig. 6B), and the corresponding slope can be mathematically computed for the models studied here (see Materials and Methods). This slope is determined by two factors: (1) the correlation function between presynaptic and postsynaptic spike trains (Fig. 6A, right); and (2) and the effective STDP kernel determined by correlations from spike-pairs with fixed time lag (Fig. 3B,D). Both of these quantities depend on the firing rate, which therefore influences the slope of the dependence between correlations and synaptic changes. The range of correlation coefficients over which the linear approximation is accurate depends on the model considered (Fig. 6B).
In the absence of common inputs, the change in synaptic strength as a function of the firing rate of the two connected neurons follows a Bienenstock-Cooper-Munro-like profile similar to uncorrelated neurons firing Poisson spike trains for the calcium- and the triplet-based models (Fig. 6C,D; compare Fig. 5B,C). Increasing the fraction of common inputs results generally in an increase of synaptic changes. As before, an equivalent increase can be induced by increasing the firing rates of the two neurons in the absence of common inputs in the calcium-based and the triplet-based model (Fig. 6C,D) but not in the pair-based model as explained in the previous section (Fig. 6E).
The sensitivity of synaptic changes to common inputs (Eq. 25) and firing rate variations (Eq. 26) in the calcium-based and triplet-based models shows a behavior similar to the one found for fixed time lag correlations (compare Fig. 6F,G,I,J and Fig. 5E,F,H,I): synaptic changes exhibit maximum sensitivity to common inputs and firing rate variations at low baseline firing rates, and both sensitivities decrease with increasing firing rate (Fig. 6F,G,I,J). Quantitatively, the sensitivity to rate changes is nearly matched between the calcium- and the triplet-based models (Fig. 6I,J). The only notable difference between the two models appears in the sensitivity to correlations at high firing rates (compare Fig. 6F and Fig. 6G), as this sensitivity vanishes in the calcium-based model for firing rates >40 spk/s.
So far, we focused on the situation in which presynaptic and postsynaptic firing rates are equal, but our analysis can easily be extended to the more general case of different presynaptic and postsynaptic activities. In absence of correlations, the amount of synaptic change depends mainly on the postsynaptic firing rate in both calcium-based and triplet-based models (Fig. 7A). Adding correlations increases the synaptic strength. This additional increase is the strongest when either the presynaptic or the postsynaptic firing rate is low (Fig. 7B). To compare the effects of correlations and firing rates, we computed the amount of firing rate increase in both presynaptic and postsynaptic neurons needed to reproduce the synaptic changes induced by correlations corresponding to a correlation coefficient ρ = 0.4 (Fig. 7C). The amplitude of the equivalent firing rate increase is comparable with the equal baseline firing rate case considered above (νpre = νpost) for most values of presynaptic and postsynaptic firing rates, except for a region at low presynaptic and high postsynaptic firing rates in the triplet model where a large equivalent increase in firing rate is required (it does not exceed 15 spk/s for the calcium-based model, and 20 spk/s for the triplet-based model; Fig. 7C).
In summary, our findings for fixed-pair correlations directly extend to the case of correlations from common inputs: synaptic changes due to pre-post correlations can be reproduced by a modest variation of the firing rates in absence of correlations. Indeed, we expect this result to hold for any type of correlations between presynaptic and postsynaptic spike trains regardless of origin, as changes in response to weak correlations of any type can be mathematically derived from the case of fixed-pair correlations considered above (see Materials and Methods).
Natural firing patterns
Our interest ultimately lies in understanding how naturally occurring firing patterns shape synaptic plasticity. We therefore used single-unit activities recorded simultaneously in cortical area MT of awake macaque monkeys to drive plasticity changes in models of synaptic plasticity. An important difference with the previous stimulation protocols is the nonstationary nature of the monkey data. Indeed, pairwise correlations occur on a range of time-scales in the data, and we investigated their respective influence on the change in synaptic strength. The spiking data are not recorded during a learning task per se, and we are not aware of any plasticity data from monkey area MT comparable with Sjöström et al. (2001); instead, we use the spiking as a proxy for highly dynamic activity potentially occurring during learning.
Single-unit activity was recorded in the cortical area MT while monkeys watched moving dots stimuli (Figs. 2, 8A; see Materials and Methods). Post hoc spike sorting led to the separation of 2–4 independent units, and pairs of simultaneously recorded units exhibited firing correlations on different time-scales: (1) correlations on short time-scales <80 ms that are relevant for STDP; we refer to those as short-time correlations (mean ± SD, 0.304 ± 0.183; Figs. 2, 8B); and (2) covariations over longer time-scales (>80 ms); we refer to those as firing rate correlations (mean ± SD, 0.5504 ± 0.221; Figs. 2, 8B; see Materials and Methods).
To disentangle the effect of short-time and firing rate (long timescale) correlations on synaptic plasticity, we apply two Gaussian jitters to the spike trains: (1) a short jitter with 80 ms SD, which selectively removes short-time correlations but leaves firing rate correlations intact; and (2) a long jitter with 1 s SD, which additionally strongly reduces firing rate correlations (Figs. 2G–J, 8B; see Materials and Methods).
Two mutually connected model neurons were exposed to the recorded spike trains as well as to jittered spike train surrogates. Synaptic changes for similar mean firing rate over 10 s firing epochs exhibited large fluctuations due to heterogeneous firing rates of presynaptic and postsynaptic neurons, varying amounts of firing rate fluctuations and a wide range of correlations (Fig. 2A–D). Despite the variability, the average change in synaptic strength showed a marked dependence on the mean firing rate in both the calcium- and the triplet-based models (Fig. 8C,D), whereas the mean synaptic strength did not depend on the firing rate in the pair-based model, as previously noted (Fig. 8E).
Short-time correlations induced potentiation in all models. Removing such short time-scale correlations reduced synaptic strength, resulting on average in positive sensitivity to short-time correlations (Fig. 8F–H, green lines). Firing rate fluctuations around the mean rate during the 10 s epoch induce on average potentiation, leading to a positive sensitivity to firing rate correlations in the calcium- and triplet-based models but have no effect in the pair-based model (Fig. 8F–H, magenta lines). As before, the sensitivity to short-time correlations and firing rate correlations (for calcium- and triplet-based models) both exhibit a maximum at intermediate firing rates and decreases at high rates (Fig. 8F–H). The sensitivity to short-time correlations and firing rate correlations exhibit similar amplitudes across all firing rates in the calcium- and the triplet-based model (Fig. 8F,G, compare magenta and green lines), implying that temporal variations in the instantaneous firing rate have quantitatively the same effect on plasticity as correlations of spike times on a short time-scale.
Synaptic changes induced through short-time- and firing rate correlations are both small compared with those induced by a modification of the mean firing rate in the calcium- and the triplet-based models (Fig. 8I,J). Similarly to the sensitivity to short-time and firing rate correlations, modifications of mean firing rates induce large synaptic changes at low baseline firing rates, and their impact decreases at high baseline rates (Fig. 8I,J). Strikingly, a 6 spk/s increase in mean firing rates alone is sufficient to reproduce changes from short-time and firing rate correlations in the calcium-based model (except for very low baseline firing rate), whereas a 12 spk/s increase in mean firing rate captures those changes in the triplet-based model (Fig. 8I,J). In the data, an average firing rate fluctuation above mean >6 spk/s (12 spk/s) occurs for mean rates >3 spk/s (13 spk/s) (Fig. 2E), illustrating that typical firing rate fluctuations are much larger than what would be required to account for synaptic changes from correlations.
Consistent with our results for numerically generated, irregular spike trains, we find that, for natural spike trains, synaptic changes induced by timing constraints between spikes can be equivalently induced by a modest increase in mean firing rates. The magnitude of synaptic changes induced by timing constraints is moreover quantitatively similar to synaptic changes due to firing rate fluctuations.
Calcium-based model with nonlinear calcium dynamics
In the calcium-based model, synaptic changes are driven by presynaptically and postsynaptically evoked calcium influx. Up to this point, we considered a simplified model of the calcium dynamics in which calcium transients elicited by presynaptic and postsynaptic spikes sum linearly. Could a more realistic, nonlinear calcium dynamics, mediated by the coincidence-dependent NMDAR current, enlarge the effect of synchronous inputs and therefore increase the impact of spike timing on plasticity? To answer this question, we examined a nonlinear calcium dynamics implementation that includes a coincidence-dependent NMDAR current. Here we show that our main results do not depend on the implementation of the calcium dynamics.
In the nonlinear calcium implementation, the calcium transient elicited by a postsynaptic spike consists of two components (see Materials and Methods): (1) a voltage-dependent calcium channel-mediated part; and (2) a nonlinear NMDA part controlled by a parameter that characterizes the increase of the NMDA mediated current in case of coincident presynaptic activation and postsynaptic depolarization. The calcium transient elicited by a presynaptic spike remains unchanged and has the amplitude Cpre.
To compare the results of the calcium-based model from the “nonlinear calcium dynamics” with the “linear calcium dynamics,” we first fit the calcium-based model to the Sjöström et al. (2001) datasets using the nonlinear calcium dynamics (Fig. 9A,B). Interestingly, the calcium-based model with the nonlinear calcium implementation provides the best fit of the regular- and jittered spike-pairs presented at different frequencies compared with the calcium-based model with linear calcium dynamics and the triplet-based model (compare Fig. 9A,B with Fig. 1A,B).
We then compared the STDP curves for regular- and irregular spike-pairs at different rates (Fig. 9D). As before, we furthermore varied the firing rate for a given Δ and correlation between prespikes and postspikes to quantitatively compare the impact of firing rate changes and correlations on synaptic changes (Fig. 9E). Strikingly, despite the fact that the detailed shape of the STDP curve is different in the calcium-based model with nonlinear calcium dynamics, the conclusions drawn previously do not depend on the implementation of the calcium dynamics. When comparing synaptic changes induced by irregular spike-pairs with those induced by regular spike-pairs: (1) irregular spike-pairs induce less depression and more potentiation than regular spike-pairs; and (2) the influence of spike timing is reduced for irregular spike-pairs compared with regular spike-pairs (compare Fig. 9D and Fig. 3B). The sensitivity to correlations reaches a peak at low firing rates (∼15 spk/s) and decreases as the firing rates are increased further (Fig. 9F). Similarly, the sensitivity to rate changes displays a maximum at low firing rates and decreases at high firing rates (Fig. 9G). The results for the nonlinear calcium model are therefore qualitatively similar to the calcium-based model with linear calcium dynamics and the triplet-based model. Quantitatively, the magnitude of the sensitivity to correlations is similar to the triplet-based model (compare Fig. 9F and Fig. 5F) at low (<20 spk/s) firing rates, whereas it vanishes at high firing rates as in the calcium-based model variant with linear calcium dynamics (compare Fig. 9F and Fig. 5E).
In summary, the extension of the model by a nonlinear version of the calcium dynamics demonstrates that the conclusions drawn on the overall reduction in sensitivity to spike timing correlations in the calcium-based model does not depend on the calcium implementation.
Discussion
Combining numerical simulations with mathematical analyses of synaptic plasticity models, we have examined the effect of in vivo-like, irregular spiking activity on synaptic changes. We have characterized the spiking activity in terms of two basic statistical properties, the firing rate, and the correlations between presynaptic and postsynaptic spike trains that quantify the spike timing constraints. Our overarching finding is that synaptic changes induced by realistic correlation strengths can in most cases be reproduced by a modest variation of the firing rates alone. These results call into question the dominant role of spike timing for long-term synaptic plasticity in natural conditions, and suggest a more nuanced picture in which depending on spike rate and irregularity both firing rate and correlations shape synaptic changes with variable influence.
Generality of the findings
Our central finding (that synaptic change from correlations can be attained by uncorrelated firing rate variations) holds for both firing rate-dependent plasticity models investigated here: the calcium-based and the triplet-based models. The parameter values in these models were determined from fits to cortical plasticity data (Sjöström et al., 2001). Qualitatively, our findings, however, do not depend on the precise parameter values. Numerical simulations show that our results also extend to other models, such as the voltage-based plasticity rule by Clopath et al. (2010). Generally, the sensitivity of synaptic plasticity to firing rate changes and correlations decrease as the firing rate is increased in multiplicative update schemes of synaptic strength, such as used here. Quantitatively, we find that the experimental data constrained the models to yield very similar sensitivities to rate changes (Figs. 5H,I, 6I,J, 8I,J). Differences between the models emerged with respect to the sensitivities to correlations: (1) The triplet-based model is up to two times more sensitive to correlations at intermediate firing rates (depending on the stimulation protocol; see Figs. 5E,F, 6F,G, 8F,G) than the calcium-based model with linear calcium dynamics (the magnitudes nearly match when comparing triplet-based model and the nonlinear calcium dynamics variant; Figs. 5F, 9F). (2) The sensitivity to correlations vanishes in the calcium-based model at high firing rates (Figs. 5E, 6F, 8F, 9F). This latter difference stems from the fundamentally dissimilar approach to link spikes with synaptic changes in both models. In the triplet-based model, the depression and potentiation rates are determined by the statistics of doublets and triplets of spikes. In contrast, the thresholding of calcium to determine potentiation and depression strength in the calcium-based model reduces sensitivity to the statistics of the spike train at high firing rates. We expect the same reduction in sensitivity to correlations to occur in models involving the thresholding of calcium (e.g., Shouval et al., 2002; Rubin et al., 2005; Urakubo et al., 2008).
Comparing the effects of spike timing and rate
Our aim was to determine the respective influences of spike timing and firing rate on synaptic plasticity in natural spike trains. The typical values of firing rates and spike-time correlations, however, vary strongly between species, cortical regions, behavioral conditions, and even between neighboring neurons (Cohen and Kohn, 2011; Buzsáki and Mizuseki, 2014) and are constantly reevaluated as recording techniques evolve. The primate data used here lie at the higher end of the spectrum both in terms of maximal firing rates and correlations attained. Firing rates attain up to 25 spk/s in visual cortex (Livingstone and Hubel, 1981), <5 spk/s in the auditory cortex (Edeline et al., 2001), and <1 spk/s in the barrel subfield of the somatosensory cortex (Crochet and Petersen, 2006). In turn, plasticity induction rules might be adapted to the prevalent firing rate, with spike timing-based learning playing a key role in structures exhibiting low firing rates (Celikel et al., 2004). However, low rates necessarily imply low spike-time correlations (de la Rocha et al., 2007), and this is the case in the barrel cortex (Celikel et al., 2004), so that very small changes in firing rates might suffice to produce plastic changes comparable with those obtained from correlations. According to our results, the impact of correlations on plasticity might also be dominant in structures exhibiting more regular firing, or spiking linked to the θ rhythm, such as in the hippocampus (Buzsáki and Draguhn, 2004). Ultimately, to conclusively compare the effects of spike timing and rate among structures and species, we would need to know plasticity parameters for the different systems in addition to the activity statistics. The available plasticity data points to large variations of the shapes of STDP curves, the magnitude of changes and processes underlying plasticity between regions, species, and even synapse types. To which extent and in which manner this variability in plasticity is matched to statistics of activity is currently not clear.
Experimental predictions
A few experimental studies explored cortical plasticity in response to irregular firing patterns. By jittering presynaptic and postsynaptic spikes in a spike-pair protocol, LTD was induced at low presentation rates and LTP at high rates in synapses between layer V neurons in the visual cortex (Sjöström et al., 2001). Repeated presentations of 1-s-long spike trains recorded in the visual cortex in vivo from L2/3 neurons with partially overlapping receptive fields evoked plasticity, which could be predicted based on the spike timing relationships between presynaptic and postsynaptic spikes (Froemke and Dan, 2002). Furthermore, AP time series recorded simultaneously from hippocampal place cells in freely moving rats were replayed at CA1 synapses and shown to induce LTP (Isaac et al., 2009). However, a systematic comparison between the effects on synaptic changes of firing rate and spike timing in irregular spike trains has not been experimentally performed, to our knowledge. Our study suggests that an optimal protocol would consist of Poisson distributed spike-pairs at various frequencies (Fig. 3), as the effect of more general correlations can be deduced from this specific case. Other factors in addition to irregular spiking patterns, such as the high-conductance state of neurons (Rudolph et al., 2005; Delgado et al., 2010), inhibition often blocked in in vitro studies (Schulz et al., 2010), neuromodulation (Pawlak et al., 2010), and changes in extracellular calcium concentration (Higgins et al., 2014), might further complicate the extrapolation from in vitro plasticity results to the in vivo situation.
Spike timing as a ground rule for synaptic plasticity
From a theoretical standpoint, the experimental evidence for STDP (Magee and Johnston, 1997; Markram et al., 1997; Bi and Poo, 1998) led to the proposal that spike timing constitutes a ground rule for synaptic plasticity (but see Shouval et al., 2010). That proposal was embodied in the standard pair-based plasticity rule (Kempter et al., 1998; Song et al., 2000; Rubin et al., 2001). Although the simplicity of that rule is extremely appealing, the pair-based rule is anomalous in the sense that it depends mainly on the second-order correlations of spike trains, but only weakly on the first-order statistics (i.e., their firing rates: a possible resolution is the nearest-neighbor implementation of the pair-based rule (Izhikevich et al., 2003)). The lack of firing rate dependence in the all-to-all pair-based model leads to an inflated sensitivity to correlations and challenges its common use for network plasticity studies. More generally, experimental data have shown that plasticity depends on both first-order (firing rate) and second-order spiking statistics (spike timing correlations). We find for the calcium- and triplet-based models, two very different instances of learning rules, that second-order statistics (correlations) have second-order effects on the plasticity outcome with respect to firing rate.
Implications for network dynamics
Theoretical studies have extensively used spike-based plasticity rules to model learning in networks of neurons. Understanding the effect of these rules on the dynamics of recurrent networks is challenging because of the complex interplay between synaptic and neural dynamics. Our results suggest a possible way forward. In a majority of network models, the dynamics are dominated by firing rate changes, while the spike-time correlations are often small (Renart et al., 2010). In such a situation, plastic changes are largely determined by variations in firing rates, and the interplay between plasticity and network dynamics could be amenable to analysis in the framework of mean-field theory based on time-varying firing rates (Brunel, 2000).
By dissecting the influence of firing rate and spike timing on synaptic plasticity, we aimed here to provide a conceptual link between in vitro plasticity results and in vivo firing patterns. As the majority of existing studies, here we assessed the effects of activity on plasticity by looking at an individual synapse. The strength of a single synapse, however, is not necessarily a good measure for the efficiency of learning, as large effects on network activity could be generated by a conjunction of many weak changes at the level of individual synapses (see, e.g., Yger et al., 2015). Ultimately, the quantity of interest is the pattern of synaptic changes at the network level, and the main question is how this pattern is translated into behaviorally relevant motifs of neural activity (Bienenstock et al., 1982; Gjorgjieva et al., 2011). Relating network-wide synaptic changes with network activity under natural conditions is currently challenging, both from an experimental and theoretical point of view. Recent experiments that track network activity during learning using calcium imaging (Kato et al., 2015; Makino and Komiyama, 2015; Poort et al., 2015) may provide an important foray in this direction. Theoretically, the framework developed here to link natural firing patterns and plasticity should facilitate the study of plasticity at the network level.
Footnotes
M.G. was supported by Alexander von Humboldt Foundation Feodor Lynen Research Fellowship, National Institutes of Health DC005787-01A1, and École des Neurosciences Paris Île-de-France post-doc Fellowship. This work was indirectly supported by National Eye Institute Grant EY-13138 to David C. Bradley, which funded the laboratory in which the visual area MT responses were collected. S.O. was supported by ANR-11-0001-02 PSL, ANR-10-LABX-0087, and the City of Paris through the program Emergences. We thank Jesper Sjöström for providing data; Arnd Roth for many helpful discussions (with M.G.) in an early stage of the project; David C. Bradley and his laboratory for giving the opportunity (to P.W.) to perform the monkey experiments; and Nicolas Brunel for carefully reading the manuscript and providing helpful comments.
The authors declare no competing financial interests.
This is an Open Access article distributed under the terms of the Creative Commons Attribution License Creative Commons Attribution 4.0 International, which permits unrestricted use, distribution and reproduction in any medium provided that the original work is properly attributed.
References
- Bi G, Poo MM. Synaptic modification by correlated activity: Hebb's postulate revisited. Annu Rev Neurosci. 2001;24:139–166. doi: 10.1146/annurev.neuro.24.1.139. [DOI] [PubMed] [Google Scholar]
- Bi GQ, Poo MM. Synaptic modifications in cultured hippocampal neurons: dependence on spike timing, synaptic strength, and postsynaptic cell type. J Neurosci. 1998;18:10464–10472. doi: 10.1523/JNEUROSCI.18-24-10464.1998. [DOI] [PMC free article] [PubMed] [Google Scholar]
- Bienenstock EL, Cooper LN, Munro PW. Theory for the development of neuron selectivity: orientation specificity and binocular interaction in visual cortex. J Neurosci. 1982;2:32–48. doi: 10.1523/JNEUROSCI.02-01-00032.1982. [DOI] [PMC free article] [PubMed] [Google Scholar]
- Brunel N. Dynamics of sparsely connected networks of excitatory and inhibitory spiking neurons. J Comput Neurosci. 2000;8:183–208. doi: 10.1023/A:1008925309027. [DOI] [PubMed] [Google Scholar]
- Buzsáki G, Draguhn A. Neuronal oscillations in cortical networks. Science. 2004;304:1926–1929. doi: 10.1126/science.1099745. [DOI] [PubMed] [Google Scholar]
- Buzsáki G, Mizuseki K. The log-dynamic brain: how skewed distributions affect network operations. Nat Rev Neurosci. 2014;15:264–278. doi: 10.1038/nrn3687. [DOI] [PMC free article] [PubMed] [Google Scholar]
- Campanac E, Debanne D. Spike timing-dependent plasticity: a learning rule for dendritic integration in rat CA1 pyramidal neurons. J Physiol. 2008;586:779–793. doi: 10.1113/jphysiol.2007.147017. [DOI] [PMC free article] [PubMed] [Google Scholar]
- Celikel T, Szostak VA, Feldman DE. Modulation of spike timing by sensory deprivation during induction of cortical map plasticity. Nat Neurosci. 2004;7:534–541. doi: 10.1038/nn1222. [DOI] [PMC free article] [PubMed] [Google Scholar]
- Clopath C, Büsing L, Vasilaki E, Gerstner W. Connectivity reflects coding: a model of voltage-based STDP with homeostasis. Nat Neurosci. 2010;13:344–352. doi: 10.1038/nn.2479. [DOI] [PubMed] [Google Scholar]
- Cohen MR, Kohn A. Measuring and interpreting neuronal correlations. Nat Neurosci. 2011;14:811–819. doi: 10.1038/nn.2842. [DOI] [PMC free article] [PubMed] [Google Scholar]
- Cohen MR, Maunsell JH. Attention improves performance primarily by reducing interneuronal correlations. Nat Neurosci. 2009;12:1594–1600. doi: 10.1038/nn.2439. [DOI] [PMC free article] [PubMed] [Google Scholar]
- Crochet S, Petersen CC. Correlating whisker behavior with membrane potential in barrel cortex of awake mice. Nat Neurosci. 2006;9:608–610. doi: 10.1038/nn1690. [DOI] [PubMed] [Google Scholar]
- de la Rocha J, Doiron B, Shea-Brown E, Josić K, Reyes A. Correlation between neural spike trains increases with firing rate. Nature. 2007;448:802–806. doi: 10.1038/nature06028. [DOI] [PubMed] [Google Scholar]
- Delgado JY, Gómez-González JF, Desai NS. Pyramidal neuron conductance state gates spike timing-dependent plasticity. J Neurosci. 2010;30:15713–15725. doi: 10.1523/JNEUROSCI.3068-10.2010. [DOI] [PMC free article] [PubMed] [Google Scholar]
- Dudek SM, Bear MF. Homosynaptic long-term depression in area CA1 of hippocampus and effects of N-methyl-D-aspartate receptor blockade. Proc Natl Acad Sci U S A. 1992;89:4363–4367. doi: 10.1073/pnas.89.10.4363. [DOI] [PMC free article] [PubMed] [Google Scholar]
- Edeline JM, Dutrieux G, Manunta Y, Hennevin E. Diversity of receptive field changes in auditory cortex during natural sleep. Eur J Neurosci. 2001;14:1865–1880. doi: 10.1046/j.0953-816x.2001.01821.x. [DOI] [PubMed] [Google Scholar]
- Froemke RC, Dan Y. Spike timing-dependent synaptic modification induced by natural spike trains. Nature. 2002;416:433–438. doi: 10.1038/416433a. [DOI] [PubMed] [Google Scholar]
- Fujisawa S, Amarasingham A, Harrison MT, Buzsáki G. Behavior-dependent short-term assembly dynamics in the medial prefrontal cortex. Nat Neurosci. 2008;11:823–833. doi: 10.1038/nn.2134. [DOI] [PMC free article] [PubMed] [Google Scholar]
- Gerstner W, Kempter R, van Hemmen JL, Wagner H. A neuronal learning rule for sub-millisecond temporal coding. Nature. 1996;383:76–81. doi: 10.1038/383076a0. [DOI] [PubMed] [Google Scholar]
- Gilbert E, Pollak H. Amplitude distribution of shot noise. Bell Syst Tech J. 1960;39:333–350. doi: 10.1002/j.1538-7305.1960.tb01603.x. [DOI] [Google Scholar]
- Gjorgjieva J, Clopath C, Audet J, Pfister JP. A triplet spike timing-dependent plasticity model generalizes the Bienenstock-Cooper-Munro rule to higher-order spatiotemporal correlations. Proc Natl Acad Sci U S A. 2011;108:19383–19388. doi: 10.1073/pnas.1105933108. [DOI] [PMC free article] [PubMed] [Google Scholar]
- Graupner M, Brunel N. Mechanisms of induction and maintenance of spike timing dependent plasticity in biophysical synapse models. Front Comput Neurosci. 2010;4:1–19. doi: 10.3389/fncom.2010.00136. [DOI] [PMC free article] [PubMed] [Google Scholar]
- Graupner M, Brunel N. Calcium-based plasticity model explains sensitivity of synaptic changes to spike pattern, rate, and dendritic location. Proc Natl Acad Sci U S A. 2012;109:3991–3996. doi: 10.1073/pnas.1109359109. [DOI] [PMC free article] [PubMed] [Google Scholar]
- Gütig R, Aharonov R, Rotter S, Sompolinsky H. Learning input correlations through nonlinear temporally asymmetric Hebbian plasticity. J Neurosci. 2003;23:3697–3714. doi: 10.1523/JNEUROSCI.23-09-03697.2003. [DOI] [PMC free article] [PubMed] [Google Scholar]
- Harrison MT, Geman S. A rate and history-preserving resampling algorithm for neural spike trains. Neural Comput. 2009;21:1244–1258. doi: 10.1162/neco.2008.03-08-730. [DOI] [PMC free article] [PubMed] [Google Scholar]
- Hestrin S. Different glutamate receptor channels mediate fast excitatory synaptic currents in inhibitory and excitatory cortical neurons. Neuron. 1993;11:1083–1091. doi: 10.1016/0896-6273(93)90221-C. [DOI] [PubMed] [Google Scholar]
- Higgins D, Graupner M, Brunel N. Memory maintenance in synapses with calcium-based plasticity in the presence of background activity. PLoS Comput Biol. 2014;10:e1003834. doi: 10.1371/journal.pcbi.1003834. [DOI] [PMC free article] [PubMed] [Google Scholar]
- Isaac JT, Buchanan KA, Muller RU, Mellor JR. Hippocampal place cell firing patterns can induce long-term synaptic plasticity in vitro. J Neurosci. 2009;29:6840–6850. doi: 10.1523/JNEUROSCI.0731-09.2009. [DOI] [PMC free article] [PubMed] [Google Scholar]
- Izhikevich EM, Desai NS. Relating STDP to BCM. Neural Comput. 2003;15:1511–1523. doi: 10.1162/089976603321891783. [DOI] [PubMed] [Google Scholar]
- Jazayeri M, Wallisch P, Movshon JA. Dynamics of macaque MT cell responses to grating triplets. J Neurosci. 2012;32:8242–8253. doi: 10.1523/JNEUROSCI.5787-11.2012. [DOI] [PMC free article] [PubMed] [Google Scholar]
- Kato HK, Gillet SN, Isaacson JS. Flexible sensory representations in auditory cortex driven by behavioral relevance. Neuron. 2015;88:1027–1039. doi: 10.1016/j.neuron.2015.10.024. [DOI] [PMC free article] [PubMed] [Google Scholar]
- Kempter R, Gerstner W, van Hemmen JL. How the threshold of a neuron determines its capacity for coincidence detection. Bio Systems. 1998;48:105–112. doi: 10.1016/s0303-2647(98)00055-0. [DOI] [PubMed] [Google Scholar]
- Lewicki MS. A review of methods for spike sorting: the detection and classification of neural action potentials. Network. 1998;9:R53–R78. doi: 10.1088/0954-898X_9_4_001. [DOI] [PubMed] [Google Scholar]
- Livingstone MS, Hubel DH. Effects of sleep and arousal on the processing of visual information in the cat. Nature. 1981;291:554–561. doi: 10.1038/291554a0. [DOI] [PubMed] [Google Scholar]
- Magee JC, Johnston D. A synaptically controlled, associative signal for Hebbian plasticity in hippocampal neurons. Science. 1997;275:209–213. doi: 10.1126/science.275.5297.209. [DOI] [PubMed] [Google Scholar]
- Makino H, Komiyama T. Learning enhances the relative impact of top-down processing in the visual cortex. Nat Neurosci. 2015;18:1116–1122. doi: 10.1038/nn.4061. [DOI] [PMC free article] [PubMed] [Google Scholar]
- Markram H, Lübke J, Frotscher M, Sakmann B. Regulation of synaptic efficacy by coincidence of postsynaptic APs and EPSPs. Science. 1997;275:213–215. doi: 10.1126/science.275.5297.213. [DOI] [PubMed] [Google Scholar]
- Morrison A, Diesmann M, Gerstner W. Phenomenological models of synaptic plasticity based on spike timing. Biol Cybern. 2008;98:459–478. doi: 10.1007/s00422-008-0233-1. [DOI] [PMC free article] [PubMed] [Google Scholar]
- Nevian T, Sakmann B. Spine Ca2+ signaling in spike timing-dependent plasticity. J Neurosci. 2006;26:11001–11013. doi: 10.1523/JNEUROSCI.1749-06.2006. [DOI] [PMC free article] [PubMed] [Google Scholar]
- Ostojic S, Brunel N, Hakim V. How connectivity, background activity, and synaptic properties shape the cross-correlation between spike trains. J Neurosci. 2009;29:10234–10253. doi: 10.1523/JNEUROSCI.1275-09.2009. [DOI] [PMC free article] [PubMed] [Google Scholar]
- Pawlak V, Wickens JR, Kirkwood A, Kerr JN. Timing is not everything: neuromodulation opens the STDP gate. Front Synaptic Neurosci. 2010;2:146. doi: 10.3389/fnsyn.2010.00146. [DOI] [PMC free article] [PubMed] [Google Scholar]
- Pfister JP, Gerstner W. Triplets of spikes in a model of spike timing-dependent plasticity. J Neurosci. 2006;26:9673–9682. doi: 10.1523/JNEUROSCI.1425-06.2006. [DOI] [PMC free article] [PubMed] [Google Scholar]
- Poort J, Khan AG, Pachitariu M, Nemri A, Orsolic I, Krupic J, Bauza M, Sahani M, Keller GB, Mrsic-Flogel TD, Hofer SB. Learning enhances sensory and multiple non-sensory representations in primary visual cortex. Neuron. 2015;86:1478–1490. doi: 10.1016/j.neuron.2015.05.037. [DOI] [PMC free article] [PubMed] [Google Scholar]
- Renart A, de la Rocha J, Bartho P, Hollender L, Parga N, Reyes A, Harris KD. The asynchronous state in cortical circuits. Science. 2010;327:587–590. doi: 10.1126/science.1179850. [DOI] [PMC free article] [PubMed] [Google Scholar]
- Rubin J, Lee DD, Sompolinsky H. Equilibrium properties of temporally asymmetric Hebbian plasticity. Phys Rev Lett. 2001;86:364–367. doi: 10.1103/PhysRevLett.86.364. [DOI] [PubMed] [Google Scholar]
- Rubin JE, Gerkin RC, Bi GQ, Chow CC. Calcium time course as a signal for spike timing-dependent plasticity. J Neurophysiol. 2005;93:2600–2613. doi: 10.1152/jn.00803.2004. [DOI] [PubMed] [Google Scholar]
- Rudolph M, Pelletier JG, Paré D, Destexhe A. Characterization of synaptic conductances and integrative properties during electrically induced EEG-activated states in neocortical neurons in vivo. J Neurophysiol. 2005;94:2805–2821. doi: 10.1152/jn.01313.2004. [DOI] [PubMed] [Google Scholar]
- Schulz JM, Redgrave P, Reynolds JN. Cortico-striatal spike timing dependent plasticity after activation of subcortical pathways. Front Synaptic Neurosci. 2010;2:23. doi: 10.3389/fnsyn.2010.00023. [DOI] [PMC free article] [PubMed] [Google Scholar]
- Shouval HZ, Bear MF, Cooper LN. A unified model of NMDA receptor-dependent bidirectional synaptic plasticity. Proc Natl Acad Sci U S A. 2002;99:10831–10836. doi: 10.1073/pnas.152343099. [DOI] [PMC free article] [PubMed] [Google Scholar]
- Shouval HZ, Wang SS, Wittenberg GM. Spike timing dependent plasticity: a consequence of more fundamental learning rules. Front Comput Neurosci. 2010;4:19. doi: 10.3389/fncom.2010.00019. [DOI] [PMC free article] [PubMed] [Google Scholar]
- Sjöström PJ, Turrigiano GG, Nelson SB. Rate, timing, and cooperativity jointly determine cortical synaptic plasticity. Neuron. 2001;32:1149–1164. doi: 10.1016/S0896-6273(01)00542-6. [DOI] [PubMed] [Google Scholar]
- Softky WR, Koch C. The highly irregular firing of cortical cells is inconsistent with temporal integration of random EPSPs. J Neurosci. 1993;13:334–350. doi: 10.1523/JNEUROSCI.13-01-00334.1993. [DOI] [PMC free article] [PubMed] [Google Scholar]
- Song S, Miller KD, Abbott LF. Competitive Hebbian learning through spike timing-dependent synaptic plasticity. Nat Neurosci. 2000;3:919–926. doi: 10.1038/78829. [DOI] [PubMed] [Google Scholar]
- Urakubo H, Honda M, Froemke RC, Kuroda S. Requirement of an allosteric kinetics of NMDA receptors for spike timing-dependent plasticity. J Neurosci. 2008;28:3310–3323. doi: 10.1523/JNEUROSCI.0303-08.2008. [DOI] [PMC free article] [PubMed] [Google Scholar]
- van Rossum MC, Bi GQ, Turrigiano GG. Stable Hebbian learning from spike timing-dependent plasticity. J Neurosci. 2000;20:8812–8821. doi: 10.1523/JNEUROSCI.20-23-08812.2000. [DOI] [PMC free article] [PubMed] [Google Scholar]
- Yger P, Stimberg M, Brette R. Fast learning with weak synaptic plasticity. J Neurosci. 2015;35:13351–13362. doi: 10.1523/JNEUROSCI.0607-15.2015. [DOI] [PMC free article] [PubMed] [Google Scholar]


