. 2016 Nov 14;5:e17822. doi: 10.7554/eLife.17822

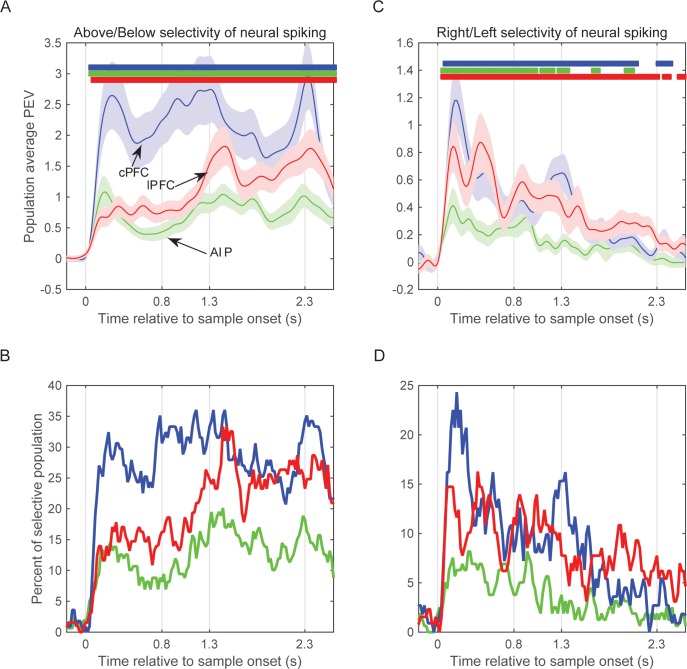
Figure 6. Selectivity of neural spiking activity.

(A) Average selectivity (±SEM) of neural spiking for the task-relevant category of sample location (Above/Below) in each of the three neural populations as a function of time from sample onset. Horizontal bars indicate time bins of significant selectivity (p<0.05 lasting for at least 100 ms) in the corresponding populations (blue: cPFC; green: AIP; red: lPFC). (B) Percent of each population with significant selectivity (p<0.01) for the Above/Below categorization. (C) Same as A for the task-irrelevant dimension of sample location (Right/Left). (D) Same as B for the Right/Left dimension. Overall, all three populations showed stronger selectivity for Above/Below than for Right/Left (note difference in y scales between left and right panels), and different time courses between Right/Left selectivity (which gradually decayed after sample display) and Above/Below selectivity (which tended to grow stronger after the end of sample display). The results are similar if selectivity is analyzed on the pooled spikes from all neurons isolated from each electrode (see Figure 6—figure supplement 1). Synchrony of LFP oscillations between two electrodes showed similar selectivity whether the corresponding spiking had the same or different category preferences (see Figure 6—figure supplement 2).

DOI: http://dx.doi.org/10.7554/eLife.17822.016

Figure 6.

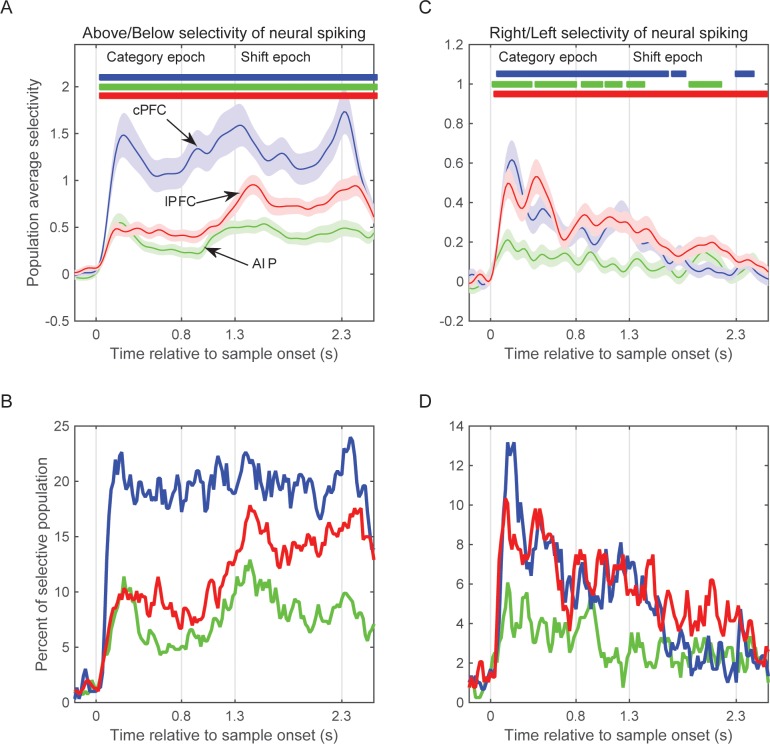
Figure 6—figure supplement 1. Selectivity of pooled multi-unit activity.

Figure 6—figure supplement 1.

(A) Average selectivity (±SEM) of pooled neural spiking for the task-relevant category of sample location (Above/Below) in each of the three neural populations as a function of time from sample onset. Horizontal bars indicate time bins of significant selectivity (p<0.05 lasting at least 100 ms) in the corresponding populations (blue: cPFC; green: AIP; red: lPFC). (B) Percent of each population with significant selectivity (p<0.01) for the Above/Below categorization. (C) Same as A for the task-irrelevant dimension of sample location (Right/Left). (D) Same as B for the Right/Left dimension. Analyses of spiking selectivity result to similar patterns whether they are performed on a pooled spiking activity per electrode or on the spikes of individual neurons (Figure 6).
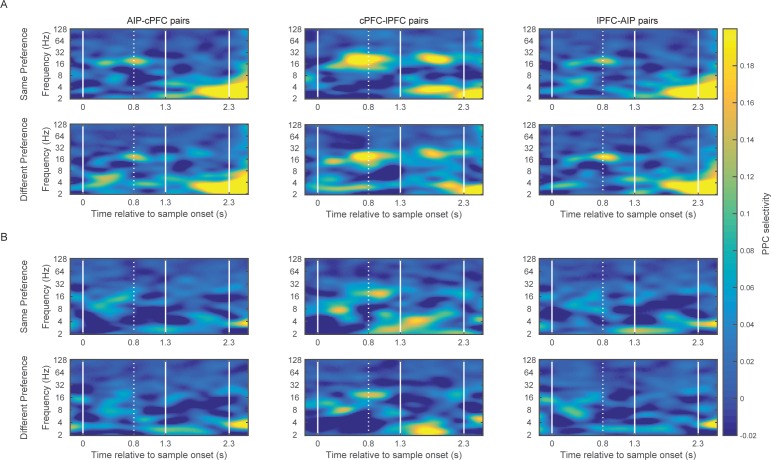
Figure 6—figure supplement 2. LFP synchrony in relation to individual site preference.

Figure 6—figure supplement 2.

(A) Average PPC selectivity between pairs of electrodes in AIP, cPFC and lPFC that showed the same (top) or different (bottom) category preference in spiking activity along the Above/Below dimension. (B) The same for category preferences along the Right/Left dimension.