Abstract
All members of the Eph receptor family of tyrosine kinases contain a SAM domain near the C terminus, which has been proposed to play a role in receptor homotypic interactions and/or interactions with binding partners. The SAM domain of EphA2 is known to be important for receptor function, but its contribution to EphA2 lateral interactions in the plasma membrane has not been determined. Here we use a FRET-based approach to directly measure the effect of the SAM domain on the stability of EphA2 dimers on the cell surface in the absence of ligand binding. We also investigate the functional consequences of EphA2 SAM domain deletion. Surprisingly, we find that the EphA2 SAM domain inhibits receptor dimerization and decreases EphA2 tyrosine phosphorylation. This role is dramatically different from the role of the SAM domain of the related EphA3 receptor, which we previously found to stabilize EphA3 dimers and increase EphA3 tyrosine phosphorylation in cells in the absence of ligand. Thus, the EphA2 SAM domain likely contributes to a unique mode of EphA2 interaction that leads to distinct signaling outputs.
INTRODUCTION
The EphA2 receptor is a member of the largest family of receptor tyrosine kinases (RTKs). It has many important and diverse biological functions by exerting control over cell proliferation, differentiation, migration and tissue morphogenesis (1–5). EphA2 is preferentially expressed in epithelial cells, for example in the skin, lens, kidney, lungs, liver, small intestine, and colon (6). Recent studies have shown that EphA2 regulates lens transparency, kidney repair following renal injury, bone remodeling and mammary gland branch morphogenesis, as well as cell transformation in a variety of tumors and pathological forms of angiogenesis (1, 6–8). While the expression level of EphA2 in most adult tissues is generally low, its overexpression and dysregulation leads to carcinogenesis, metastasis, and poor clinical prognosis (1, 7, 9–12).
The EphA2 receptor is a single pass transmembrane protein with an extracellular portion and a cytoplasmic region. The extracellular portion is composed of an ephrin ligand binding domain (LBD), a Cystine-rich domain (CRD) and two fibronectin type III repeats (13). The cytoplasmic region consists of a juxtamembrane sequence, a tyrosine kinase domain, a sterile α motif (SAM) domain and a PDZ domain-binding motif. Both SAM domains and the PDZ domain-binding motifs are known to mediate interactions with cytoplasmic proteins (14, 15).
The ligands of EphA2 are called ephrin-As and are anchored to neighboring cells. Upon binding to the ligands, the EphA2 receptor molecules cluster and cross-phosphorylate each other, predominantly on two tyrosines in the juxtamembrane domain and on a tyrosine in the activation loop (1). The phosphorylation triggers downstream signaling cascades that lead to cell contraction and disruption of cell-cell contacts, generally inhibiting cell migration and invasiveness (1, 16–18). However, EphA2 exhibits pro-oncogenic activities in the absence of ligand, a functionality that has been linked to low Tyr phosphorylation and high phosphorylation on S897, located between the kinase and the SAM domains (1, 19, 20). Furthermore, it has been shown that EphA2 can form dimers in the absence of ligand, with dimerization working to increase Tyr phosphorylation and decrease S897 phosphorylation, thus inhibiting tumorigenic signaling (21).
The function of S897 in EphA2 is unique within the large RTK superfamily. A corresponding serine is found in only one other RTK, EphA1, but there are no reports of links between phosphorylation of this serine in EphA1 and cancer. The lateral interactions between EphA2 receptor molecules are also believed to be distinctive among the Eph family members (22). In particular, two distinct receptor-receptor interfaces have been identified in the EphA2 extracellular region (23, 24), while only one extracellular region interface may be contributing to the lateral interactions of another Eph receptor, EphA4 (22).
All Eph receptors have SAM domains, positioned after the kinase domain and close to the C-terminus. The SAM domains are known as interaction motifs, found in many proteins in diverse organisms ranging from yeast to humans (14). They mediate protein-protein interactions by forming homotypic and heterotypic dimers or oligomers (25–27). The SAM domain of EphA2 is known to be important in EphA2 function. It plays a role in lens development, and EphA2 SAM domain mutations have been implicated in the development of cataracts (28–31). Heterointeractions between the EphA2 SAM domain and the SAM domain of SH2 domain-containing inositol-5-phosphatase (SHIP2) have been linked to decreased EphA2 kinase activity and endocytosis (32–34). Furthermore, the EphA2 SAM domain is responsible for recruiting the SH2 domains of Grb7, a protein that is essential for the regulation of cell migration (35).
While these studies suggest a role of the EphA2 SAM domain in mediating interactions between the EphA2 receptor and soluble cytoplasmic proteins, the role of the SAM domain in EphA2-EphA2 interactions is still unclear. In part, this has been due to lack of appropriate methodologies to probe the association of membrane receptors in the native plasma membrane. Such work has become feasible, however, with the development of quantitative FRET methodologies that can provide information on full-length receptor dimerization propensities (36–38). These FRET methods have already revealed that the deletion of the SAM domain from another Eph receptor, EphA3, significantly destabilizes the EphA3 dimer, suggesting a role for the EphA3 SAM domain in promoting homodimerization (39).
Here we directly measure the contribution of the SAM domain to the stability of EphA2 dimers in the absence of ligand binding. We also investigate the functional consequences of EphA2 SAM domain deletion in the absence of ligand. For these studies, we compared two pairs of EphA2 proteins with and without the SAM domain, namely wild-type EphA2 and an EphA2 mutant in which dimerization is impaired by mutations of three extracellular residues. The results with both sets of proteins support an inhibitory role for the EphA2 SAM domain in receptor dimerization. Thus, despite the conserved domain structure of the different Eph receptors, we find that the role of the SAM domain in EphA2 interactions is dramatically different from the role of the EphA3 SAM domain.
MATERIALS AND METHODS
Cloning and Mutagenesis
The cloning of pcDNA 3.1(+) EphA2-mTurq and pcDNA3.1 (+) EphA2-eYFP was described in a previous publication (21). The EphA2 SAM domain comprises amino acids 904 to 968, and the EphA2ΔSAM constructs lack the sequence encoding amino acids 902 to 971. To generate them, we used the EcoRI and BamHI restriction sites occurring in the EphA2 sequence. The EcoRI restriction site is located 1131 nucleotides before the sequence encoding the SAM domain, while the BamHI restriction site is located 4 nucleotides after the sequence encoding the SAM domain. We generated an EphA2 PCR product using 5’-TTTCTCCGTGACCCTGGACG-3’ as a forward primer and 5’-GCGGATCCCCACCGAGCCGCTCGTGCTGGGGAG-3’ as a reverse primer (containing a BamHI site, underlined) to amplify a portion of EphA2 lacking the SAM domain. The PCR product was digested with EcoRI and BamHI and cloned into the EcoRI and BamHI sites of pcDNA 3.1(+) EphA2-mTurq and pcDNA3.1 (+) EphA2-eYFP to obtain pcDNA 3.1(+) EphA2ΔSAM-mTurq and pcDNA3.1 (+) EphA2ΔSAM-eYFP.
The cloning of the plasmids encoding the EphA2 L223R/L254R/V255R mutants has been described previously (21). The SAM domain was deleted from these mutants following the same procedure described above.
Cell culture and transfection
HEK293T cells were purchased from American Type Culture Collection (ATCC) (Manassas, VA, USA). The cells were seeded in 35 mm glass bottom dishes (MatTek Corporation, MA) in Dulbecco’s modified Eagle medium (DMEM), supplemented with 10% fetal bovine serum (FBS, Hyclone), 3.5g/L D-glucose (19.4mM) and 1.5g/L (17.9mM) sodium bicarbonate and cultured overnight. The cells were co-transfected with pcDNA 3.1 (+) EphA2ΔSAM-mTurq and pcDNA3.1 (+) EphA2ΔSAM-eYFP or their L223R/L254R/V255R mutants using Lipofectamine 2000 (Invitrogen), following the manufacturers protocol. Twelve hours after transfection, the cells were rinsed twice with starvation medium to remove the traces of phenol red and serum-starved for at least 12 hours. The starvation medium was replaced with hypo-osmotic medium (10% starvation medium + 90% water + 25 mM HEPES buffer) to swell the cells under reversible conditions as described (40). Imaging was initiated 10 minutes after swelling, and lasted for two hours after swelling.
Two photon imaging of swollen cells
The swollen cells were imaged with a spectrally resolved two photon microscope with line-scanning capabilities to obtain spectral images. A mode-locked laser (MaiTaiTM, Spectra-Physics, Santa Clara) that generates femtosecond pulses between wavelengths 690 nm to 1040 nm was used as the excitation source for fluorophores. The design and working principle of the microscope is given in previous publications (41, 42). The swollen cells were imaged at two excitation wavelengths, 800 nm and 960 nm as described in (38).
Cells were starved to ensure that no soluble ligand is present. We imaged only plasma membranes of swollen cells that were not in contact with neighboring cells. This ensured that the EphA2 receptors did not interact with ephrins that may be present on opposing cells. Furthermore, the starvation medium was replaced by the swelling medium just before imaging, to remove any traces of ephrins in the solution.
Measurements of dimerization propensities
The dimerization propensities of EphA2ΔSAM and L223R/L254R/V255R EphA2ΔSAM were characterized using the Fully Quantified Spectral Imaging FRET (FSI-FRET) method (38). Receptor concentrations were varied over a wide range. The donor concentration, acceptor concentration, and FRET efficiency for small membrane segments were measured in many cells.
The protocol for further data processing has been described in detail in previous publications (36, 38). In brief, the measured FRET is first corrected for a “by-stander” or “proximity” contribution which arises due to the confinement of the fluorophores on the two-dimensional membrane (43). Then, the corrected FRET for a membrane area is divided by the acceptor fraction, yielding the product of the dimeric fraction in the membrane and Intrinsic FRET, fDẼ. The data from many cells were combined and analyzed with the help of a monomer-dimer equilibrium model given by equation (1) (36, 38):
| (1) |
In equation (1), [T] is the total concentration of the receptors, fD is the dimeric fraction, Kdiss is the unknown dissociation constant, and Ẽ is the unknown Intrinsic FRET. Kdiss (in units of receptors/μm2) and Ẽ are optimized when this equation is fitted to the experimental data. This allows us to calculate the dimer stability, ΔG. The standard state for ΔG of membrane protein association in the membrane is defined as 1 nm2/receptor (36), and therefore:
| (2) |
The second parameter determined from the fit is the structural parameter "Intrinsic FRET”, Ẽ, which depends primarily on the distance d between the fluorescent proteins in the dimer according to:
| (3) |
Here Ro is the Förster radius of the mTurq /eYFP FRET pair, 54.5 Å. This equation assumes free rotations of the fluorescent proteins, which is justified by the use of the long flexible (GGS)5 linker (44).
Western blots
Twenty four hours following transfection, the cells were lysed in lysis buffer (25mM TrisHCl, 0.5% TritonX-100, 20mM NaCl, 2mM EDTA, 2mM Na3VO4, and Roche Applied Science protease and phosphatase inhibitor). The lysed samples were collected and centrifuged at 14,000g for 15 minutes at 4°C. The lysates were collected and stored at −20°C. The total protein concentrations in the lysates were measured with the BCA protein assay kit (Bio-Rad, CA). The lysates were loaded into 3–8% NuPAGEHNovexHTris-Acetate mini gels (Invitrogen, CA). The proteins were transferred onto a nitrocellulose membrane, and blocked using 5% non-fat milk in TBST. Total EphA2 expression, S897 phosphorylation and Y772 phosphorylation were detected using anti-EphA2 antibodies (R&D systems, MN), anti-phospho-S897 antibodies (Cell Signaling, MA), and anti-phospho-Y772 antibodies (Cell Signaling, MA), respectively. Donkey anti-goat HRP conjugated antibodies (Promega, WI) and anti-rabbit HRP conjugated antibodies (Promega, WI) were used as secondary antibodies. The membranes were incubated with Amersham ECL PlusTM Western Blotting Detection Reagent (GE HealthCare Life Sciences, PA) for 2 minutes and then exposed for 1 to 60 seconds in a Chemidoc molecular imager (Bio-Rad, CA) to detect the chemiluminescent bands.
Cell migration assay
HEK293T cells were cultured and transfected with plasmids encoding EphA2 and EphA2ΔSAM. Twelve hour following transfection, the cells were serum starved overnight. A cell suspension of 1×10⁶ cells per ml was prepared in serum free medium containing 0.5% BSA. To assay the migratory behavior of cells, the CytoSelect Cell Haptotaxis Assay Kit (CellBiolabs, CA) was used. This kit contains inserts with polycarbonate membranes having pores of size of 8μm. Collagen I is coated on the bottom side. 500μl of medium containing 10% FBS was placed in the well, while 300 μl of the cell suspension was loaded in the inserts. The cells were incubated at 37°C and were allowed to migrate for 4 hours through the pores in response to Collagen I and FBS. The medium was aspirated from the inserts, and the top of the polycarbonate membrane was cleaned using cotton swabs to remove non-migratory cells. The inserts were then transferred to clean wells containing 300μl of Lysis Buffer/CyQuantR GR dye solution. After 10 minute incubation at room temperature and transfer, the florescence of the CyQuant® GR dye solution was measured at 480nm/520nm in a plate reader. The measured fluorescence is directly proportional to the number of cells that had migrated to the bottom side of the polycarbonate membrane.
RESULTS
Deletion of the SAM domain stabilizes the EphA2 dimer in the absence of ligand binding
The goal of the present study was to measure the contribution of the SAM domain to the dimerization of full-length EphA2 receptor in the absence of ephrin ligand binding. To do so, we deleted the SAM domain from the full-length EphA2 receptor, and we measured the dimerization propensity of this truncated EphA2ΔSAM receptor and the full-length receptor in the absence of ephrin ligand binding (Figure 1, left side).
Figure 1.
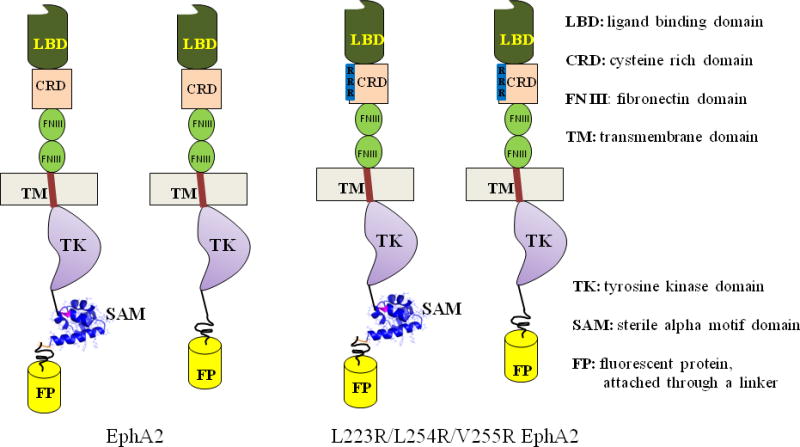
The four EphA2 constructs investigated in this work to elucidate the role of the EphA2 SAM domain in receptor dimerization. For these measurements we used both the wild-type and the EphA2 L223R/L254R/V255R mutant, which has lower dimerization ability due to extracellular mutations in a receptor-receptor interface. Both EphA2 wild-type and mutant were analyzed in their full-length version and in a version lacking the SAM domain.
The dimerization propensities of EphA2ΔSAM and EphA2 were measured using a quantitative FRET method termed FSI-FRET (38). To allow for FRET detection, the receptors were tagged with a fluorescent protein (either mTurquoise (mTurq) or YFP, a FRET pair) at their C-terminus, which was attached via a (GGS)5 flexible linker (Figure 1). This linker was used to ensure the free rotation of fluorophores since it lacks secondary structure (44). Moreover, this linker was previously shown not to affect dimerization of a membrane protein (45). Here, we further assessed the effect of the fluorescent protein and the linker on EphA2 function using Western blotting. The results demonstrate that the attachment of the fluorescent protein via a flexible linker does not affect EphA2 phosphorylation (Figure 2).
Figure 2.
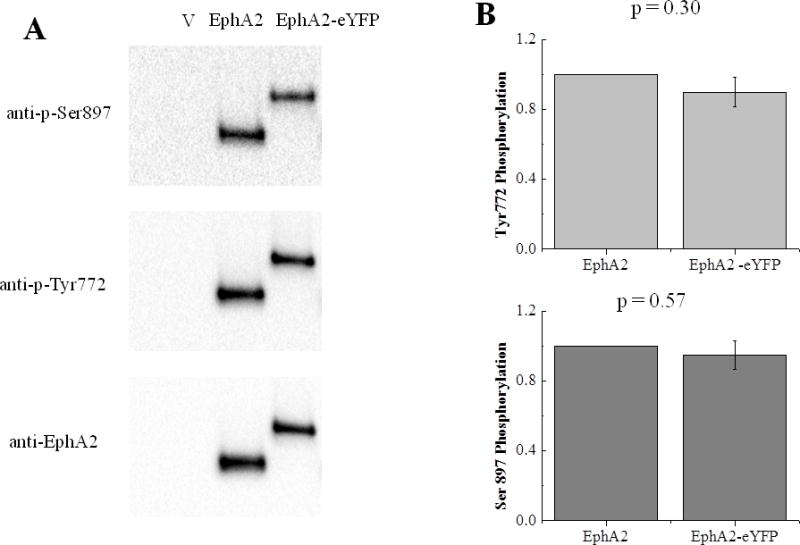
The fusion of YFP to the EphA2 C-terminus does not affect receptor phosphorylation. (A) A representative Western blot. (B). Quantification from three independent experiments. The differences in S897 and Tyr772 phosphorylation are not statistically significant (p>0.05)
HEK293T cells were co-transfected with plasmids encoding either EphA2-mTurq and EphA2-eYFP or EphA2ΔSAM-mTurq and EphA2ΔSAM-eYFP, at a ratio of 1:3. Twelve hours post transfection, the cells were starved for at least twelve hours before imaging. Just before imaging, the cells were subjected to reversible osmotic stress to induce swelling. This was necessary, because the plasma membranes of cells have very complex “wrinkled” topologies (46, 47). Thus, the receptor concentration in the plasma membrane cannot be determined unless the cells are subjected to reversible osmotic stress, which stretches the membrane (38). Then, a calibration with purified fluorescent protein solutions of known concentrations is used to calculate the receptor concentration per unit membrane area (38).
Ten minutes after swelling, the cells were imaged with a spectrally resolved two-photon microscope. The spectral images obtained were analyzed with the FSI software (38) to obtain (i) the donor concentrations, (ii) the acceptor concentrations, and, (iii) the FRET efficiencies, in selected regions of the free plasma membrane of swollen cells (Figure 3). To obtain a wide range of receptor concentrations, the total amount of DNA used for transfection was varied from 20 ng to 4 μg. Five hundred cells in 9 independent experiments were imaged and analyzed to obtain the dimerization curves.
Figure 3.
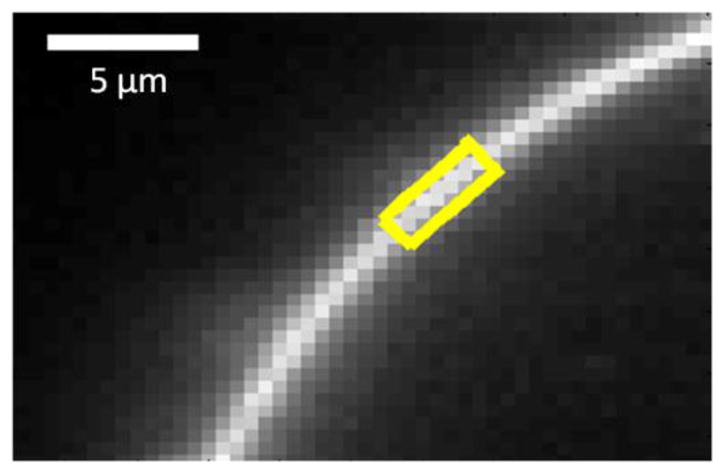
A section of a cell membrane under reversible osmotic stress. The cell co-expresses EphA2ΔSAM constructs tagged with the fluorescent proteins mTurq or eYFP at the C-terminus. A homogeneous region of membrane fluorescence, ~ 3μm in length (yellow), is selected for FSI-FRET analysis to obtain one of the data points shown in Figure 2A,B and Figure 3A,B.
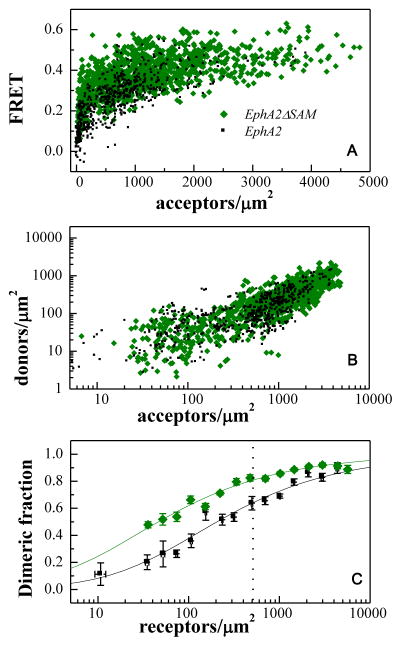
The FRET efficiencies, measured for EphA2ΔSAM and full-length EphA2, are shown in Figure 4A as a function of acceptor concentration. Each data point represents a single membrane region (Figure 3). The donor concentration versus the acceptor concentration for each membrane region is shown in Figure 4B. From the FRET efficiencies in Figure 4A and the donor to acceptor ratio in Figure 4B, we determined the dimeric fraction as a function of concentration, following the step by step protocol described in (38). A model describing the monomer-dimer equilibrium was used to fit the data according to Eqn.1, yielding the dimerization curve. From the fitting, we obtained the optimal dissociation constants, and their 95% confidence intervals (Table 1).
Figure 4.
FRET characterization of EphA2ΔSAM and EphA2 dimerization. (A) FRET efficiencies measured for EphA2ΔSAM and EphA2, as a function of acceptor (EphA2ΔSAM-YFP or EphA2-YFP) concentration. Every data point represents a single membrane region such as the one shown in Figure 3. (B) Donor concentration versus acceptor concentration in each membrane region. (C) Comparison of dimeric fractions as a function of receptor concentrations, for EphA2ΔSAM and EphA2. The dimeric fractions measured for individual membrane regions are binned, and the averages and the standard errors are shown with the symbols. The solid lines are the theoretical curves for the best-fit dimerization model. The deletion of the SAM domain leads to dimer stabilization by 0.9 ± 0.3 kcal/mole. The dashed vertical line indicates 600 receptors/μm2, the reported EphA2 expression in A549 lung cancer cells (52). At this level of EphA2 expression, deletion of the SAM domain increases the fraction of dimeric receptor by 20%. The increase is more pronounced when EphA2 is expressed at lower levels.
Table 1. Parameters describing EphA2 unliganded dimerization.
The dissociation constants Kdiss and the dimerization free energies, ΔG, for EphA2, EphA2ΔSAM, L223R/L254R/V255R EphA2, and L223R/L254R/V255R EphA2ΔSAMThe differences in dimer stability due to SAM domain deletion (ΔΔGSAM) and due to the L223R/L254R/V255R mutations (ΔΔGLLV), are also shown.
| Kdiss (rec/μm2) | ΔG (kcal/mole) | ΔΔGSAM | ΔΔGLLV | |
|---|---|---|---|---|
| EphA2 | 206 ± 73 | −5.03 ± 0.25 | ||
| EphA2ΔSAM | 47 ± 13 | −5.90 ± 0.17 | −0.9 ± 0.3 | |
| L223R/L254R/V255R EphA2 | 1100 ± 482 | −4.03 ± 0.33 | 1.0 ± 0.4 | |
| L223R/L254R/V255R EphA2ΔSAM | 343 ± 80 | −4.72 ± 0.17 | −0.7 ± 0.4 | 1.2 ± 0.2 |
The experimentally measured dimeric fractions were binned and the averages and the standard errors are shown in Figure 4C, together with the best-fit dimerization curves. The comparison of the dimerization curves shows that the deletion of the SAM domain increases the dimeric fraction, and thus the presence of the SAM domain inhibits dimerization. The measured dissociation constants and the dimer stabilities (see equation 2) are shown in Table 1. The comparison of dimer stabilities for full-length EphA2 and EphA2ΔSAM in Table 1 shows that the dimers formed by EphA2ΔSAM are more stable by −0.9 ± 0.3 kcal/mol.
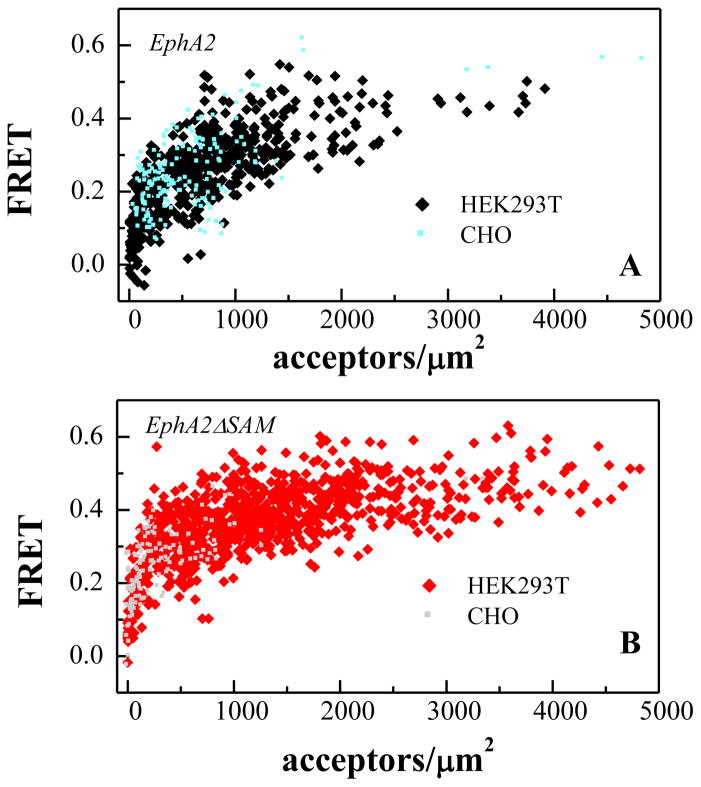
Next, we performed the same FRET experiments in CHO cells, which like HEK293 cells express EphA2 at very low levels and should therefore be suitable for these experiments. The FRET data in HEK293T and CHO cells are compared in Figure 5. The EphA2 expression in CHO cells is much lower and does not allow analysis over a wide range of receptor concentrations, as needed to draw reliable conclusions. The FRET efficiencies in the two cell lines, however, overlap, indicating that EphA2 and EphA2ΔSAM dimerization is the same in CHO and HEK293T cells. Thus, the conclusions of the FRET experiments apply to at least two different cell lines.
Figure 5.
FRET efficiencies are the same for HEK293T and CHO cells, indicative of the same EphA2 dimerization propensities in the two cell types.
Both EphA2 and EphA2ΔSAM dimers are stabilized by contacts involving L223, L254 and V255 residues in the cysteine-rich domain
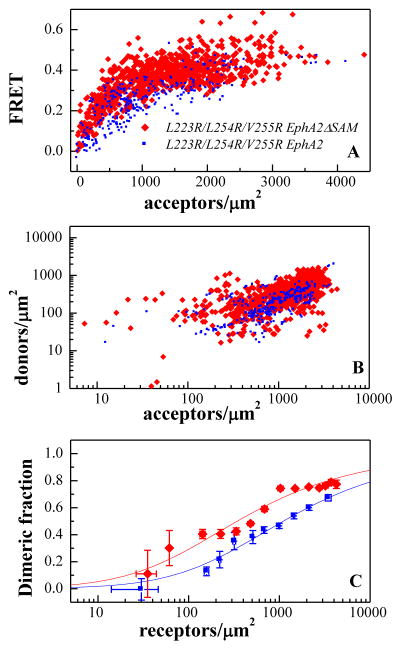
To confirm the above result, we next deleted the SAM domain from a L223R/L254R/V255R EphA2 mutant that we have previously studied (21) (Figure 1, right side). Amino acids L223, L254, and V255 are in the cysteine-rich domain (CRD) region of the extracellular domain and mediate receptor-receptor contacts in the absence of ephrin ligand binding (21). Thus, the L223R/L254R/V255R EphA2 mutant forms dimers of reduced stability. To investigate the effect of the SAM domain in this mutant dimer, we compared FRET in the L223R/L254R/V255R EphA2 mutant and a L223R/L254R/V255R EphA2 mutant lacking the SAM domain (L223R/L254R/V255R EphA2ΔSAM). The results are shown in Figure 6 and in Table 1. Deletion of the SAM domain from the mutant receptor stabilizes the mutant dimer, confirming our observation about the inhibitory role of EphA2 SAM domain.
Figure 6.
FRET characterization of L223R/L254R/V255R EphA2ΔSAM and L223R/L254R/V255R EphA2 dimerization. (A) FRET as a function of acceptor concentration. Every data point is obtained from a small membrane region of a cell. (B) Donor concentration versus acceptor concentration in each membrane region. (C) Comparison of the dimerization curves for L223R/L254R/V255R EphA2ΔSAM and L223R/L254R/V255R EphA2. Deletion of the SAM domain stabilizes the L223R/L254R/V255R EphA2ΔSAM dimer by 0.7 ± 0.4 kcal/mole.
The data in Figure 4 and 6 allow us to determine whether the deletion of the SAM domain preserves the interface that stabilizes the full-length EphA2 dimers. Figure 7 compares the dimerization curves for the wild-type and mutant Eph receptors that lack the SAM domain. We see that the introduced L223R/L254R/V255R mutations decreases the dimerization propensity, suggesting that contacts involving these residues stabilize the EphA2ΔSAM dimer, just as they stabilize the full-length EphA2 dimer (21).
Figure 7.
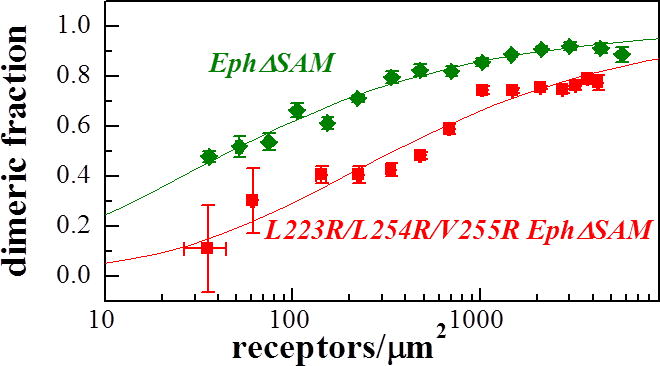
Comparison of the dimerization curves for L223R/L254R/V255R EphA2ΔSAM and EphA2ΔSAM. The L223R/L254R/V255R mutations destabilize the EphA2ΔSAM dimer by 1.2 ± 0.3 kcal/mole.
Deletion of the SAM domain suppresses cell migration
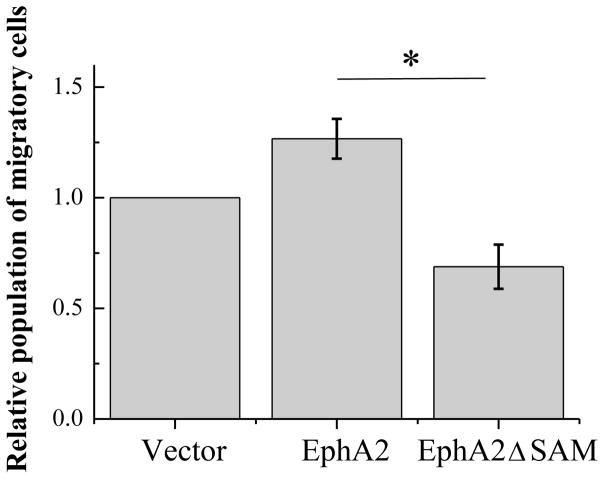
EphA2 receptor promotes cell migration through kinase-independent mechanism that is distinct from other RTKs (19). Recently, we have shown that enhanced cell migration is related to a reduced ability of EphA2 to form dimers in the absence of ephrin ligand binding (21). Since the deletion of the SAM domain promotes dimerization, we asked if this deletion will also result in reduced migration of the cells expressing EphA2ΔSAM, as compared to the full-length. To test this hypothesis, we measured cell migration using the Cell Biolabs Cyto-SelectTM cell haptotaxis assay kit (Cell Biolabs). The HEK293T cells expressing different EphA2 variants were assessed for their ability to migrate through the pores of the polycarbonate membrane of the insert during a 4 hour period, in response to collagen I coated on the bottom side of the inserts as well as FBS in the lower chamber. The result of the migration assays is shown in Figure 8. The cells expressing EphA2ΔSAM migrate more slowly compared to the cells expressing full-length EphA2, consistent with the stronger dimerization observed for EphA2ΔSAM compared to the full-length receptor.
Figure 8.
Results of the migration assay. The number of migratory HEK293T cells expressing full-length EphA2 receptor is significantly higher than the HEK293T cells expressing EphA2ΔSAM (p < 0.05 by ANOVA). Shown are the averages from three independent experiments, along with the standard errors.
Deletion of the EphA2 SAM domain leads to reduced S897 phosphorylation and enhanced Y772 phosphorylation
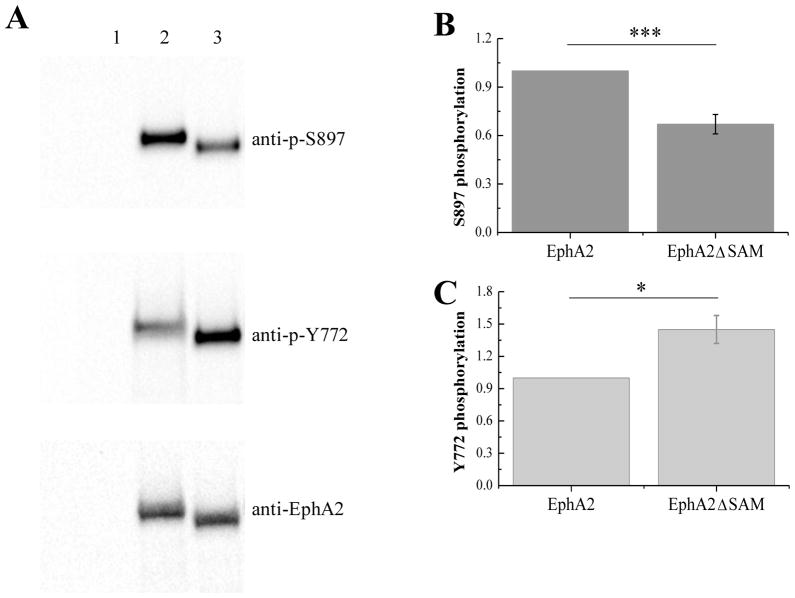
Previous work has demonstrated that low EphA2 dimer stability and high migratory propensity correlate with high EphA2 S897 phosphorylation and reduced Y772 phosphorylation (21). Consistent with expectations, Western blotting revealed that EphA2ΔSAM exhibits higher Y772 phosphorylation and lower S897 phosphorylation than full-length EphA2 (Figure 9). This result is consistent with a stronger dimerization propensity of EphA2ΔSAM as compared to the full-length receptor.
Figure 9.
Phosphorylation of full-length EphA2 and EphA2ΔSAM. (A) Typical Western blot results. Lane 1: Vector. Lane 2: EphA2. Lane3: EphA2ΔSAM. (B) Quantification from three independent experiments (averages and standard errors). Serine phosphorylation is decreased due to the deletion of the SAM domain (p<0.01) (C) Tyrosine phosphorylation is increased due to the deletion of the SAM domain (p<0.05).
DISCUSSION
Crystal structures and NMR studies of the SAM domains of EphA4 and EphB2 have suggested that these SAM domains are capable of forming dimers and even oligomers (25–27). A large dimer interface has been identified in the case of EphA4 SAM domain (27). Two different interfaces, possibly mediating oligomerization, have been identified in the case of EphB2 SAM domain (25, 26). Yet, dissociation constants for the isolated SAM domains in solutions exceed 500 μM and are thus considered very weak (25, 27). In a biological system, however, the SAM domains are attached to the receptor and the receptor is embedded in the membrane. The interactions between proteins, when confined to surfaces, are expected to be much stronger (48, 49). Here we use an approach that directly yields the thermodynamic contribution of the EphA2 SAM domain to EphA2 lateral interactions, in the plasma membrane (36, 37). In particular, we measured and compared the dimerization propensities of EphA2 receptors with and without the SAM domain in cells. Full-length EphA2 dimerization has been characterized previously (21), and the two measurements are the same.
In the current investigation of EphA2 SAM domain, we find that the deletion of the SAM domain stabilizes the EphA2 dimer in the absence of ligand (Figures 4 and 6). This surprising result is confirmed by functional assays (Figures 8 and 9). This finding may suggest that there are specific contacts between the SAM domain and the kinase domain within an EphA2 monomer, and that these contacts prevent the efficient dimerization of EphA2 kinase domain. In this scenario, removal of the SAM domain would allow stronger dimerization of the kinases domain. Alternatively, SAM domain interaction partners could interfere with kinase domain dimerization.
The effect that we observe here for EphA2 is the opposite of the behavior observed previously for EphA3 (39). In prior work, we studied EphA3 unliganded dimerization and we found that deletion of the SAM domain in EphA3 reduced dimer stability, suggesting that contacts that involve the SAM domain stabilize the EphA3 dimer (39). Thus, it appears that the EphA2 and EphA3 SAM domains play very different roles in Eph-Eph interactions. SAM domains are known to mediate diverse functions despite their close homology (14, 50), and our work suggests that they mediate diverse functions even in the closely related Eph family members. In support of this view, removal of the EphA4 SAM domain did not affect EphA4 signaling in a measurable way (51), a behavior that is distinctly different from the behaviors observed for EphA2 or EphA3.
It is well known that different Eph family members can mediate multiple and even opposing functions, such as intercellular adhesion versus cell-cell repulsion (1, 22). It has been proposed that the functional differences arise due to differences in lateral receptor interactions (22). EphA2 is believed to possess distinctive interaction characteristics as compared to EphA4 and possibly other Eph family members (22). Here we find a significant and surprising difference in the way the SAM domain contributes to EphA2 and EphA3 dimerization in the absence of ligand binding. The behavior of the EphA2 SAM domain that we observe may contribute to a unique mode of EphA2 interaction that leads to distinct signaling outputs.
Highlights.
We study the role of the SAM domain in EphA2 lateral interactions on the cell surface
SAM domain deletion increases EphA2 dimer stability and tyrosine phosphorylation
SAM domain deletion reduces EphA2 Ser897 phosphorylation and cell migration
The EphA2 and EphA3 SAM domains have distinctly different functional roles
Acknowledgments
Supported by NSF MCB 1157687 and NIH GM068619 (to K.H.) and CA138390 and CA175881 (to E.B.P.). We thank Dr. Xiang Yang Zhou for cloning strategy discussions.
Footnotes
The authors declare no conflict of interest.
Publisher's Disclaimer: This is a PDF file of an unedited manuscript that has been accepted for publication. As a service to our customers we are providing this early version of the manuscript. The manuscript will undergo copyediting, typesetting, and review of the resulting proof before it is published in its final citable form. Please note that during the production process errors may be discovered which could affect the content, and all legal disclaimers that apply to the journal pertain.
Reference List
- 1.Pasquale EB. Eph receptors and ephrins in cancer: bidirectional signalling and beyond. Nature Reviews Cancer. 2010;10:165–180. doi: 10.1038/nrc2806. [DOI] [PMC free article] [PubMed] [Google Scholar]
- 2.Murai KK, Pasquale EB. 'Eph'ective signaling: forward, reverse and crosstalk. J Cell Sci. 2003;116:2823–2832. doi: 10.1242/jcs.00625. [DOI] [PubMed] [Google Scholar]
- 3.Pratt RL, Kinch MS. Activation of the EphA2 tyrosine kinase stimulates the MAP/ERK kinase signaling cascade. Oncogene. 2002;21:7690–7699. doi: 10.1038/sj.onc.1205758. [DOI] [PubMed] [Google Scholar]
- 4.Wakayama Y, Miura K, Sabe H, Mochizuki N. EphrinA1-EphA2 Signal Induces Compaction and Polarization of Madin-Darby Canine Kidney Cells by Inactivating Ezrin through Negative Regulation of RhoA. J Biol Chem. 2011;286:44243–44253. doi: 10.1074/jbc.M111.267047. [DOI] [PMC free article] [PubMed] [Google Scholar]
- 5.Miura K, Nam JM, Kojima C, Mochizuki N, Sabe H. EphA2 Engages Git1 to Suppress Arf6 Activity Modulating Epithelial Cell–Cell Contacts. Mol Biol Cell. 2009;20:1949–1959. doi: 10.1091/mbc.E08-06-0549. [DOI] [PMC free article] [PubMed] [Google Scholar]
- 6.Park JE, Son AI, Zhou RP. Roles of EphA2 in Development and Disease. Genes. 2013;4:334–357. doi: 10.3390/genes4030334. [DOI] [PMC free article] [PubMed] [Google Scholar]
- 7.Ireton RC, Chen J. EphA2 receptor tyrosine kinase as a promising target for cancer therapeutics. Current Cancer Drug Targets. 2005;5:149–157. doi: 10.2174/1568009053765780. [DOI] [PubMed] [Google Scholar]
- 8.Funk SD, Yurdagul A, Albert P, Traylor JG, Jin L, Chen J, Orr AW. EphA2 Activation Promotes the Endothelial Cell Inflammatory Response A Potential Role in Atherosclerosis. Arteriosclerosis Thrombosis and Vascular Biology. 2012;32:686–U367. doi: 10.1161/ATVBAHA.111.242792. [DOI] [PMC free article] [PubMed] [Google Scholar]
- 9.Andres AC, Reid HH, Zurcher G, Blaschke RJ, Albrecht D, Ziemiecki A. Expression of 2 Novel Eph-Related Receptor Protein-Tyrosine Kinases in Mammary-Gland Development and Carcinogenesis. Oncogene. 1994;9:1461–1467. [PubMed] [Google Scholar]
- 10.Tandon M, Vemula SV, Mittal SK. Emerging strategies for EphA2 receptor targeting for cancer therapeutics. Expert Opinion on Therapeutic Targets. 2011;15:31–51. doi: 10.1517/14728222.2011.538682. [DOI] [PMC free article] [PubMed] [Google Scholar]
- 11.Rong BX, Cai XG, Yang SY, Li W, Ming ZJ. EphA2-Dependent Molecular Targeting Therapy for Malignant Tumors. Current Cancer Drug Targets. 2011;11:1082–1097. doi: 10.2174/156800911798073050. [DOI] [PubMed] [Google Scholar]
- 12.Wykosky J, Debinski W. The EphA2 Receptor and EphrinA1 Ligand in Solid Tumors: Function and Therapeutic Targeting. Molecular Cancer Research. 2008;6:1795–1806. doi: 10.1158/1541-7786.MCR-08-0244. [DOI] [PMC free article] [PubMed] [Google Scholar]
- 13.Himanen JP, Nikolov DB. Eph signaling: a structural view. Trends in Neurosciences. 2003;26:46–51. doi: 10.1016/s0166-2236(02)00005-x. [DOI] [PubMed] [Google Scholar]
- 14.Qiao F, Bowie JU. The many faces of SAM. Sci STKE. 2005;2005:re7. doi: 10.1126/stke.2862005re7. [DOI] [PubMed] [Google Scholar]
- 15.Hui S, Xing X, Bader GD. Predicting PDZ domain mediated protein interactions from structure. Bmc Bioinformatics. 2013:14. doi: 10.1186/1471-2105-14-27. [DOI] [PMC free article] [PubMed] [Google Scholar]
- 16.Miao H, Burnett E, Kinch M, Simon E, Wang BC. Activation of EphA2 kinase suppresses integrin function and causes focal-adhesion-kinase dephosphorylation. Nature Cell Biology. 2000;2:62–69. doi: 10.1038/35000008. [DOI] [PubMed] [Google Scholar]
- 17.Nasreen N, Mohammed KA, Lai Y, Antony VB. Receptor EphA2 activation with ephrinA1 suppresses growth of malignant mesothelioma (MM) Cancer Letters. 2007;258:215–222. doi: 10.1016/j.canlet.2007.09.005. [DOI] [PubMed] [Google Scholar]
- 18.Barquilla A, Pasquale EB. Eph receptors and ephrins: therapeutic opportunities. Annu Rev Pharmacol Toxicol. 2015;55:465–487. doi: 10.1146/annurev-pharmtox-011112-140226. [DOI] [PMC free article] [PubMed] [Google Scholar]
- 19.Miao H, Li DQ, Mukherjee A, Guo H, Petty A, Cutter J, Basilion JP, Sedor J, Wu J, Danielpour D, Sloan AE, Cohen ML, Wang BC. EphA2 Mediates Ligand-Dependent Inhibition and Ligand-Independent Promotion of Cell Migration and Invasion via a Reciprocal Regulatory Loop with Akt. Cancer Cell. 2009;16:9–20. doi: 10.1016/j.ccr.2009.04.009. [DOI] [PMC free article] [PubMed] [Google Scholar]
- 20.Macrae M, Neve RM, Rodriguez-Viciana P, Haqq C, Yeh J, Chen CR, Gray JW, McCormick F. A conditional feedback loop regulates Ras activity through EphA2. Cancer Cell. 2005;8:111–118. doi: 10.1016/j.ccr.2005.07.005. [DOI] [PubMed] [Google Scholar]
- 21.Singh DR, Ahmed F, King C, Gupta N, Salotto M, Pasquale EB, Hristova K. EphA2 Receptor Unliganded Dimers Suppress EphA2 Pro-tumorigenic Signaling. J Biol Chem. 2015;290:27271–27279. doi: 10.1074/jbc.M115.676866. [DOI] [PMC free article] [PubMed] [Google Scholar]
- 22.Seiradake E, Schaupp A, Ruiz DDT, Kaufmann R, Mitakidis N, Harlos K, Aricescu AR, Klein R, Jones EY. Structurally encoded intraclass differences in EphA clusters drive distinct cell responses. Nature Structural & Molecular Biology. 2013;20:958. doi: 10.1038/nsmb.2617. [DOI] [PMC free article] [PubMed] [Google Scholar]
- 23.Seiradake E, Harlos K, Sutton G, Aricescu AR, Jones EY. An extracellular steric seeding mechanism for Eph-ephrin signaling platform assembly. Nature Structural & Molecular Biology. 2010;17:398–U27. doi: 10.1038/nsmb.1782. [DOI] [PMC free article] [PubMed] [Google Scholar]
- 24.Himanen JP, Yermekbayeva L, Janes PW, Walker JR, Xu K, Atapattu L, Rajashankar KR, Mensinga A, Lackmann M, Nikolov DB, Dhe-Paganon S. Architecture of Eph receptor clusters. Proceedings of the National Academy of Sciences of the United States of America. 2010;107:10860–10865. doi: 10.1073/pnas.1004148107. [DOI] [PMC free article] [PubMed] [Google Scholar]
- 25.Smalla M, Schmieder P, Kelly M, Ter Laak A, Krause G, Ball L, Wahl M, Bork P, Oschkinat H. Solution structure of the receptor tyrosine kinase EphB2 SAM domain and identification of two distinct homotypic interaction sites. Protein Sci. 1999;8:1954–1961. doi: 10.1110/ps.8.10.1954. [DOI] [PMC free article] [PubMed] [Google Scholar]
- 26.Thanos CD, Goodwill KE, Bowie JU. Oligomeric structure of the human EphB2 receptor SAM domain. Science. 1999;283:833–836. doi: 10.1126/science.283.5403.833. [DOI] [PubMed] [Google Scholar]
- 27.Stapleton D, Balan I, Pawson T, Sicheri F. The crystal structure of an Eph receptor SAM domain reveals a mechanism for modular dimerization. Nature Struct Biol. 1999;6:44–49. doi: 10.1038/4917. [DOI] [PubMed] [Google Scholar]
- 28.Park JE, Son AI, Hua R, Wang LQ, Zhang X, Zhou RP. Human Cataract Mutations in EPHA2 SAM Domain Alter Receptor Stability and Function. PLoS ONE. 2012:7. doi: 10.1371/journal.pone.0036564. [DOI] [PMC free article] [PubMed] [Google Scholar]
- 29.Jun G, Guo H, Klein BEK, Klein R, Wang JJ, Mitchell P, Miao H, Lee KE, Joshi T, Buck M, Chugha P, Bardenstein D, Klein AP, Bailey-Wilson JE, Gong XH, Spector TD, Andrew T, Hammond CJ, Elston RC, Iyengar SK, Wang BC. EPHA2 Is Associated with Age-Related Cortical Cataract in Mice and Humans. Plos Genetics. 2009:5. doi: 10.1371/journal.pgen.1000584. [DOI] [PMC free article] [PubMed] [Google Scholar]
- 30.Shiels A, Bennett TM, Knopf HLS, Maraini G, Li AR, Jiao XD, Hejtmancik JF. The EPHA2 gene is associated with cataracts linked to chromosome 1p. Molecular Vision. 2008;14:2042–2055. [PMC free article] [PubMed] [Google Scholar]
- 31.Zhang TX, Hua R, Xiao W, Burdon KP, Bhattacharya SS, Craig JE, Shang D, Zhao XL, Mackey DA, Moore AT, Luo Y, Zhang JS, Zhang X. Mutations of the EPHA2 Receptor Tyrosine Kinase Gene Cause Autosomal Dominant Congenital Cataract. Human Mutation. 2009;30:E603–E610. doi: 10.1002/humu.20995. [DOI] [PubMed] [Google Scholar]
- 32.Leone M, Cellitti J, Pellecchia M. NMR Studies of a Heterotypic Sam-Sam Domain Association: The Interaction between the Lipid Phosphatase Ship2 and the EphA2 Receptor. Biochemistry. 2008;47:12721–12728. doi: 10.1021/bi801713f. [DOI] [PMC free article] [PubMed] [Google Scholar]
- 33.Zhuang GL, Hunter S, Hwang Y, Chen J. Regulation of EphA2 receptor endocytosis by SHIP2 lipid phosphatase via phosphatidylinositol 3-kinase-dependent Rac1 activation. J Biol Chem. 2007;282:2683–2694. doi: 10.1074/jbc.M608509200. [DOI] [PubMed] [Google Scholar]
- 34.Lee HJ, Hota PK, Chugha P, Guo H, Miao H, Zhang LQ, Kim SJ, Stetzik L, Wang BC, Buck M. NMR Structure of a Heterodimeric SAM:SAM Complex: Characterization and Manipulation of EphA2 Binding Reveal New Cellular Functions of SHIP2. Structure. 2012;20:41–55. doi: 10.1016/j.str.2011.11.013. [DOI] [PMC free article] [PubMed] [Google Scholar]
- 35.Borthakur S, Lee H, Kim S, Wang BC, Buck M. Binding and Function of Phosphotyrosines of the Ephrin A2 (EphA2) Receptor Using Synthetic Sterile alpha Motif (SAM) Domains. J Biol Chem. 2014;289:19694–19703. doi: 10.1074/jbc.M114.567602. [DOI] [PMC free article] [PubMed] [Google Scholar]
- 36.Chen LR, Novicky L, Merzlyakov M, Hristov T, Hristova K. Measuring the Energetics of Membrane Protein Dimerization in Mammalian Membranes. J Am Chem Soc. 2010;132:3628–3635. doi: 10.1021/ja910692u. [DOI] [PMC free article] [PubMed] [Google Scholar]
- 37.Sarabipour S, Del Piccolo N, Hristova K. Characterization of Membrane Protein Interactions in Plasma Membrane Derived Vesicles with Quantitative Imaging Forster Resonance Energy Transfer. Acc Chem Res. 2015;48:2262–2269. doi: 10.1021/acs.accounts.5b00238. [DOI] [PMC free article] [PubMed] [Google Scholar]
- 38.King C, Stoneman M, Raicu V, Hristova K. Fully quantified spectral imaging reveals in vivo membrane protein interactions. Integr Biol (Camb ) 2016;8:216–229. doi: 10.1039/c5ib00202h. [DOI] [PMC free article] [PubMed] [Google Scholar]
- 39.Singh DR, Cao Q, King C, Salotto M, Ahmed F, Zhou XY, Pasquale EB, Hristova K. Unliganded EphA3 dimerization promoted by the SAM domain. Biochem J. 2015;471:101–109. doi: 10.1042/BJ20150433. [DOI] [PMC free article] [PubMed] [Google Scholar]
- 40.Sinha B, Koster D, Ruez R, Gonnord P, Bastiani M, Abankwa D, Stan RV, Butler-Browne G, Vedie B, Johannes L, Morone N, Parton RG, Raposo G, Sens P, Lamaze C, Nassoy P. Cells respond to mechanical stress by rapid disassembly of caveolae. Cell. 2011;144:402–413. doi: 10.1016/j.cell.2010.12.031. [DOI] [PMC free article] [PubMed] [Google Scholar]
- 41.Raicu V, Stoneman MR, Fung R, Melnichuk M, Jansma DB, Pisterzi LF, Rath S, Fox M, Wells JW, Saldin DK. Determination of supramolecular structure and spatial distribution of protein complexes in living cells. Nature Photonics. 2009;3:107–113. [Google Scholar]
- 42.Biener G, Stoneman MR, Acbas G, Holz JD, Orlova M, Komarova L, Kuchin S, Raicu V. Development and Experimental Testing of an Optical Micro-Spectroscopic Technique Incorporating True Line-Scan Excitation. International Journal of Molecular Sciences. 2014;15:261–276. doi: 10.3390/ijms15010261. [DOI] [PMC free article] [PubMed] [Google Scholar]
- 43.King C, Sarabipour S, Byrne P, Leahy DJ, Hristova K. The FRET signatures of non-interacting proteins in membranes: simulations and experiments. Biophys J. 2014;106:1309–1317. doi: 10.1016/j.bpj.2014.01.039. [DOI] [PMC free article] [PubMed] [Google Scholar]
- 44.Evers TH, van Dongen EMWM, Faesen AC, Meijer EW, Merkx M. Quantitative understanding of the energy transfer between fluorescent proteins connected via flexible peptide linkers. Biochemistry. 2006;45:13183–13192. doi: 10.1021/bi061288t. [DOI] [PubMed] [Google Scholar]
- 45.Sarabipour S, Hristova K. FGFR3 Unliganded Dimer Stabilization by the Juxtamembrane Domain. J Mol Biol. 2015;427:1705–1714. doi: 10.1016/j.jmb.2015.02.013. [DOI] [PMC free article] [PubMed] [Google Scholar]
- 46.Adler J, Shevchuk AI, Novak P, Korchev YE, Parmryd I. Plasma membrane topography and interpretation of single-particle tracks. Nat Methods. 2010;7:170–171. doi: 10.1038/nmeth0310-170. [DOI] [PubMed] [Google Scholar]
- 47.Parmryd I, Onfelt B. Consequences of membrane topography. FEBS J. 2013;280:2775–2784. doi: 10.1111/febs.12209. [DOI] [PubMed] [Google Scholar]
- 48.Grasberger B, Minton AP, DeLisi C, Metzger H. Interaction Between Proteins Localized in Membranes. Proceedings of the National Academy of Sciences of the United States of America. 1986;83:6258–6262. doi: 10.1073/pnas.83.17.6258. [DOI] [PMC free article] [PubMed] [Google Scholar]
- 49.He L, Hristova K. Physical-chemical principles underlying RTK activation, and their implications for human disease. Biochim Biophys Acta. 2012;1818:995–1005. doi: 10.1016/j.bbamem.2011.07.044. [DOI] [PMC free article] [PubMed] [Google Scholar]
- 50.Kim CA, Bowie JU. SAM domains: uniform structure, diversity of function. Trends Biochem Sci. 2003;28:625–628. doi: 10.1016/j.tibs.2003.11.001. [DOI] [PubMed] [Google Scholar]
- 51.Kullander K, Mather NK, Diella F, Dottori M, Boyd AW, Klein R. Kinase-dependent and kinase-independent functions of EphA4 receptors in major axon tract formation in vivo. Neuron. 2001;29:73–84. doi: 10.1016/s0896-6273(01)00181-7. [DOI] [PubMed] [Google Scholar]
- 52.Liu Y, Lan XL, Wu T, Lang JT, Jin XY, Sun X, Wen Q, An R. Tc-99m-labeled SWL specific peptide for targeting EphA2 receptor. Nuclear Medicine and Biology. 2014;41:450–456. doi: 10.1016/j.nucmedbio.2014.03.020. [DOI] [PubMed] [Google Scholar]


