Abstract
The data presented in this article are related to the research article, “HPLC-based enzyme kinetics assay for glucosinolate hydrolysis facilitate analysis of systems with both multiple reaction products and thermal enzyme denaturation” (C.K. Klingaman, M.J. Wagner, J.R. Brown, J.B. Klecker, E.H. Pauley, C.J. Noldner, J.R. Mays,) [1]. This data article describes (1) the synthesis and spectral characterization data of a non-natural glucosinolate analogue, 2,2-diphenylethyl glucosinolate, (2) HPLC standardization data for glucosinolate, isothiocyanate, nitrile, and amine analytes, (3) reaction progress curve data for enzymatic hydrolysis reactions with variable substrate concentration, enzyme concentration, buffer pH, and temperature, and (4) normalized initial velocities of hydrolysis/formation for analytes. These data provide a comprehensive description of the enzyme-catalyzed hydrolysis of 2,2-diphenylethyl glucosinolate (5) and glucotropaeolin (6) under widely varied conditions.
Specifications Table
| Subject area | Biochemistry |
| More specific subject area | Enzymology |
| Type of data | Synthetic experimentals/characterization, tables, graphs, figures |
| How data was acquired | NMR (JEOL ECS-400 400 MHz), IR (Nicolet Avatar FTIR), UV–vis (Shimadzu UV-2450 with TCC-240A cell chamber), HPLC (Agilent 1200 system with degasser, photodiode array detector, and temperature-controlled autosampler) |
| Data format | Analyzed |
| Experimental factors | All analytical standards and reagents were confirmed to be >95% purity |
| Experimental features | The synthesis and characterization of 2,2-diphenylethyl glucosinolate; HPLC standardization of glucosinolate, isothiocyanate, nitrile, and amine analytes; HPLC reaction progress curves for experiments with (1) variable substrate concentration, (2) variable enzyme concentration, (3) variable buffer pH, and (4) variable temperature; tables of initial velocities of hydrolysis/formation |
| Data source location | Sioux Falls, SD |
| Data accessibility | The data are available with this article. |
Value of the data
-
•
The experimental methods and characterization of 2,2-diphenylethyl glucosinolate and intermediates could be useful toward preparation of synthetic glucosinolates.
-
•
HPLC standardization of glucosinolate, isothiocyanate, nitrile, and amine analytes could be useful toward individuals analyzing these compounds.
-
•
Complete reaction progress curve datasets for enzymatic hydrolysis reactions conducted with variable experimental conditions provide a comprehensive dataset for this type of enzymatic transformation.
-
•
Tables of normalized velocities of hydrolysis and product formation provide a complete, quantitative perspective of these enzymatic reactions.
1. Data
This article describes the synthesis and characterization data of the non-natural glucosinolate, 2,2-diphenylethyl glucosinolate (5), and data related to the kinetic analysis of this compound and glucotropaeolin (6) with Sinapis alba myrosinase. This body of data is related to the methodological innovations and enzymological studies described in the related article, “HPLC-based kinetics assay facilitates analysis of systems with multiple reactions components and thermal enzyme denaturation” [1]; to improve clarity, compound numbering from the related article has been retained.
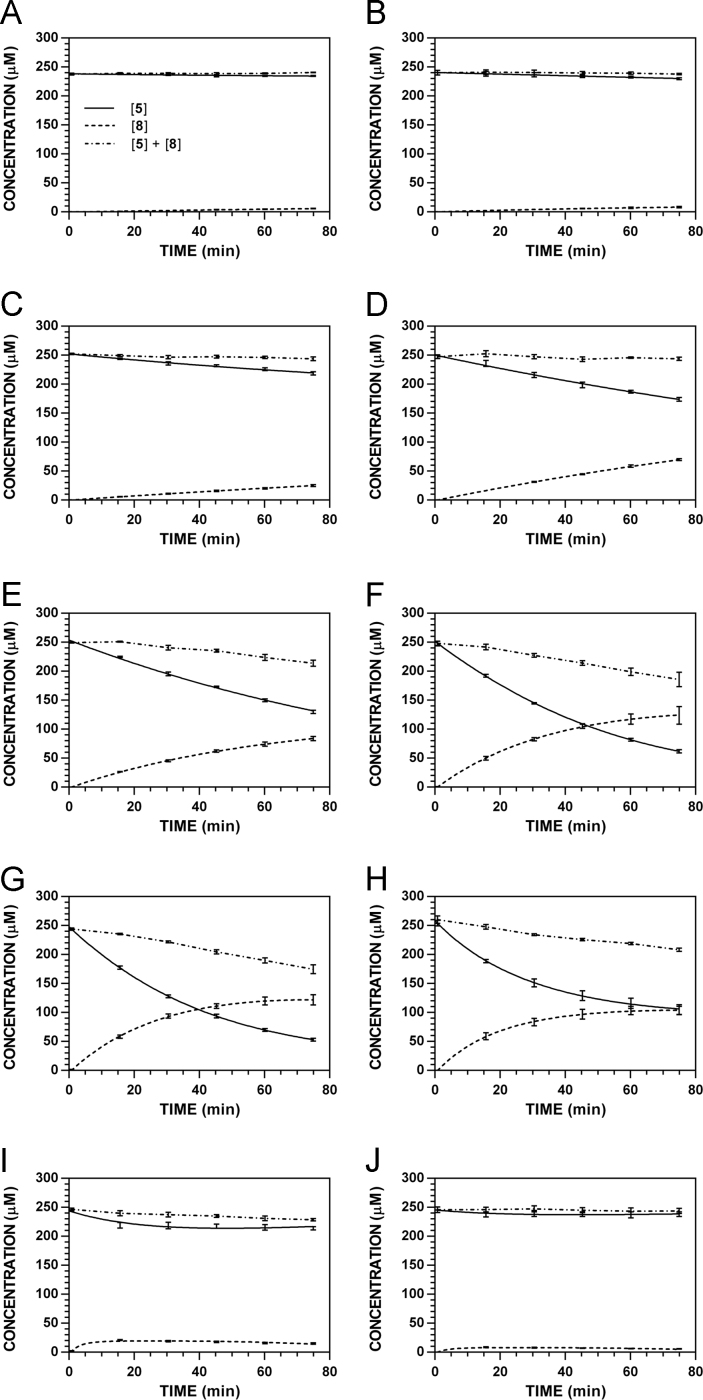
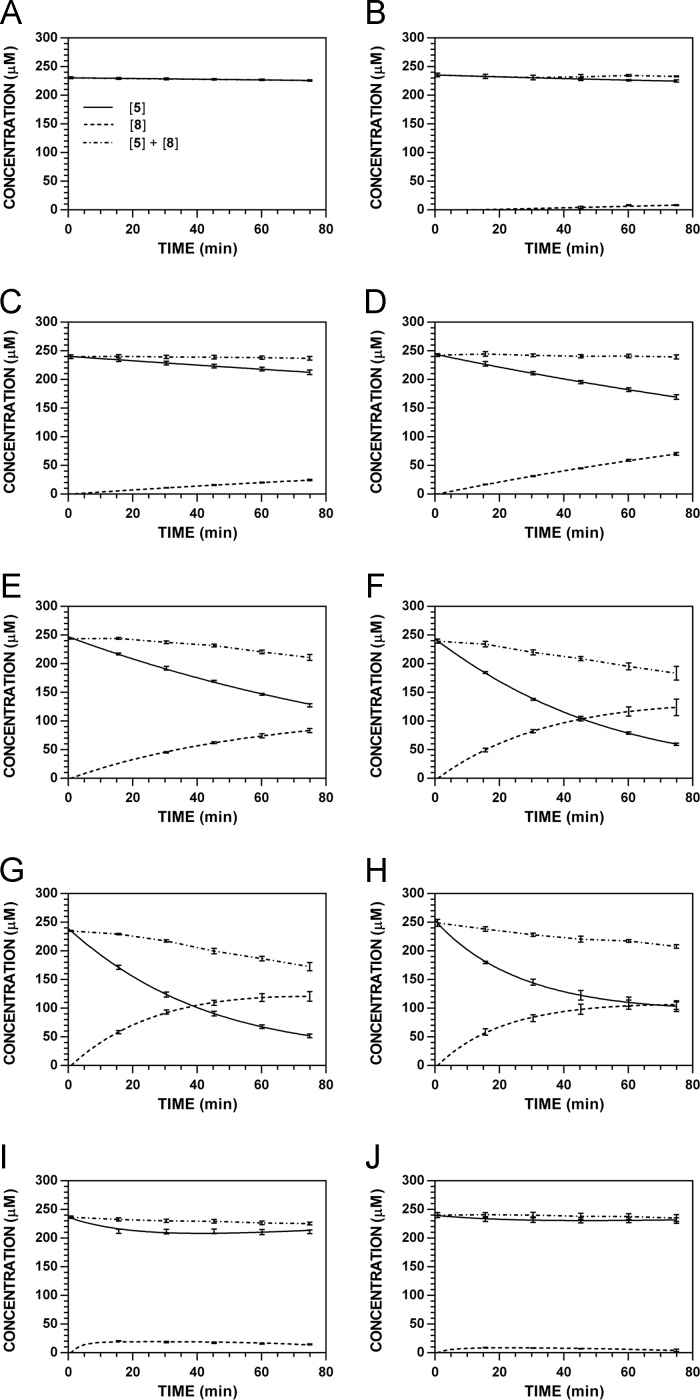
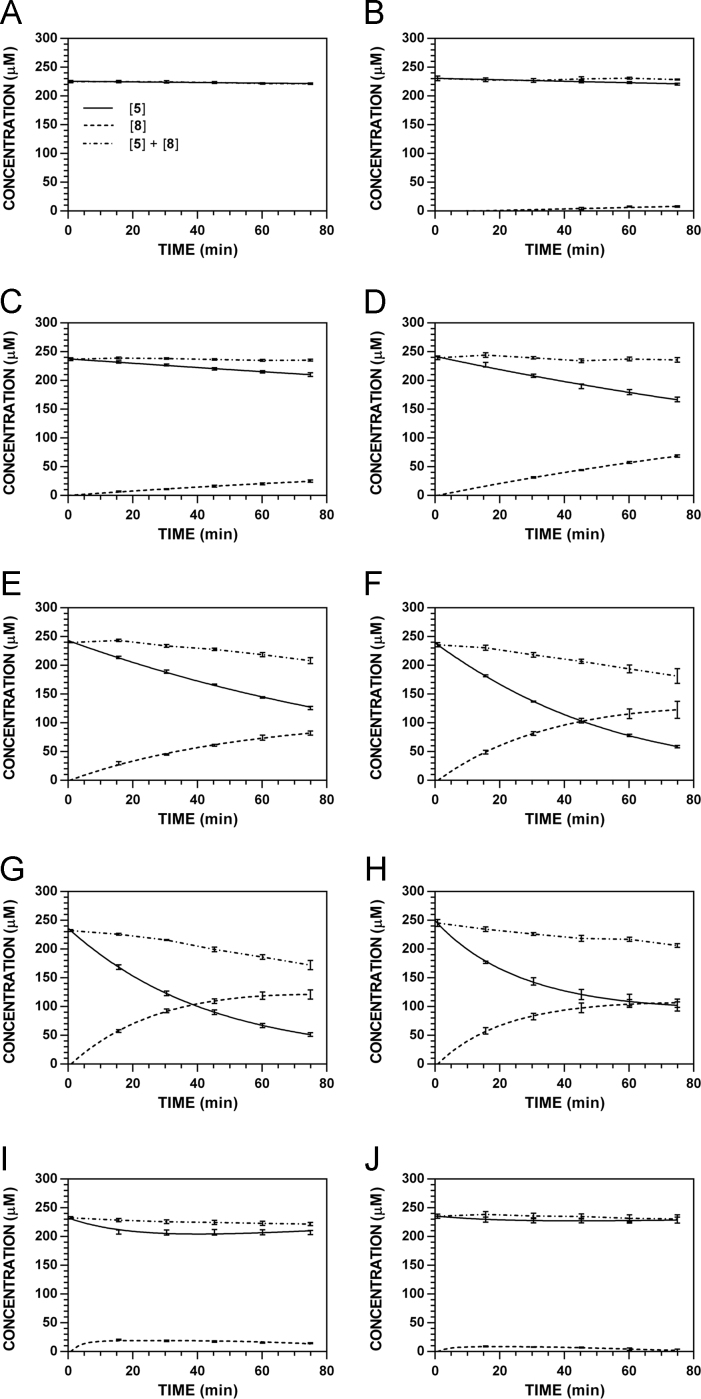
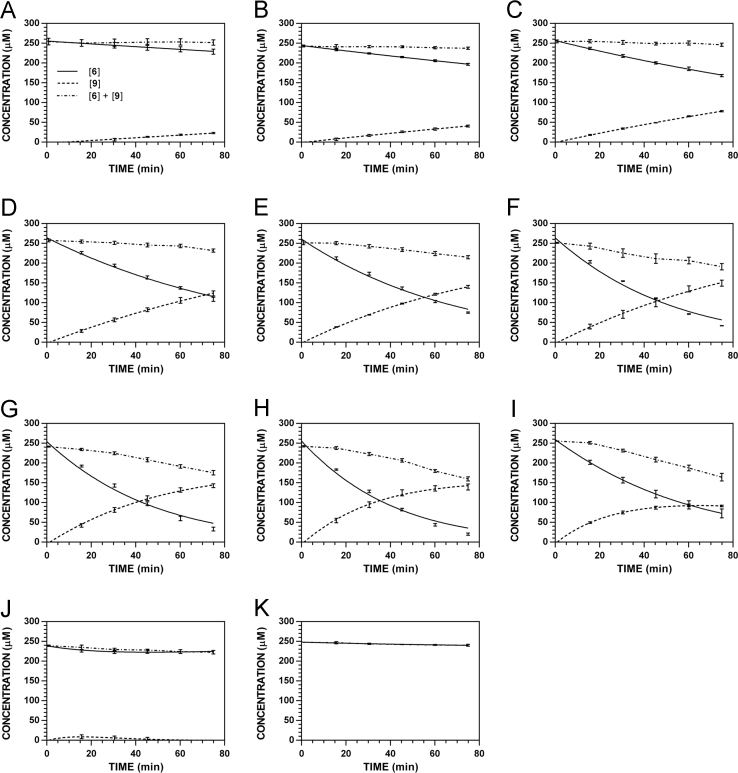
The data presented in Fig. 1, Fig. 2, Fig. 3, Fig. 4, Fig. 5, Fig. 6, Fig. 7, Fig. 8, Fig. 9 describe the standardization of enzyme and analytes. Reaction progress curve data is provided for experiments evaluating the effects of variable substrate concentration (Fig. 10, Fig. 11, Fig. 12, Fig. 13, [Myr] = 8.83 U ml−1), variable enzyme concentration (Fig. 14), variable pH (Fig. 15, Fig. 16, Fig. 17, Fig. 18, [Myr] = 8.83 U ml−1; Fig. 19, Fig. 20, Fig. 21, [Myr] = 1.77 U ml−1), and variable temperature (Fig. 22, Fig. 23, Fig. 24, Fig. 25, [Myr] = 7.06 U ml−1; Fig. 26, Fig. 27, Fig. 28, [Myr] = 1.77 U ml−1). Reaction progress curve data was fit to the modified Lambert W(x) using nonlinear regression [1]. Initial rates were independently obtained from progress curves tracking analyte ([Gluc]t, [ITC]t, or [nitrile]t) at a specific wavelength, then normalized for the concentration of myrosinase (V0 [Myr]−1, min−1) [1]. Complete original datasets for each figure are provided as Supplementary material.
Fig. 1.

Representative data to determine the specific activity of 10 mg ml−1 myrosinase stock solutions. Rates were determined for the hydrolysis of sinigrin ([7]0 = 250 μM) at 227 nm (Δε227 = 6458 M−1 cm−1) for 5 min [2,3].
Fig. 2.
HPLC standardization curves for glucosinolate 5. A. 220 nm. B. 227 nm. C. 235 nm. D. 241 nm.
Fig. 3.
HPLC standardization curves for isothiocyanate 8. A. 220 nm. B. 227 nm. C. 235 nm. D. 241 nm.
Fig. 4.
HPLC standardization curves for nitrile 10. A. 220 nm. B. 227 nm. C. 235 nm. D. 241 nm.
Fig. 5.
HPLC standardization curves for amine 12. A. 220 nm. B. 227 nm. C. 235 nm. D. 241 nm.
Fig. 6.

HPLC standardization curves for glucosinolate 6. A. 227 nm. B. 235 nm. C. 241 nm.
Fig. 7.
HPLC standardization curves for isothiocyanate 9. A. 227 nm. B. 235 nm. C. 241 nm.
Fig. 8.

HPLC standardization curve for nitrile 11. A. 210 nm.
Fig. 9.

HPLC standardization curve for amine 13. A. 210 nm.
Fig. 10.
Reaction progress curves for the conversion of 5 to 8 at pH 7.4 and 37 °C (220 nm). A. [5]0 = 1000 μM. B. [5]0 = 500 μM. C. [5]0 = 250 μM. D. [5]0 = 125 μM. E. [5]0 = 62.5 μM. F. [5]0 = 31.3 μM.
Fig. 11.
Reaction progress curves for the conversion of 5 to 8 at pH 7.4 and 37 °C (227 nm). A. [5]0 = 1000 μM. B. [5]0 = 500 μM. C. [5]0 = 250 μM. D. [5]0 = 125 μM. E. [5]0 = 62.5 μM. F. [5]0 = 31.3 μM. Panels A, C, and E appeared as representative data in C. A. Klingaman et. al and are included to provide a comprehensive perspective on this dataset (Fig. 2 in [1]).
Fig. 12.
Reaction progress curves for the conversion of 5 to 8 at pH 7.4 and 37 °C (235 nm). A. [5]0 = 1000 μM. B. [5]0 = 500 μM. C. [5]0 = 250 μM. D. [5]0 = 125 μM. E. [5]0 = 62.5 μM. F. [5]0 = 31.3 μM.
Fig. 13.
Reaction progress curves for the conversion of 5 to 8 at pH 7.4 and 37 °C (241 nm). A. [5]0 = 1000 μM. B. [5]0 = 500 μM. C. [5]0 = 250 μM. D. [5]0 = 125 μM. E. [5]0 = 62.5 μM. F. [5]0 = 31.3 μM.
Fig. 14.
Enzyme-dependence on reaction progress curves for [5]t and [8]t at pH 7.4 and 37 °C ([5]0 = 250 μM). A. [5]t, 220 nm. B. [8]t, 220 nm. C. [5]t, 235 nm. D. [8]t, 235 nm. E. [5]t, 241 nm. F. [5]t, 241 nm.
Fig. 15.
Reaction progress curves for the hydrolysis of 5 ([5]0 = 250 μM) at variable pH and 37 °C (220 nm). A. pH 2.0. B. pH 3.0. C. pH 4.0. D. pH 5.0. E. pH 6.0. F. pH 7.4. G. pH 8.0. H. pH 9.0. I. pH 10.0.
Fig. 16.
Reaction progress curves for the hydrolysis of 5 ([5]0 = 250 μM) at variable pH and 37 °C (227 nm). A. pH 2.0. B. pH 3.0. C. pH 4.0. D. pH 5.0. E. pH 6.0. F. pH 7.4. G. pH 8.0. H. pH 9.0. I. pH 10.0. Panels B, E, and I appeared as representative data in C. A. Klingaman et. al and are included to provide a comprehensive perspective on this dataset (Fig. 6 in [1]).
Fig. 17.
Reaction progress curves for the hydrolysis of 5 ([5]0 = 250 μM) at variable pH and 37 °C (235 nm). A. pH 2.0. B. pH 3.0. C. pH 4.0. D. pH 5.0. E. pH 6.0. F. pH 7.4. G. pH 8.0. H. pH 9.0. I. pH 10.0.
Fig. 18.
Reaction progress curves for the hydrolysis of 5 ([5]0 = 250 μM) at variable pH and 37 °C (241 nm). A. pH 2.0. B. pH 3.0. C. pH 4.0. D. pH 5.0. E. pH 6.0. F. pH 7.4. G. pH 8.0. H. pH 9.0. I. pH 10.0.
Fig. 19.
Reaction progress curves for the hydrolysis of 6 ([6]0 = 250 μM) at variable pH and 37 °C (6/9: 227 nm, 11: 210 nm). A. pH 2.0. B. pH 3.0. C. pH 4.0. D. pH 5.0. E. pH 6.0. F. pH 7.4. G. pH 8.0. H. pH 9.0. I. pH 10.0. Panels B, E, and I appeared as representative data in C. A. Klingaman et. al and are included to provide a comprehensive perspective on this dataset (Fig. 6 in [1]).
Fig. 20.
Reaction progress curves for the hydrolysis of 6 ([6]0 = 250 μM) at variable pH and 37 °C (6/9: 235 nm, 11: 210 nm). A. pH 2.0. B. pH 3.0. C. pH 4.0. D. pH 5.0. E. pH 6.0. F. pH 7.4. G. pH 8.0. H. pH 9.0. I. pH 10.0.
Fig. 21.
Reaction progress curves for the hydrolysis of 6 ([6]0 = 250 μM) at variable pH and 37 °C (6/9: 241 nm, 11: 210 nm). A. pH 2.0. B. pH 3.0. C. pH 4.0. D. pH 5.0. E. pH 6.0. F. pH 7.4. G. pH 8.0. H. pH 9.0. I. pH 10.0.
Fig. 22.
Reaction progress curves for the hydrolysis of 5 ([5]0 = 250 μM) at variable temperature and pH 7.4 (220 nm). A. 9 °C. B. 18 °C. C. 28.5 °C. D. 37 °C. E. 45 °C. F. 55 °C. G. 60 °C. H. 65 °C. I. 70 °C. J. 75 °C.
Fig. 23.
Reaction progress curves for the hydrolysis of 5 ([5]0 = 250 μM) at variable temperature and pH 7.4 (227 nm). A. 9 °C. B. 18 °C. C. 28.5 °C. D. 37 °C. E. 45 °C. F. 55 °C. G. 60 °C. H. 65 °C. I. 70 °C. J. 75 °C. Panels B, E, and H appeared as representative data in C. A. Klingaman et. al and are included to provide a comprehensive perspective on this dataset (Fig. 8 in [1]).
Fig. 24.
Reaction progress curves for the hydrolysis of 5 ([5]0 = 250 μM) at variable temperature and pH 7.4 (235 nm). A. 9 °C. B. 18 °C. C. 28.5 °C. D. 37 °C. E. 45 °C. F. 55 °C. G. 60 °C. H. 65 °C. I. 70 °C. J. 75 °C.
Fig. 25.
Reaction progress curves for the hydrolysis of 5 ([5]0 = 250 μM) at variable temperature and pH 7.4 (241 nm). A. 9 °C. B. 18 °C. C. 28.5 °C. D. 37 °C. E. 45 °C. F. 55 °C. G. 60 °C. H. 65 °C. I. 70 °C. J. 75 °C.
Fig. 26.
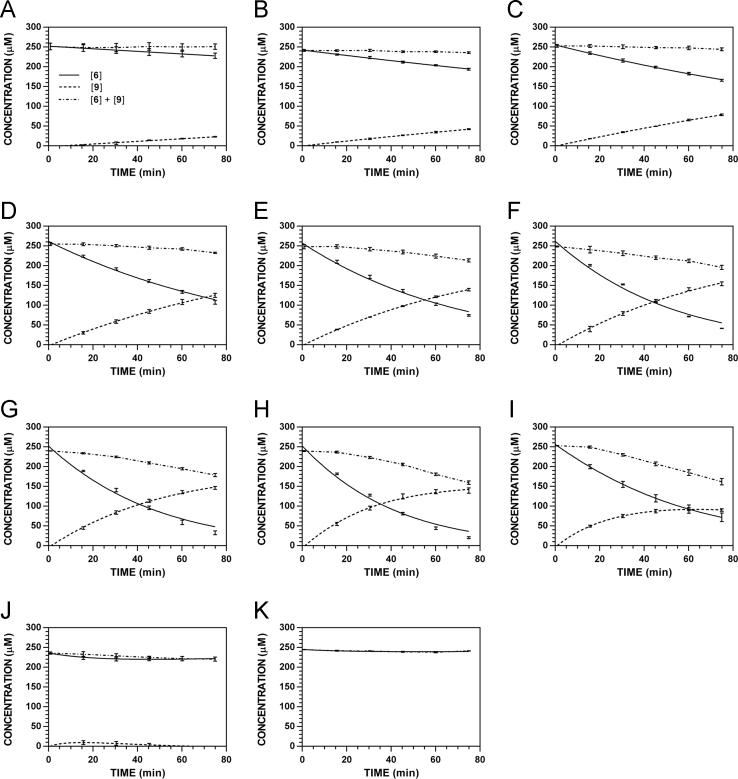
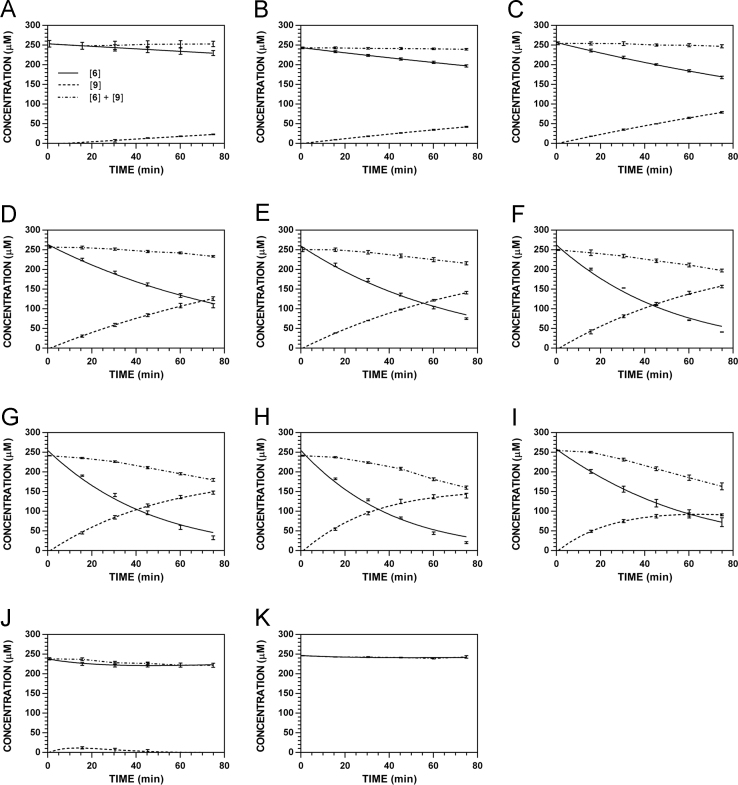
Reaction progress curves for the hydrolysis of 6 ([6]0 = 250 μM) at variable temperature and pH 7.4 (227 nm). A. 10.1 °C. B. 17.8 °C. C. 28.5 °C. D. 37 °C. E. 45 °C. F. 50 °C. G. 55 °C. H. 60 °C. I. 65 °C. J. 75 °C. K. 85 °C. Panels B, E, and I appeared as representative data in C. A. Klingaman et. al and are included to provide a comprehensive perspective on this dataset (Fig. 8 in [1]).
Fig. 27.
Reaction progress curves for the hydrolysis of 6 ([6]0 = 250 μM) at variable temperature and pH 7.4 (235 nm). A. 10.1 °C. B. 17.8 °C. C. 28.5 °C. D. 37 °C. E. 45 °C. F. 50 °C. G. 55 °C. H. 60 °C. I. 65 °C. J. 75 °C. K. 85 °C.
Fig. 28.
Reaction progress curves for the hydrolysis of 6 ([6]0 = 250 μM) at variable temperature and pH 7.4 (241 nm). A. 10.1 °C. B. 17.8 °C. C. 28.5 °C. D. 37 °C. E. 45 °C. F. 50 °C. G. 55 °C. H. 60 °C. I. 65 °C. J. 75 °C. K. 85 °C.
1.1. Determination of myrosinase specific activity
1.2. HPLC standardization of analytes
Fig. 2, Fig. 3, Fig. 4, Fig. 5, Fig. 6, Fig. 7, Fig. 8, Fig. 9.
1.3. Reaction progress curves
1.3.1. Variable concentration of substrate
1.3.2. Variable concentration of enzyme
1.3.3. Variable pH
Fig. 15, Fig. 16, Fig. 17, Fig. 18, Fig. 19, Fig. 20, Fig. 21.
1.3.4. Variable temperature
Fig. 22, Fig. 23, Fig. 24, Fig. 25, Fig. 26, Fig. 27, Fig. 28.
1.4. Tables of initial velocities
1.4.1. Variable concentration of substrate
Table 1.
Initial rates of hydrolysis of 5 and observed formation of 8 (pH 7.4, 37 °C) by Sinapis alba myrosinase. The concentration of myrosinase was constant (8.83 U ml−1).
| [Gluc]0(μM) |
Δ[5] Δt−1(μM min−1) |
|||
|---|---|---|---|---|
| 220 nm | 227 nm | 235 nm | 241 nm | |
| 1000 | −4.11 | −4.24 | −4.16 | −4.31 |
| 500 | −2.74 | −2.82 | −2.89 | −2.77 |
| 250 | −1.75 | −1.70 | −1.67 | −1.64 |
| 125 | −1.12 | −1.06 | −1.07 | −1.03 |
| 62.5 | −0.65 | −0.66 | −0.71 | −0.70 |
| 31.3 | −0.46 | −0.48 | −0.51 | −0.48 |
| Δ[8]obsΔt−1(μM min−1) | ||||
| 1000 | 4.48 | 4.83 | 4.65 | 4.76 |
| 500 | 2.70 | 2.99 | 3.89 | 3.54 |
| 250 | 1.63 | 1.67 | 1.71 | 1.68 |
| 125 | 0.96 | 1.00 | 1.10 | 1.05 |
| 62.5 | 0.62 | 0.72 | 0.74 | 0.67 |
| 31.3 | 0.45 | 0.46 | 0.49 | 0.47 |
1.4.2. Variable concentration of enzyme
Table 2.
Enzyme-dependence on the rate of conversion for 5 ([5]0 = 250 μM) to 8 (pH 7.4, 37 °C). The concentration of myrosinase ([Myr]) was 100%, 67%, 33%, and 0% of a maximum value (8.83 U ml−1). Reaction progress curves for [ITC]t with 0% [Myr] were not generated due to negligible levels of detected [ITC] [1].
| [Myr] (relative) |
Δ[5] Δt−1(μM min−1) |
|||
|---|---|---|---|---|
| 220 nm | 227 nm | 235 nm | 241 nm | |
| 100% | −1.75 | −1.70 | −1.67 | −1.64 |
| 67% | −0.95 | −0.93 | −0.91 | −1.01 |
| 33% | −0.58 | −0.57 | −0.53 | −0.48 |
| 0% | 0.03 | 0.06 | 0.05 | 0.00 |
| Δ[8]obsΔt−1(μM min−1) | ||||
| 100% | 1.63 | 1.67 | 1.71 | 1.68 |
| 67% | 0.96 | 0.89 | 1.00 | 0.96 |
| 33% | 0.47 | 0.46 | 0.45 | 0.46 |
1.4.3. Variable pH
Table 3.
pH Dependence of the action of Sinapis alba myrosinase on the rate constant for glucosinolate hydrolysis ([Gluc]0 = 250 μM, 37 °C).
| pH |
Δ[5] Δt−1[Myr]−1(min−1) |
Δ[6] Δt−1[Myr]−1(min−1) |
|||||
|---|---|---|---|---|---|---|---|
| 220 nm | 227 nm | 235 nm | 241 nm | 227 nm | 235 nm | 241 nm | |
| 2.0 | 0.00 | 0.00 | 0.00 | 0.00 | 0.01 | 0.00 | 0.00 |
| 3.0 | 0.27 | 0.26 | 0.27 | 0.28 | 0.95 | 0.95 | 0.97 |
| 4.0 | 0.43 | 0.43 | 0.43 | 0.43 | 1.27 | 1.23 | 1.28 |
| 5.0 | 0.40 | 0.38 | 0.36 | 0.36 | 1.18 | 1.27 | 1.30 |
| 6.0 | 0.34 | 0.34 | 0.34 | 0.33 | 1.28 | 1.23 | 1.19 |
| 7.4 | 0.20 | 0.19 | 0.19 | 0.19 | 1.23 | 1.25 | 1.27 |
| 8.0 | 0.22 | 0.18 | 0.19 | 0.22 | 1.21 | 1.19 | 1.22 |
| 9.0 | 0.17 | 0.17 | 0.17 | 0.18 | 1.10 | 1.07 | 1.15 |
| 10.0 | 0.13 | 0.12 | 0.14 | 0.12 | 1.07 | 1.05 | 1.08 |
Table 4.
pH Dependence of the action of Sinapis alba myrosinase on the rate constant for observed ITC formation ([Gluc]0 = 250 μM, 37 °C).
| pH |
Δ[8]obsΔt−1[Myr]−1(min−1) |
Δ[9]obsΔt−1[Myr]−1(min−1) |
|||||
|---|---|---|---|---|---|---|---|
| 220 nm | 227 nm | 235 nm | 241 nm | 227 nm | 235 nm | 241 nm | |
| 2.0 | 0.00 | 0.00 | 0.00 | 0.00 | 0.00 | 0.00 | 0.00 |
| 3.0 | 0.08 | 0.09 | 0.09 | 0.08 | 0.40 | 0.41 | 0.39 |
| 4.0 | 0.32 | 0.31 | 0.33 | 0.33 | 1.07 | 1.09 | 1.09 |
| 5.0 | 0.34 | 0.34 | 0.35 | 0.35 | 1.29 | 1.31 | 1.31 |
| 6.0 | 0.31 | 0.31 | 0.33 | 0.32 | 1.15 | 1.16 | 1.16 |
| 7.4 | 0.18 | 0.19 | 0.19 | 0.19 | 1.23 | 1.28 | 1.27 |
| 8.0 | 0.20 | 0.18 | 0.19 | 0.18 | 1.31 | 1.37 | 1.27 |
| 9.0 | 0.17 | 0.16 | 0.17 | 0.17 | 1.08 | 1.11 | 1.10 |
| 10.0 | 0.16 | 0.15 | 0.18 | 0.16 | 0.98 | 1.03 | 1.03 |
Table 5.
pH Dependence of the action of Sinapis alba myrosinase on the rate constant for observed nitrile formation ([Gluc]0 = 250 μM, 37 °C).
| pH |
Δ[10]obsΔt−1[Myr]−1(min−1) |
Δ[11]obsΔt−1[Myr]−1(min−1) | |||
|---|---|---|---|---|---|
| 220 nm | 227 nm | 235 nm | 241 nm | 210 nm | |
| 2.0 | 0.00 | 0.00 | 0.00 | 0.00 | 0.00 |
| 3.0 | 0.18 | 0.18 | 0.16 | 0.14 | 0.54 |
| 4.0 | 0.11 | 0.11 | 0.11 | 0.08 | 0.18 |
| 5.0 | 0.02 | 0.03 | 0.01 | 0.00 | 0.00 |
| 6.0 | 0.00 | 0.00 | 0.00 | 0.00 | 0.00 |
| 7.4 | 0.00 | 0.00 | 0.00 | 0.00 | 0.00 |
| 8.0 | 0.00 | 0.00 | 0.00 | 0.00 | 0.00 |
| 9.0 | 0.00 | 0.00 | 0.00 | 0.00 | 0.00 |
| 10.0 | 0.00 | 0.00 | 0.00 | 0.00 | 0.00 |
1.4.4. Variable temperature
Table 6.
Temperature dependence of the action of Sinapis alba myrosinase on the rate constant for glucosinolate hydrolysis ([Gluc]0 = 250 μM, 37 °C).
|
Δ[5] Δt−1[Myr]−1(min−1) |
Δ[6] Δt−1[Myr]−1(min−1) |
||||||
|---|---|---|---|---|---|---|---|
| Temperature | 220 nm | 227 nm | 235 nm | 241 nm | 227 nm | 235 nm | 241 nm |
| 5 | 0.01 | 0.01 | 0.01 | 0.01 | 0.20 | 0.19 | 0.21 |
| 15 | 0.03 | 0.02 | 0.03 | 0.02 | 0.39 | 0.40 | 0.39 |
| 25 | 0.08 | 0.08 | 0.06 | 0.06 | 0.79 | 0.79 | 0.79 |
| 35 | 0.17 | 0.17 | 0.17 | 0.17 | 1.59 | 1.58 | 1.61 |
| 45 | 0.30 | 0.31 | 0.29 | 0.29 | 2.11 | 2.06 | 2.07 |
| 50 | 2.80 | 2.79 | 2.82 | ||||
| 55 | 0.61 | 0.60 | 0.60 | 0.58 | 2.92 | 2.87 | 2.98 |
| 60 | 0.74 | 0.73 | 0.70 | 0.71 | 3.39 | 3.31 | 3.39 |
| 65 | 0.89 | 0.82 | 0.87 | 0.85 | 2.28 | 2.24 | 2.24 |
| 70 | 0.29 | 0.25 | 0.27 | 0.28 | |||
| 75 | 0.07 | 0.07 | 0.08 | 0.07 | 0.55 | 0.54 | 0.57 |
| 85 | 0.02 | 0.04 | 0.04 | ||||
Table 7.
Temperature dependence of the action of Sinapis alba myrosinase on the rate constant for observed ITC formation ([Gluc]0 = 250 μM, 37 °C).
| Temperature |
Δ[8]obsΔt−1[Myr]−1(min−1) |
Δ[9]obsΔt−1[Myr]−1(min−1) |
|||||
|---|---|---|---|---|---|---|---|
| 220 nm | 227 nm | 235 nm | 241 nm | 227 nm | 235 nm | 241 nm | |
| 5 | 0.02 | 0.01 | 0.20 | 0.20 | 0.20 | ||
| 15 | 0.02 | 0.02 | 0.02 | 0.02 | 0.35 | 0.36 | 0.37 |
| 25 | 0.05 | 0.06 | 0.06 | 0.06 | 0.69 | 0.70 | 0.70 |
| 35 | 0.16 | 0.16 | 0.16 | 0.16 | 1.22 | 1.30 | 1.28 |
| 45 | 0.28 | 0.28 | 0.28 | 0.29 | 1.55 | 1.58 | 1.58 |
| 50 | 1.61 | 1.84 | 1.89 | ||||
| 55 | 0.59 | 0.60 | 0.59 | 0.59 | 2.04 | 2.08 | 2.10 |
| 60 | 0.74 | 0.74 | 0.75 | 0.74 | 2.73 | 2.78 | 2.75 |
| 65 | 0.84 | 0.84 | 0.79 | 0.79 | |||
2. Experimental design,materials and methods
2.1. General synthetic information
Synthetic reactions were performed using commercial reagents and materials under inert conditions, unless otherwise specified.
2.2. 2Synthesis of 2,2-diphenylethyl isothiocyanate
2,2-Diphenylethyl ITC (8) was prepared from reaction of its corresponding primary amine (12, Scheme 1) with di-2-pyridylthionocarbonate (D2PT) in moderate yield [2,4,5].
Scheme 1.
Preparation of 2,2-diphenylethyl ITC.
2.3. Synthesis of 2,2-diphenylethyl glucosinolate
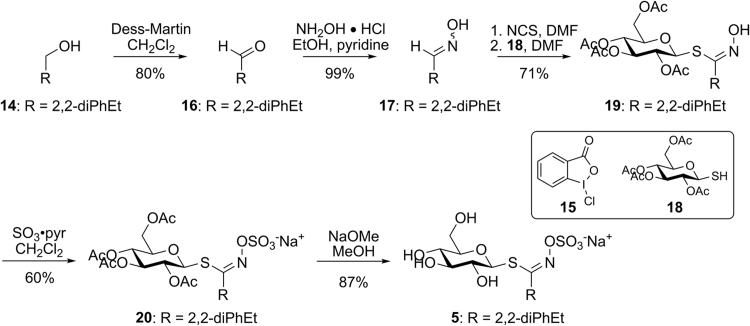
Glucosinolate 5 was prepared from its corresponding alcohol (14) using the aldoxime method previously employed by our group (Scheme 2) [2,4,6]. Reagent 15 was prepared in high yield for minimal cost [7] and its use in the conversion of 14 to 16 was both high yielding and easy to purify. Condensation of aldehyde 16 with hydroxylamine afforded oxime 17 in high yield [6,8]. Treatment of 17 with N-chlorosuccinimide formed an intermediate oximyl chloride, which was immediately coupled to 2,3,4,6-tetra-O-acetyl-1-thio-β-D-glucose (18) to provide scaffold 19. Sulfonation of 19 was accomplished with sulfur trioxide pyridine complex to afford intermediate 20, which was deprotected via Zempelen O-deacetylation to provide glucosinolate 5 in high yield.
Scheme 2.
Preparation of 2,2-diphenylethyl glucosinolate.
2.4. Synthetic experimentals
2.4.1. Preparation of (2-isothiocyanatoethane-1,1-diyl)dibenzene (8)
To a solution of 2,2-diphenylethylamine (200 mg, 1.01 mmol) in dry CH2Cl2 (20.0 ml) at ambient temperature was added di(2-pyridyl)thionocarbonate (462 mg, 1.99 mmol). The reaction was stirred for 24 h and the solvent was concentrated. Flash chromatography (SiO2, 20:1 hexanes:EtOAc) afforded 8 as a colorless solid (168 mg, 69%): m.p. 36.2–36.5 °C; 1H NMR (CDCl3, 400 MHz) δ 7.38–7.32 (m, 4H), 7.31–7.21 (m, 5H), 4.38 (t, J = 7.7 Hz, 1H), 4.10 (d, J = 7.3 Hz, 2H); 13C NMR (CDCl3, 100 MHz) δ 140.4 (2C), 132.0, 129.1 (4C), 128.1 (4C), 127.6 (2C), 51.6, 49.6; IR (KBr) νmax 3058, 3026, 2920, 2900, 2850, 2770, 2705, 2361, 2338, 2188, 2110, 1771, 1733, 1716, 1700, 1683, 1670, 1652, 1635, 1616, 1598, 1558, 1540, 1521, 1506, 1492, 1451, 1384, 1361, 1346, 1322, 1186, 1155, 1089, 1024, 968, 921 cm−1; HRMS (ESI+) m/z: [M + H]+ calcd for C15H14NS, 240.0847; found, 240.0842.
2.4.2. Preparation of 3,3-diphenylpropanal (16)
To a solution of 14 (2.00 g, 9.42 mmol), TEMPO (0.12 g, 0.75 mmol), pyridine (2.26 ml, 28.26 mmol) in EtOAc (46 ml) was added 15 (3.99 g, 14.14 mmol) and was stirred at rt for 18 h. The oxidant was quenched with addition of saturated aqueous Na2S2O3 (10 ml) and was extracted with EtOAc (3×30 ml). The combined organic layers were washed with hydrochloric acid (1 M, 15 ml), water (15 ml), dried (Na2SO4), and concentrated. Flash chromatography (SiO2, 3:1 hexanes:CH2Cl2) afforded 16 as a colorless solid (1.65 g, 84%): m.p. 32.0–32.5 °C; 1H NMR (CDCl3, 400 MHz) δ 9.75 (t, J = 1.8 Hz, 1H), 7.34-7.28 (m, 4H), 7.27–7.19 (m, 5H), 4.64 (t, J = 7.8 Hz, 1H), 3.19 (dd, J = 7.8, 1.8 Hz, 2H); 13C NMR (CDCl3, 100 MHz) δ 201.3, 143.4 (2C), 128.9 (2C), 127.9 (2C), 126.9 (2C), 49.6, 45.2; IR (KBr) νmax 3083, 3062, 3027, 2880, 2861, 2839, 2737, 1920, 1900, 1870, 1716, 1599, 1583, 1494, 1451, 1405, 1388, 1180, 1089, 1055, 1032, 926, 748 cm−1; HRMS (ESI+) m/z: [M]+ calcd for C15H14O, 210.1045; found, 210.1022.
2.4.3. Preparation of 3,3-diphenylpropanal oxime (17)
Hydroxylamine hydrochloride (466 mg, 6.71 mmol) was added to 16 (659 mg, 3.13 mmol), EtOH (95%, 13.0 ml), and pyridine (1.30 ml, 16.10 mmol). The solution was heated to reflux for 3 h, then the solvents were concentrated. The residue was dissolved in water:EtOAc (1:1, 150 ml) and the aqueous layer was extracted with EtOAc (3×50 ml). The combined organic layers were washed with saturated aqueous sodium chloride (150 ml), dried (Na2SO4), and concentrated to afford 17 as a colorless solid in a 1:1 ratio of E:Z isomers (710 mg, 100%): m.p. 81.2–83.0 °C; 1H NMR (CDCl3, 400 MHz) δ 7.37-7.18 (m, 22H), 6.99 (s, 1H), 6.67 (t, J = 5.5 Hz, 1H), 4.24 (t, J = 8.2 Hz, 1H), 4.19 (t, J = 7.8 Hz, 1H), 3.14 (dd, J = 8.2, 5.0 Hz, 2H), 2.97 (dd, J = 7.8, 6.0 Hz, 2H); 13C NMR (CDCl3, 100 MHz) δ 151.5, 151.2, 143.8, 143.6, 128.9, 128.0, 126.8, 49.1, 48.2, 35.5, 31.0; IR (KBr) νmax 3252, 3084, 3060, 3053, 3042, 3026, 2942, 2923, 2892, 2873, 2853, 1662, 1597, 1493, 1445, 1344, 1233, 1172, 1091, 1064, 1022, 918, 837, 719, 693, 631, 580, 537, 459 cm−1; HRMS (ESI+) m/z: [M + H]+ calcd for C15H16NO, 226.1232; found, 226.1247.
2.4.4. Preparation of (2R,3R,4S,5R,6S)-2-(acetoxymethyl)-6-((Z)-1-(hydroxyimino)-3,3-diphenylpropylthio)tetrahydro-2H-pyran-3,4,5-triyl triacetate (19)
Compound 17 (650 mg, 2.89 mmol) was dissolved in dry DMF (19.0 ml) and NCS (384 mg, 2.88 mmol) was added slowly over 10 min. The solution was heated to 75 °C for 2 h. 2,3,4,6-Tetra-O-acetyl-1-thio-β-D-glucose (1.098 g, 3.01 mmol), and N,N-diisopropylethylamine (4.50 ml, 23.94 mmol) were added, and the reaction was stirred for 18 h. The reaction was diluted with EtOAc (75 ml) and washed with H2SO4 (1M, 150 ml). The aqueous phase was extracted with EtOAc (3×50 ml). The combined organic layers were washed with H2SO4 (1M, 100 ml), water (6×75 ml), dried (MgSO4), and concentrated. Flash chromatography (SiO2, 6:3:1 hexanes:CH2Cl2:MeOH) afforded 19 as a colorless solid (1.21 g, 71%): m.p. 82.1–85.1 °C; 1H NMR (CDCl3, 400 MHz) δ 8.08 (s, 1H), 7.34–7.17 (m, 10H), 5.20 (t, J = 9.2 Hz, 1H), 5.08 (d, J = 10.1 Hz, 1H), 5.03 (d, J = 8.7 Hz, 1H), 4.94 (d, J = 10.1 Hz, 1H), 4.56 (t, J = 7.8 Hz, 1H), 4.16 (dd, J = 12.8, 6.0 Hz, 1H), 4.07 (dd, J = 12.4, 2.3 Hz, 1H), 3.65 (ddd, J = 10.1, 6.0, 2.3 Hz, 1H), 3.34 (dd, J = 15.6, 7.8 Hz, 1H), 3.19 (dd, J =15.1, 7.3 Hz, 1H), 2.07 (s, 3H), 2.03 (s, 3H), 2.02 (s, 3H), 1.95 (s, 3H); 13C NMR (CDCl3, 100 MHz) δ ; I170.9, 170.4, 169.6, 169.4, 150.1, 144.0, 143.3, 128.9 (2C), 128.8 (2C), 128.0 (2C), 127.9 (2C), 126.9, 126.8, 80.3, 76.2, 73.8, 70.2, 68.1, 62.4, 48.4, 38.9, 20.9, 20.8, 20.8 (2C); IR (KBr) νmax 3420, 3163, 3028, 2360, 2341, 1751, 1452, 1399, 1384, 1225, 1039, 702, 668 cm−1; HRMS (ESI+) m/z: [M + Na]+ calcd for C29H33NO10SNa, 610.1723; found, 610.1727.
2.4.5. Preparation of sodium (Z)-3,3-diphenyl-1-((2S,3R,4S,5R,6R)-3,4,5-triacetoxy-6-(acetoxymethyl)tetrahydro-2H-pyran-2-ylthio)propylideneamino sulfate (20)
To a solution of sulfur trioxide/pyridine complex (4.85 g, 30.50 mmol) in dry CH2Cl2 (200 ml) was added 19 (3.58 g, 6.10 mmol) in CH2Cl2 (200 ml). After 48 h, saturated aqueous sodium bicarbonate (90 ml) was slowly added, and the solvents were concentrated. Flash chromatography (SiO2, 6:3:1 pet ether:CH2Cl2:MeOH), afforded 20 as a pale yellow solid (2.24 g, 60%): m.p. 139.0 °C (decomposed); 1H NMR (CD3OD, 400 MHz) δ 7.38 (m, 4H), 7.30 (m, 4H), 7.20 (m, 2H), 5.27 (t, J = 9.6 Hz, 1H), 5.10 (d, J = 10.1 Hz, 1H), 5.02 (t, J = 9.6 Hz, 1H), 4.94 (t, J = 9.6 Hz, 1H), 4.73 (t, J = 8.2 Hz, 1H), 4.19 (dd, J = 12.4, 6.0 Hz, 1H), 4.12 (dd, J = 12.8, 2.3 Hz, 1H), 3.94 (ddd, J = 10.1, 6.0, 2.3 Hz, 1H), 3.46 (dd, J = 15.6, 6.4 Hz, 1H), 3.39 (dd, J = 15.6, 8.2 Hz, 1H), 2.04 (s, 3H), 2.03 (s, 3H), 1.99 (s, 3H), 1.90 (s, 3H); 13C NMR (CD3OD, 100 MHz) δ 172.3, 171.4, 171.2, 170.9, 157.2, 145.4, 145.1, 129.6, (2C), 129.5 (4C), 129.1 (2C), 127.7, 127.5, 80.9, 76.9, 74.9, 71.1, 69.6, 63.7, 49.5, 39.7, 20.6 (2C), 20.5, 20.5; IR (film) νmax 3502, 3063, 3029, 2941, 1756, 1601, 1584, 1497, 1453, 1435, 1383, 1230, 1062, 1041, 911, 898, 798 cm−1.
2.4.6. Preparation of sodium (Z)-3,3-diphenyl-1-((2S,3R,4S,5S,6R)-3,4,5-trihydroxy-6-(hydroxymethyl)tetrahydro-2H-pyran-2-ylthio)propylideneamino sulfate (5)
To a solution of 20 (1.91 g, 2.77 mmol) in dry MeOH (38 ml) was added NaOMe in MeOH (1 M, 1.91 ml). The solution was stirred at rt for 2 h, then acetic acid (207 μL) was added. The solvents were concentrated and the residue purified by flash chromatography (SiO2, 4:1 EtOAc:MeOH) to afford 5 as a colorless solid (1.25 g, 87%): m.p. 180 °C (decomposed); 1H NMR (CD3OD, 400 MHz) δ 7.32 (m, 4H), 7.23 (td, J = 7.3, 3.2 Hz, 4H), 7.12 (m, 2H), 4.71–4.65 (m, 2H), 3.81 (dd, J = 11.0, 1.8 Hz, 1H), 3.62 (dd, J = 12.4, 6.0 Hz, 1H), 3.49 (dd, J = 15.1, 7.6 Hz, 1H), 3.39 (dd, J = 15.6, 7.3 Hz, 1H), 7.34–7.18 (m, 4H); 13C NMR (CD3OD, 100 MHz) δ 159.9, 145.6, 144.9, 129.5 (2C), 129.3 (2C), 129.1 (4C), 127.4 (2C), 127.2 (2C), 83.7, 82.1, 79.3, 74.0, 70.9, 62.4, 49.3, 39.8; IR (KBr) νmax 3416, 2923, 2543, 1717, 1600, 1496, 1453, 1384, 1241, 1061, 956, 889, 804 cm−1.
2.5. Standardization
The specific activity of commercial Sinapis alba myrosinase was determined using the prescribed method [9]. Each analyte was individually standardized using the previously-described HPLC method [2], with minor modifications appropriate to the current related study [1]. Standard curves representing peak area vs. injection amount were generated for each wavelength of interest.
2.6. Generation of reaction progress curves and reaction velocities
Enzymatic hydrolysis reactions of glucosinolates were conducted in aqueous buffer using a modified form of the established protocol [1,2]. The concentration of glucosinolate, concentration of Sinapis alba myrosinase, buffer pH, and incubation temperature were varied for a given experiment, which were conducted in triplicate. Analytes at a given reaction timepoint were separated by HPLC and concentrations were determined from integration of analyte peak areas. Reaction progress curves were fit to the data using a modified form of the Lambert W(x) and were used to calculate initial rates of hydrolysis/formation for each observed analyte [1].
Acknowledgements
We would like to extend our thanks to Brandon Gustafson, the faculty and staff in the Department of Chemistry at Augustana University, and the Mass Spectrometry & Analytical Proteomics Laboratory at the University of Kansas. This research was supported by an Institutional Development Award (IDeA) from the National Institute of General Medical Sciences of the National Institutes of Health under grant number P20GM103443. The content is solely the responsibility of the authors and does not necessarily represent the official views of the National Institutes of Health. This research was also supported by a Research Infrastructure Improvement (RII) Track-1 award to South Dakota Experimental Program to Stimulate Competitive Research (SD EPSCoR) from the National Science Foundation and the state of South Dakota, under grant number IIA-1355423. Funding was also provided by the Augustana Research and Artist Fund (ARAF), and Augustana University.
Footnotes
Transparency data associated with this article can be found in the online version at doi:10.1016/j.dib.2016.11.086.
Supplementary data associated with this article can be found in the online version at doi:10.1016/j.dib.2016.11.086.
Transparency document. Supplementary material
Supplementary material
Appendix A. Supplementary material
Supplementary material
References
- 1.Klingaman C.K., Wagner M.J., Brown J.R., Klecker J.B., Pauley E.H., Noldner C.J., Mays J.R. HPLC-based kinetics assay facilitates analysis of systems with multiple reaction products and thermal enzyme denaturation. Anal. Biochem. 2017;516:37–47. doi: 10.1016/j.ab.2016.10.010. [DOI] [PMC free article] [PubMed] [Google Scholar]
- 2.Vastenhout K.J., Tornberg R.H., Johnson A.L., Amolins M.W., Mays J.R. High performance liquid chromatography-based method to evaluate kinetics of glucosinolate hydrolysis by Sinapis alba myrosinase. Anal. Biochem. 2014;465:105–113. doi: 10.1016/j.ab.2014.07.017. [DOI] [PMC free article] [PubMed] [Google Scholar]
- 3.Pontoppidan B., Ekbom B., Eriksson S., Meijer J. Purification and characterization of myrosinase from the cabbage aphid (Brevicoryne brassicae), a brassica herbivore. Eur. J. Biochem. 2001;268:1041–1048. doi: 10.1046/j.1432-1327.2001.01971.x. [DOI] [PubMed] [Google Scholar]
- 4.Mays J.R., Weller-Roska R.L., Sarfaraz S., Mukhtar H., Rajski S.R. Identification, synthesis and enzymology of non-natural glucosinolate chemopreventive candidates. ChemBioChem. 2008;9:729–747. doi: 10.1002/cbic.200700586. [DOI] [PubMed] [Google Scholar]
- 5.Park S., Hayes B.L., Marankan F., Mulhearn D.C., Wanna L., Mesecar A.D., Santarserio B.D., Johnson M.E., Venton D.L. Regioselective covalent modification of hemoglobin in search of antisickling agents. J. Med. Chem. 2003;46:936–953. doi: 10.1021/jm020361k. [DOI] [PubMed] [Google Scholar]
- 6.Davidson N.E., Rutherford T.J., Botting N.P. Synthesis, analysis and rearrangement of novel unnatural glucosinolates. Carbohydr. Res. 2001;330:295–307. doi: 10.1016/s0008-6215(00)00308-6. [DOI] [PubMed] [Google Scholar]
- 7.Li X.-Q., Zhang C. An environmentally benign TEMPO-catalyzed efficient alcohol oxidation system with a recyclable hypervalent iodine(III) reagent and its facile preparation. Synthesis. 2009;7:1163–1169. [Google Scholar]
- 8.Corey E.J., Suggs J.W. Pyridinium chlorochromate: an efficient reagent for oxidation of primary and secondary alcohols to carbonyl compounds. Tetrahedron Lett. 2014;16:2647–2650. [Google Scholar]
- 9.Palmieri S., Leoni O., Iori R. A steady-state kinetics study of myrosinase with direct ultraviolet spectrophotometric assay. Anal. Biochem. 1982;123:320–324. doi: 10.1016/0003-2697(82)90452-3. [DOI] [PubMed] [Google Scholar]
Associated Data
This section collects any data citations, data availability statements, or supplementary materials included in this article.
Supplementary Materials
Supplementary material
Supplementary material


