Abstract
Heat shock response and programmed cell death are cellular reactions to stressful stimuli. Previous studies have not correlated these responses in vivo at the spatial level in mammalian tissues. This study uses a dual procedure involving immunocytochemistry for Hsp70 localization and the terminal deoxynucleotidyl transferase-mediated deoxyuridine triphosphate nick-end–labeling (TUNEL) assay for cell death to correlate the pattern of stress-inducible Hsp70 and cell death at the cellular level. After whole-body hyperthermia in the rat, an increase in Hsp70-positive cells and TUNEL-positive cells was noted in brain, thymus, and bone marrow. However, 2 populations of cells were apparent in the tissues examined, those inducing Hsp70 and those triggered into programmed cell death. Cells that were both Hsp70 positive and TUNEL positive were rarely detected. In tissues of the intact mammal, cells that induce Hsp70 after whole-body hyperthermia were not triggered into programmed cell death.
INTRODUCTION
Cells respond to a range of stressful stimuli by activating the heat shock (stress) response, in which a set of genes encoding heat shock proteins (hsps) is transiently induced (Lindquist and Craig 1988; Pardue et al 1992). These induced proteins play important roles in cellular repair mechanisms and protect against subsequent stress (Georgopoulos and Welch 1993; Parsell and Lindquist 1993; Morimoto et al 1994; Li et al 1995; De Maio 1999). Stressful stimuli can also trigger programmed cell death, a genetically controlled suicide mechanism involving caspase activation that leads to efficient cell elimination without an inflammatory response (Dorstyn et al 1998; Samali and Orrenius 1998; Earnshaw et al 1999; Wolf and Green 1999). A characteristic change associated with programmed cell death is the cleavage of deoxyribonucleic acid (DNA) that can be detected at the cellular level by the terminal deoxynucleotidyl transferase–mediated deoxyuridine triphosphate (dUTP) nick-end–labeling (TUNEL) method (Gavrieli et al 1992).
Elevation of body temperature in the intact mammal activates the cellular stress response. For example, populations of neural cells induce the heat shock proteins Hsp70, 32, and 27; however, levels of constitutively expressed hsc proteins do not change (Brown 1994; Brown and Sharp 1999; Bechtold and Brown 2000; Bechtold et al 2000). The inducible hsps associate with synaptic elements, where they may facilitate repair of stress-induced damage and contribute to neuroprotective mechanisms (Bechtold and Brown 2000; Bechtold et al 2000). Prior heat shock has been shown to confer functional protection to synapses at the level of neurotransmission, and selective overexpression of Hsp70 enhances the magnitude of the synaptic protection (Karunanithi et al 1999, 2002; Kelty et al 2002).
As reviewed above, stressful stimuli induce 2 cellular reactions, ie, heat shock response and programmed cell death. Previous studies have not correlated these cellular responses in vivo at the spatial level in mammalian tissues. Our present objective is to correlate the pattern of Hsp70 induction with the pattern of programmed cell death in tissues of the hyperthermic rat using immunocytochemistry and TUNEL method, respectively. Hyperthermia is a physiologically relevant phenomenon. Clinical studies have shown deleterious effects of fever in young children and teratogenic effects of hyperthermia during early development (Graham et al 1998). Temperature elevations at critical developmental stages can result in structural malformations associated with programmed cell death (Walsh et al 1991; Edwards et al 1995; Mirkes et al 1997, 2001; Mirkes and Little 1998, 2000; Breen et al 1999; Little and Mirkes 2002; Soleman et al 2003).
MATERIALS AND METHODS
Induction of hyperthermia
The body temperature of 45-day-old male Wistar rats was elevated by placement of animals in a dry-air incubator at 43°C. Once animals reached the target temperature of +4.5 ± 0.4°C, they were maintained at this temperature for 1 hour. Rats were then removed from the incubator, given water, and returned to their cages, where they recovered at room temperature. Animals were killed after 2.5, 5, 10, 15, and 24 hours.
Postnatal day 7 (P7) rats were taken away from their mothers and placed in a dry-air incubator at 42°C, where their body temperatures were elevated to 41.0 ± 0.6°C. A needle thermistor probe was placed under the forelimb every 10 minutes to monitor body temperature. The target temperature was maintained for 1 hour. Pups were then removed from the incubator, cooled to normal temperature, and returned to their mothers. Animals were anesthetized and perfused at 10 hours after the hyperthermic episode.
Western blotting
Control and heat-shocked adult male rats were decapitated, and cerebellum and thymus tissues were extracted and homogenized in 0.32 M sucrose. Bone marrow was extracted from the femur, and recovered cells were homogenized in 0.32 M sucrose. Total protein concentrations of the tissue homogenates were determined using the BioRad (Hercules, CA, USA) protein assay. Sample aliquots of the homogenates were stored at −20°C. Aliquots of control and heat-shocked tissues (25 μg protein) were boiled for 5 minutes in an equal volume of solubilization buffer (8 M urea, 2% sodium dodecyl sulfate [SDS], 2% 2-mercaptoethanol, and 20% glycerol) and electrophoresed on 10% SDS–polyacrylamide gels. Electrophoretic transfer of proteins onto a nitrocellulose membrane was carried out for 16–18 hours in borate buffer (50 mM boric acid, 4 mM 2-mercaptoethanol, 2 mM ethylenediamine–tetraacetic acid, pH 8.9) at 400 mA. Nitrocellulose membranes were rinsed in TBST buffer (10 mM Tris, 0.25 M NaCl, 0.5% Tween-20, pH 7.5) and stained with Ponceau S to test for equal loading and efficient transfer. Ponceau S stain was removed from membranes by washing with TBST buffer.
After blocking with 5% carnation milk powder in TBST for 2 hours, blots were incubated overnight with a mouse monoclonal anti-human Hsp70 antibody that specifically recognizes stress-inducible Hsp70 (Stressgen, Victoria, BC, Canada, SPA810) using an antibody dilution of 1:5000 in TBST containing 1% purified bovine serum albumin (BSA) and 0.02% sodium azide. Membranes were then rinsed 4 times for 10 minutes each in TBST buffer with 1% BSA (Biotech Grade, BioShop Inc, Burlington, ON, Canada) and incubated for 2 hours with anti-mouse immunoglobulin G (IgG) conjugated to horseradish peroxidase diluted at 1:5000 in TBST with 1% BSA. For detection of immunoreactive bands, blots were processed with enhanced chemiluminescence Western blotting detection reagents (Amersham, Piscataway, NJ, USA, RPN 2106). The data presented are representative of results obtained from experiments using 3 different animals per time point.
Tissue preparation for TUNEL and immunocytochemistry
Control and heat-shocked adult and P7 rats were anesthetized with sodium pentobarbital (50 mg/kg) and perfused intracardially with 4% paraformaldehyde in 0.1 M phosphate-buffered saline (PBS), pH 7.4. P7 and adult brain and thymus tissues were isolated and fixed overnight in 4% paraformaldehyde at 4°C. Tissues were then equilibrated through a series of sucrose gradients (5%, 10%, and 20% sucrose in PBS) and embedded in OCT compound (Somagen Diagnostics Inc, Edmonton, Alberta, Canada). Embedded tissues were kept frozen at −70°C until sectioning. Cryostat sections of 20 μm (for standard TUNEL staining) and 10 μm (for fluorescent TUNEL-immunocytochemistry) were collected on gelatin-coated microscope slides (1% gelatin and 0.05% chromium potassium sulfate) and air dried for 2 hours. Brain and thymus tissue sections were floated on water before placement on slides. For bone marrow, control and heat-shocked adult male rats were decapitated and cells were washed out of the femur bone with 4% paraformaldehyde and fixed for 3 hours at 4°C. Bone marrow cells were then spun down for 2 minutes at low speed and resuspended in an equal volume of PBS. Cells were spread on gelatin-coated slides and air dried for 2 hours before processing with TUNEL or immunocytochemistry.
TUNEL assay for DNA fragmentation
The TUNEL method was used on 20-μm cryostat sections to detect nuclear DNA fragmentation at the cellular level (Gavrieli et al 1992). The In Situ Cell Death Detection Kit, POD (Roche Diagnostics, Laval, Quebec, Canada), was used as specified by the manufacturer. The contents of the kit were diluted to half strength. After a standard 5-minute fixation in 4% paraformaldehyde and a 30-minute quenching of endogenous peroxidase activity with 0.3% H2O2 in methanol at room temperature, slides were rinsed in PBS buffer for 5 minutes and treated with cell permeabilization solution (0.1% sodium citrate with 0.1% Triton X-100) for 6 minutes on ice. Slides were then rinsed twice (for 5 minutes each) and incubated for 1 hour in a humidified chamber at 37°C with the TUNEL reaction mixture containing terminal deoxynucleotidyl transferase (TdT) and fluorescein-conjugated dUTP. For detection of fluorescein-labeled DNA fragments, slides were incubated with a sheep antifluorescein antibody conjugated to horseradish peroxidase for 30 minutes at 37°C. The TUNEL signal was observed using the DAB substrate kit (Vector Labs, Burlingame, CA, USA). TUNEL-positive cells were viewed using a light microscope, and images were captured with Northern Eclipse Software (Empix Inc, Mississauga, Ontario, Canada). The data presented are representative of results obtained from experiments with 3 different animals for control and heat shock groups of each tissue.
Dual TUNEL and Hsp70 immunocytochemistry
Ten-micrometer cryostat tissue sections were rehydrated for 20 minutes in PBS-G buffer (0.1 M PBS, pH 7.4, 0.2% Triton X-100, 0.1% BSA) and subsequently blocked for 2 hours with 10% goat serum. Sections were then incubated overnight in mouse monoclonal anti-Hsp70 antibody (StressGen, SPA810) diluted at 1:400 in PBS-G buffer containing 0.02% sodium azide. After 2 washes (5 minutes each) in PBS-G, slides were incubated in the dark with 1:400 Cy2-conjugated goat anti-mouse IgG (Jackson Immunoresearch, Mississauga, Ontario, Canada). Slides were rinsed 3 times in PBS-G buffer for 25 minutes each.
Tissue sections were then processed for the TUNEL method modified for fluorescent microscopy. Slides were rinsed twice in PBS and incubated in cell permeabilization solution (0.1% Triton X-100 in 0.1% sodium citrate) on ice for 6 minutes. After two 5-minute washes in PBS, slides were incubated with TUNEL reaction mixture containing TdT and digoxigenin (DIG)-11-dUTP (Roche Diagnostics) for 1 hour in a humidified chamber at 37°C. DIG-labeled DNA strand breaks were detected by incubation for 30 minutes with a mouse monoclonal anti-DIG IgG conjugated to Cy5 (Jackson Immunoresearch) diluted at 1:200 at 37°C. Slides were then washed 3 times for 25 minutes each in PBS buffer containing 1% BSA and mounted in 60% glycerol. Tissue sections were then examined using an LSM 510 laser scanning microscope (Carl Zeiss, Jena, Germany) equipped with an Argon laser producing monochromatic light at 488 nm, which is applied to excite the Cy2 fluorophore, and a second laser producing a monochromatic light at 633 nm (Helium-Neon laser) for Cy5.
Quantitative analysis
TUNEL-positive cells were quantified using 3 sets of animals for control and heat-shocked treatments of all tissues examined. For each set of animals, the experiment was repeated 3 times. The numbers of TUNEL-positive cells were counted in 10 randomly selected areas of 12 000 μm2 per slide for the brain regions and 6000 μm2 for the thymus. For quantification of TUNEL-positive cells in the bone marrow, 10 random areas of 100 000 μm2 were selected on the cell-spread slides. The data plotted are representative of the mean number of TUNEL-positive cells per designated area. A t-test was performed, and data were considered significant for P < 0.05. For confocal data, the number of TUNEL-positive cells (red), Hsp70-positive cells (green), and cells showing colocalization of both signals (yellow) were determined for the designated areas of each tissue.
RESULTS
Induction of Hsp70 after whole-body hyperthermia
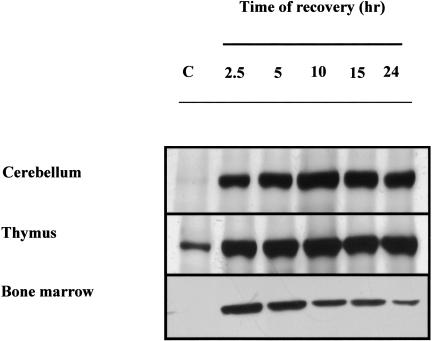
As shown by Western blotting in Figure 1, hyperthermia caused an induction of Hsp70 in the cerebellum of the adult rat and also in the thymus and bone marrow. In control animals, Hsp70 was barely detectable in the cerebellum and not apparent in bone marrow; however, basal levels were comparatively high in the thymus.
Fig 1.
Time course of Hsp70 induction. The induction of Hsp70 was analyzed in control animals (C) and at 2.5, 5, 10, 15, and 24 hours after hyperthermia. Western blot analysis revealed a robust induction of Hsp70 in the adult cerebellum, thymus, and bone marrow
Induction of cell death in the brain
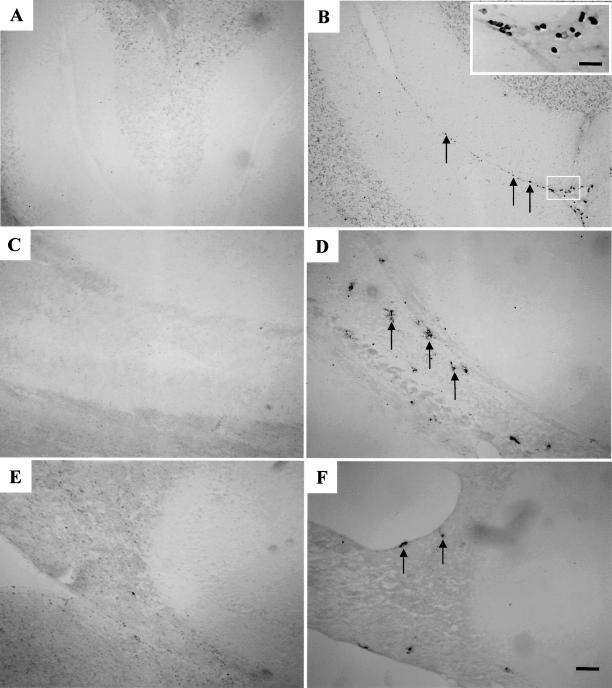
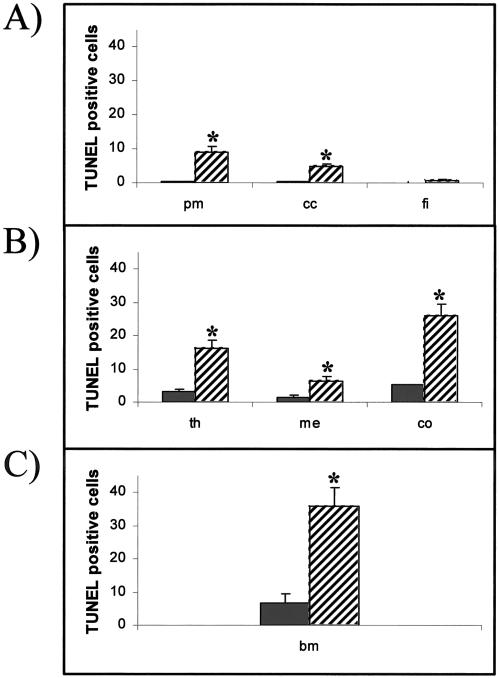
The TUNEL method was used to localize sites of DNA fragmentation, a characteristic feature of programmed cell death (Gavrieli et al 1992). Most cells in the adult rat brain were not triggered into cell death by the hyperthermic treatment. As shown in Figure 2, TUNEL-positive cells were detected in a few scattered cells in the pia mater of the cerebellum, the corpus callosum, and the fimbria (panels A and B, C and D, and E and F, respectively). Quantitative analysis of the number of TUNEL-positive cells in control vs heat shock regions of the adult brain demonstrated that the induction of cell death after heat shock was statistically significant in the pia mater and the corpus callosum but not in the fimbria (Fig 3A).
Fig 2.
Effect of hyperthermia on cell death in regions of the adult brain. Tissue sections were processed with the TUNEL method and viewed under light microscopy. The left panels present control brain regions, and the right panels show brain regions at 10 hours after hyperthermia. A few scattered cells (indicated by arrows) in the pia mater of the cerebellum (panel B), the corpus callosum (panel D), and the fimbria (panel F) were TUNEL positive. The insert in panel B represents a higher magnification of the boxed area showing TUNEL-positive cells in the pia mater. Bar = 100 μm in panel A–F. Bar = 25 μm in panel B insert
Fig 3.
Quantitative analysis of hyperthermia-induced cell death in tissues of the adult rat. The average number of TUNEL-positive cells is shown for each tissue in control (solid bars) and hyperthermic animals (hatched bars). (A) Brain regions—pia mater (pm), corpus callosum (cc), and fimbria (fi). (B) Thymus regions—medulla (me), cortex (co), and total thymus (th). (C) Bone marrow (bm). Error bars indicate standard error of the mean. Statistical analysis was performed using the t-test, and data were considered significant (*) when P < 0.05
Cellular localization of Hsp70 and cell death in the brain
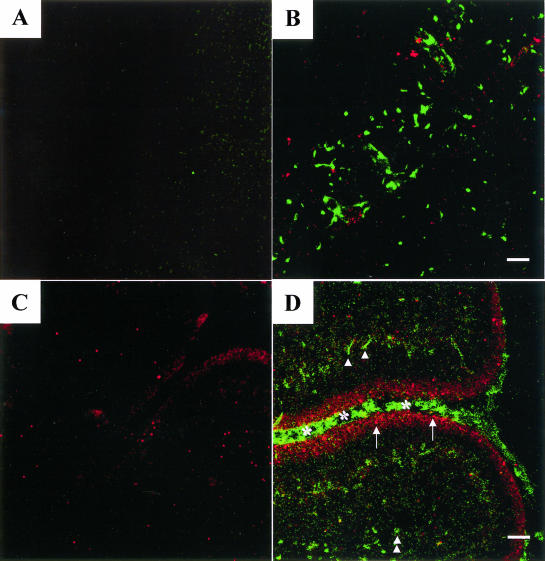
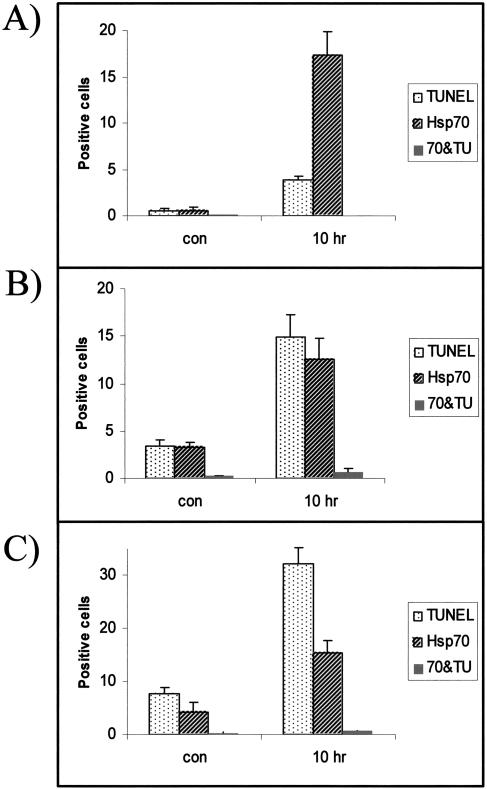
Dual immunocytochemistry and TUNEL reactivity were undertaken to examine the spatial correlation of stress-induced Hsp70 and neural cells triggered into cell death after the hyperthermic treatment. The distribution of Hsp70-positive cells (green) and TUNEL-positive cells (red) is shown in Figure 4 (panel A, control, and panel B, hyperthermia). In this analysis, cells that appear yellow would indicate the colocalization of these 2 signals. A major increase in Hsp70-positive cells (green) and scattered TUNEL-positive (red) apoptotic cells was observed after hyperthermia. However, no neural cells in which the 2 signals colocalized were noted. The Hsp70-positive cells and the TUNEL-positive cells formed separate populations. A quantitative analysis of these results is presented in Figure 5A.
Fig 4.
Localization of Hsp70 and cell death in the brain after hyperthermia. Dual immunocytochemistry and TUNEL reactivity were used to examine the spatial correlation of Hsp70 induction and cell death. The Hsp70 signal was observed by confocal microscopy using green fluorescence (Cy2), whereas TUNEL-positive cells were identified by red fluorescence (Cy5). In this analysis, cells that appear yellow indicate colocalization of these 2 signals. Left panels show control animals, and right panels correspond to animals at 10 hours after hyperthermia. (A,B) Corpus callosum of the adult brain. (C,D) Cerebellar layers of the developing brain at postnatal day 7—arrows, external granule layer; single arrowheads, glial cells in the molecular layer; double arrowheads, glial cells in the deep white matter; asterisks, surface layer of the cerebellum. Bar = 50 μm in panels A and B. Bar = 62.5 μm in panels C and D
Fig 5.
Quantitative analysis of Hsp70-positive and TUNEL-positive cells. The average number of TUNEL-positive cells, Hsp70-positive cells, and cells showing cellular colocalization of both signals (70&TU) was determine for each tissue in control animals (con) and at 10 hours after hyperthermia (10 hours). (A) Corpus callosum. (B) Thymus. (C) Bone marrow. Error bars represent standard error of the mean
Hyperthermia-induced cell death and Hsp70 in the thymus
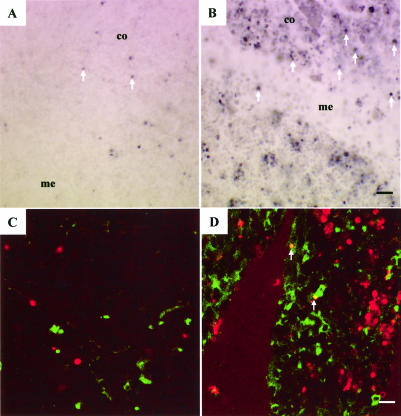
Hyperthermia resulted in a pronounced increase in TUNEL-positive cells in the thymus (Fig 6 A,B). Quantitative analysis revealed that cells in the cortex region of the thymus demonstrated a higher level of cell death than the medulla (Fig 3B). Dual immunocytochemistry and TUNEL (Fig 6C, control, and Fig 6D, hyperthermia) revealed that the thymus cells inducing Hsp70 (green) and those cells triggered into programmed cell death (red) fell into 2 populations. Only a few scattered thymus cells (indicated by arrows) demonstrated colocalization of both signals (yellow). A quantitative analysis is shown in Figure 5B.
Fig 6.
Cellular localization of cell death and Hsp70 induction in the thymus. (A,B) Increase in TUNEL-positive cells in the thymus after hyperthermia (indicated by arrows). Thymus regions—medulla (me) and cortex (co). (C,D) Observation of Hsp70-positive cells (green) and TUNEL-positive cells (red) in the thymus. Left panels show control animals, and right panels indicate animals at 10 hours after hyperthermia. Bar = 25 μm in panels A and B. Bar = 15.8 μm in panels C and D
Effect of hyperthermia on cell death and Hsp70 in bone marrow cells
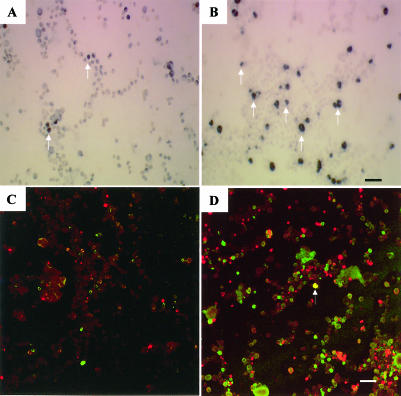
Bone marrow in control animals exhibited a substantial number of TUNEL-positive cells, as shown in Figure 7A. Hyperthermia greatly increased the number of TUNEL-positive cells, as demonstrated in Figure 7B and by statistical analysis in Figure 3C. The dual immunocytochemical and TUNEL technique showed separate populations of cells that were Hsp70 positive (green) or undergoing cell death (red) (Fig 7C, control, and Fig 7D, hyperthermia). In bone marrow only a few scattered cells (indicated by arrows) were positive for both signals (yellow). Figure 5C presents a quantitative analysis of these results.
Fig 7.
Cell death and Hsp70 induction in bone marrow. (A,B) Increase in TUNEL-positive cells in bone marrow after hyperthermia (indicated by arrows). (C,D) Observation of Hsp70-positive cells (green) and TUNEL-positive cells (red) in bone marrow. Left panels show control animals, and right panels indicate animals at 10 hours after hyperthermia. Bar = 25 μm in panels A and B. Bar = 62.5 μm in panels C and D
Cellular localization of Hsp70 and cell death in the developing brain
Dividing cells are present in the adult thymus and bone marrow; however, cells in the adult brain are postmitotic. We next investigated how dividing neural cells in the cerebellum at an earlier stage of development respond to hyperthermia (Fig 4 C,D). At P7, cells in the external granule layer (arrows) undergo active cell division. After hyperthermia, induction of both Hsp70 (green) and cell death (red) were observed in separate cell populations. Cell death was localized to the cells in the external granule layer (arrows) that were undergoing active cell division, whereas Hsp70 induction was observed in glial cells in both the molecular layer (single arrowheads) and the deep white matter (double arrowheads) and also in the surface cell layer (asterisk). No detectable cells were observed in the developing cerebellum, showing the colocalization of both Hsp70 and cell death signals (yellow).
DISCUSSION
Our laboratory and other groups have investigated the expression of heat shock genes in the mammalian brain under normal and hyperthermic conditions (for reviews, see Brown 1994; Brown and Sharp 1999; Bechtold and Brown 2000; Bechtold et al 2000). More recently, we have analyzed the effect of hyperthermia on the induction of programmed cell death in mammalian tissues (Khan and Brown 2002). These results suggested that actively dividing cell populations are more prone to cell death induced by hyperthermia than fully differentiated cells. Previous investigations have not correlated the in vivo pattern of induction of heat shock proteins to the pattern of programmed cell death at the spatial level. Hyperthermia is a classic inducer of the heat shock response. The major hsps induced after heat shock in mammalian tissues are the Hsp70 proteins that belong to a multigene family of highly conserved proteins, including both stress-inducible and constitutively expressed members (Kiang and Tsokos 1998).
Our studies at the whole-tissue level of Western blot analysis have shown that robust induction of Hsp70 in the cerebellum correlates with the high level of protection of neural cells from heat-induced cell death and that the delayed, less robust Hsp70 induction in testis correlated with its sensitivity to hyperthermia-induced cell death (Khan and Brown 2002). However, that study also demonstrated that cells in the thymus readily undergo cell death despite its robust induction of Hsp70. Clearly, a better index of the correlation of Hsp70 induction and cell death was needed than the analysis of Hsp70 at the whole-tissue level by Western blots.
In this report, we have used dual immunocytochemistry for Hsp70 localization and the TUNEL method to investigate the spatial correlation of stress-inducible Hsp70 and programmed cell death in mammalian tissues after whole-body hyperthermia. In all tissues investigated, namely brain, thymus, and bone marrow, 2 populations of cells were apparent in vivo after hyperthermia—those inducing Hsp70 and those triggered into programmed cell death. Cells that were both Hsp70 positive and TUNEL positive were rarely detected.
Studies in tissue culture systems have suggested that Hsp70 may inhibit specific steps in the signal transduction pathway of programmed cell death; hence, cell types inducing this heat shock protein may be protected from being triggered into cell death (Samali and Orrenius 1998; Beere et al 2000; Li et al 2000; Saleh et al 2000; Beere and Green 2001; Garrido et al 2001). Our present in vivo observations on intact mammalian tissues support this view. Cells that induced Hsp70 after whole-body hyperthermia did not undergo cell death. In thymocytes, prior heat shock and subsequent induction of Hsp70 has previously been shown to confer tolerance against radiation-induced cell death (Gordon et al 1997). Bone marrow cells in HSF1 knockout mice, which cannot induce Hsp70, have been demonstrated to lack the ability to develop thermotolerance and are sensitive to heat-induced cell death (Zhang et al 2002).
Certain mammalian cell types do not induce Hsp70 after hyperthermia and do not undergo programmed cell death. In such cases, a protective mechanism involving constitutively expressed heat shock proteins may be operative. For example, our studies have shown that populations of large neurons, such as Purkinje neurons in the cerebellum, do not induce Hsp70 after hyperthermia and do not undergo cell death (Manzerra et al 1993; Khan and Brown 2002). However, these neurons exhibit very high levels of constitutively expressed Hsc70 that we have proposed may play roles in protective mechanisms (Manzerra et al 1993; Manzerra and Brown 1996; D'Souza and Brown 1998).
Our studies suggest that actively dividing cell populations in intact mammalian tissues are more prone to hyperthermia-induced cell death than fully differentiated postmitotic cells. At the spatial level in brain, thymus, and bone marrow, distinct cell populations are apparent in vivo after hyperthermia, representing cells that are either triggered into programmed cell death and exhibit no detectable induction of Hsp70 or demonstrate induction of Hsp70 and are consequently resistant to cell death.
Acknowledgments
We thank Sheila Rush for critical reading of the manuscript.
REFERENCES
- Bechtold DA, Brown IR. Heat shock proteins hsp27 and hsp32 localize to synaptic sites in the rat cerebellum following hyperthermia. Mol Brain Res. 2000;75:309–320. doi: 10.1016/s0169-328x(99)00323-x. [DOI] [PubMed] [Google Scholar]
- Bechtold DA, Rush SJ, Brown IR. Localization of the heat-shock protein hsp70 to the synapse following hyperthermic stress in the brain. J Neurochem. 2000;74:641–646. doi: 10.1046/j.1471-4159.2000.740641.x. [DOI] [PubMed] [Google Scholar]
- Beere HM, Green DR. Stress management—heat shock protein-70 and the regulation of apoptosis. Trends Cell Biol. 2001;11:6–10. doi: 10.1016/s0962-8924(00)01874-2. [DOI] [PubMed] [Google Scholar]
- Beere HM, Wolf BB, and Cain K. et al. 2000 Heat-shock protein 70 inhibits apoptosis by preventing recruitment of procaspase-9 to the Apaf-1 apoptosome. Nat Cell Biol. 2:469–475. [DOI] [PubMed] [Google Scholar]
- Breen JG, Claggett TW, Kimmel GL, Kimmel CA. Heat shock during rat embryo development in vitro results in decreased mitosis and abundant cell death. Reprod Toxicol. 1999;13:31–39. doi: 10.1016/s0890-6238(98)00056-2. [DOI] [PubMed] [Google Scholar]
- Brown IR 1994 Induction of heat shock genes in the mammalian brain by hyperthermia and tissue injury. In: Heat Shock Proteins in the Nervous System, ed Mayer RJ, Brown IR. Academic Press, London, 31–53. [DOI] [PubMed] [Google Scholar]
- Brown IR, Sharp FR 1999 The cellular stress gene response in brain. In: Stress Proteins, Handbook of Experimental Pharmacology, ed Latchman DS. Springer Verlag, New York, 243–263. [Google Scholar]
- De Maio A. Heat shock proteins: facts, thoughts, and dreams. Shock. 1999;11:1–12. doi: 10.1097/00024382-199901000-00001. [DOI] [PubMed] [Google Scholar]
- Dorstyn L, Kinoshita M, and Kumar S 1998 Caspases in cell death. In: Results and Problems in Cell Differentiation: Apoptosis Mechanisms and Role in Disease, ed Kumar S. Springer Verlag, New York, 1–23. [DOI] [PubMed] [Google Scholar]
- D'Souza SM, Brown IR. Constitutive expression of heat shock proteins hsp90, hsc70, hsp70 and hsp60 in neural and non-neural tissues of the rat during postnatal development. Cell Stress Chaperones. 1998;3:188–199. doi: 10.1379/1466-1268(1998)003<0188:ceohsp>2.3.co;2. [DOI] [PMC free article] [PubMed] [Google Scholar]
- Earnshaw WC, Martins LM, Kaufmann SH. Mammalian caspases: structure, activation, substrates, and functions during apoptosis. Annu Rev Biochem. 1999;68:383–424. doi: 10.1146/annurev.biochem.68.1.383. [DOI] [PubMed] [Google Scholar]
- Edwards MJ, Shiota K, Smith MS, Walsh DA. Hyperthermia and birth defects. Reprod Toxicol. 1995;9:411–425. doi: 10.1016/0890-6238(95)00043-a. [DOI] [PubMed] [Google Scholar]
- Garrido C, Gurbuxani S, Ravagnan L, Kroemer G. Heat shock proteins: endogenous modulators of apoptotic cell death. Biochem Biophys Res Commun. 2001;286:433–442. doi: 10.1006/bbrc.2001.5427. [DOI] [PubMed] [Google Scholar]
- Gavrieli Y, Sherman Y, Ben-Sasson SA. Identification of programmed cell death in situ via specific labelling of nuclear DNA fragmentation. J Cell Biol. 1992;119:493–501. doi: 10.1083/jcb.119.3.493. [DOI] [PMC free article] [PubMed] [Google Scholar]
- Georgopoulos C, Welch WJ. Role of the major heat shock proteins as molecular chaperones. Annu Rev Cell Biol. 1993;9:601–634. doi: 10.1146/annurev.cb.09.110193.003125. [DOI] [PubMed] [Google Scholar]
- Gordon SA, Hoffman RA, Simmons RL, Ford HR. Induction of heat shock protein 70 protects thymocytes against radiation-induced apoptosis. Arch Surg. 1997;132:1277–1282. doi: 10.1001/archsurg.1997.01430360023004. [DOI] [PubMed] [Google Scholar]
- Graham JM Jr, Edwards MJ, Edwards MJ. Teratogen update: gestational effects of maternal hyperthermia due to febrile illnesses and resultant patterns of defects in humans. Teratology. 1998;58:209–221. doi: 10.1002/(SICI)1096-9926(199811)58:5<209::AID-TERA8>3.0.CO;2-Q. [DOI] [PubMed] [Google Scholar]
- Karunanithi S, Barclay JW, Brown IR, Robertson RM, Atwood HL. Enhancement of presynaptic performance in transgenic Drosophila overexpressing heat shock protein Hsp70. Synapse. 2002;44:8–14. doi: 10.1002/syn.10048. [DOI] [PubMed] [Google Scholar]
- Karunanithi S, Barclay JW, Robertson RM, Brown IR, Atwood HL. Neuroprotection at Drosophila synapses conferred by prior heat shock. J Neurosci. 1999;19:4360–4369. doi: 10.1523/JNEUROSCI.19-11-04360.1999. [DOI] [PMC free article] [PubMed] [Google Scholar]
- Kelty JD, Noseworthy PA, Feder ME, Robertson RM, Ramirez JM. Thermal preconditioning and heat-shock protein 72 preserve synaptic transmission during thermal stress. J Neurosci. 2002;193:1–6. doi: 10.1523/JNEUROSCI.22-01-j0004.2002. [DOI] [PMC free article] [PubMed] [Google Scholar]
- Khan VR, Brown IR. The effect of hyperthermia on the induction of cell death in the brain, testis and thymus of the adult and developing rat. Cell Stress Chaperones. 2002;7:73–90. doi: 10.1379/1466-1268(2002)007<0073:teohot>2.0.co;2. [DOI] [PMC free article] [PubMed] [Google Scholar]
- Kiang JG, Tsokos GC. Heat shock protein 70 kDa: molecular biology biochemistry, and physiology. Pharmacol Ther. 1998;80:183–201. doi: 10.1016/s0163-7258(98)00028-x. [DOI] [PubMed] [Google Scholar]
- Li CY, Lee JS, Ko YG, Kim JI, Seo JS. Heat shock protein 70 inhibits apoptosis downstream of cytochrome c release and upstream of caspase-3 activation. J Biol Chem. 2000;275:25665–25671. doi: 10.1074/jbc.M906383199. [DOI] [PubMed] [Google Scholar]
- Li GC, Mivenchi NF, Weitzel G. Heat shock proteins, thermotolerance, and their relevance to clinical hyperthermia. Int J Hyperthermia. 1995;11:459–488. doi: 10.3109/02656739509022483. [DOI] [PubMed] [Google Scholar]
- Lindquist S, Craig EA. The heat shock proteins. Annu Rev Genet. 1988;22:631–677. doi: 10.1146/annurev.ge.22.120188.003215. [DOI] [PubMed] [Google Scholar]
- Little SA, Mirkes PE. Teratogen-induced activation of caspase-9 and the mitochondrial apoptotic pathway in early postimplantation mouse embyros. Toxicol Appl Pharmacol. 2002;181:142–151. doi: 10.1006/taap.2002.9414. [DOI] [PubMed] [Google Scholar]
- Manzerra P, Brown IR. The neuronal stress response: nuclear translocation of heat shock proteins as an indicator of hyperthermic stress. Exp Cell Res. 1996;229:35–47. doi: 10.1006/excr.1996.0341. [DOI] [PubMed] [Google Scholar]
- Manzerra P, Rush SJ, Brown IR. Temporal and spatial distribution of heat shock mRNA and protein (hsp70) in the rabbit cerebellum in response to hyperthermia. J Neurosci Res. 1993;36:480–490. doi: 10.1002/jnr.490360414. [DOI] [PubMed] [Google Scholar]
- Mirkes PE, Cornel LM, Park HW, Cunningham ML. Induction of thermotolerance in early postimplantation rat embryos is associated with increased resistance to hyperthermia-induced apoptosis. Teratology. 1997;56:210–219. doi: 10.1002/(SICI)1096-9926(199709)56:3<210::AID-TERA4>3.0.CO;2-4. [DOI] [PubMed] [Google Scholar]
- Mirkes PE, Little SA. Teratogen-induced cell death in postimplantation mouse embryos: differential tissue sensitivity and hallmarks of apoptosis. Cell Death Diff. 1998;5:592–600. doi: 10.1038/sj.cdd.4400390. [DOI] [PubMed] [Google Scholar]
- Mirkes PE, Little SA. Cytochrome c release from mitochondria of early postimplantation murine embryos exposed to 4-hydroperoxycyclophosphamide, heat shock, and staurosporine. Toxicol Appl Pharmacol. 2000;162:197–206. doi: 10.1006/taap.1999.8849. [DOI] [PubMed] [Google Scholar]
- Mirkes PE, Little SA, Umpierre CC. Co-localization of active caspase-3 and DNA fragmentation (TUNEL) in normal and hyperthermia-induced abnormal mouse development. Teratology. 2001;63:134–143. doi: 10.1002/tera.1024. [DOI] [PubMed] [Google Scholar]
- Morimoto RI, Tissieres A, and Georgopoulos C 1994 The Biology of the Heat Shock Proteins and Molecular Chaperones. Cold Spring Harbor Laboratory Press, Cold Spring Harbor, NY. 610 p. [Google Scholar]
- Pardue ML, Ballinger DG, Hogan NC. The heat shock response. Cells coping with transient stress. Ann N Y Acad Sci. 1992;663:125–138. doi: 10.1111/j.1749-6632.1992.tb38656.x. [DOI] [PubMed] [Google Scholar]
- Parsell DA, Lindquist S. The function of heat-shock proteins in stress tolerance: degradation and reactivation of damaged proteins. Annu Rev Genet. 1993;27:437–496. doi: 10.1146/annurev.ge.27.120193.002253. [DOI] [PubMed] [Google Scholar]
- Saleh A, Srinivasula SM, Balkir L, Robbins PD, Alnemri ES. Negative regulation of the Apaf-1 apoptosome by Hsp70. Nat Cell Biol. 2000;2:476–483. doi: 10.1038/35019510. [DOI] [PubMed] [Google Scholar]
- Samali A, Orrenius S. Heat shock proteins: regulators of stress response and apoptosis. Cell Stress Chaperones. 1998;3:228–236. doi: 10.1379/1466-1268(1998)003<0228:hspros>2.3.co;2. [DOI] [PMC free article] [PubMed] [Google Scholar]
- Soleman D, Cornel L, Little SA, Mirkes PE. Teratogen-induced activation of the mitochondrial apoptotic pathway in the yolk sac of day 9 mouse embryos. Birth Defects Res Part A Clin Mol Teratol. 2003;67:98–107. doi: 10.1002/bdra.10005. [DOI] [PubMed] [Google Scholar]
- Walsh DA, Li K, Crowther C, Marsh D, and Edwards M 1991 Thermotolerance and heat shock response during early development of the mammalian embryo. In: Heat Shock and Development, vol 17, ed Hightower LE, Nover L. Berlin Springer Verlag, Heidelberg, 58–70. [DOI] [PubMed] [Google Scholar]
- Wolf BB, Green DR. Suicidal tendencies: apoptotic cell death by caspase family proteinases. J Biol Chem. 1999;274:20049–20052. doi: 10.1074/jbc.274.29.20049. [DOI] [PubMed] [Google Scholar]
- Zhang Y, Huang L, Zhang J, Moskophidis D, Mivechi NF. Targeted disruption of HSF1 leads to lack of thermotolerance and defines tissue-specific regulation for stress-inducible Hsp molecular chaperones. J Cell Biochem. 2002;86:376–393. doi: 10.1002/jcb.10232. [DOI] [PubMed] [Google Scholar]


