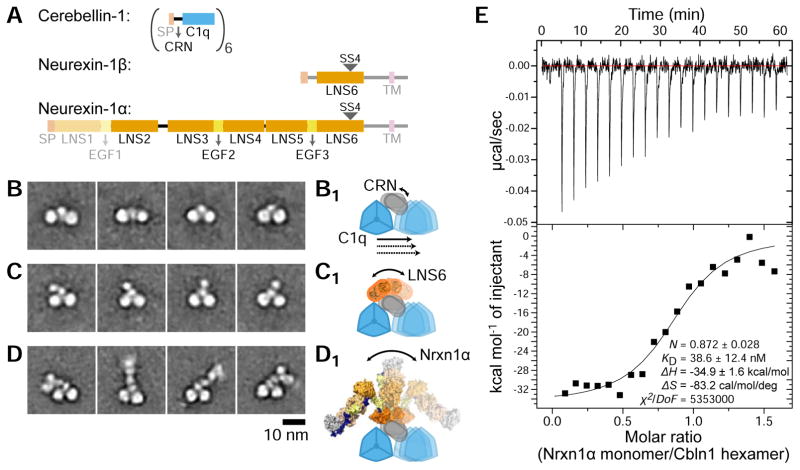
Figure 4. Cerebellin binds both α- and β-Neurexin with its flexible CRN domain.
A. Domain compositions of Cbln1, Nrxn1α and 1β. The shaded domains were not included in expressed constructs used for electron microscopy.
B–D. Representative EM 2D class averages of Cbln1 (B), Cbln1+Nrxn1β (C) and Cbln1+Nrxn1α (D). See also Figure S3.
B1–D1. Schematized representations of movements observed in class averages shown in (B) to (D).
E. One of the three isothermal titration calorimetry experiments for Cbln1 and Nrxn1α binding. The results are fit to a “one set of sites” binding model.

