Abstract
Despite successful demonstration of linear polyethyleneimine (lPEI) as an effective carrier for a wide range of gene medicine, including DNA plasmids, small interfering RNAs, mRNAs, etc., and continuous improvement of the physical properties and biological performance of the polyelectrolyte complex nanoparticles prepared from lPEI and nucleic acids, there still exist major challenges to produce these nanocomplexes in a scalable manner, particularly for lPEI/DNA nanoparticles. This has significantly hindered the progress towards clinical translation of these nanoparticle-based gene medicine. Here we report a flash nanocomplexation (FNC) method that achieves continuous production of lPEI/plasmid DNA nanoparticles with narrow size distribution using a confined impinging jet device. The method involves the complex coacervation of negatively charged DNA plasmid and positive charged lPEI under rapid, highly dynamic, and homogeneous mixing conditions, producing polyelectrolyte complex nanoparticles with narrow distribution of particle size and shape. The average number of plasmid DNA packaged per nanoparticles and its distribution are similar between the FNC method and the small-scale batch mixing method. In addition, the nanoparticles prepared by these two methods exhibit similar cell transfection efficiency. These results confirm that FNC is an effective and scalable method that can produce well-controlled lPEI/plasmid DNA nanoparticles.
Keywords: DNA nanoparticle, flash nanocomplexation, scalable production, linear PEI, gene delivery
1. Introduction
The prospect of developing gene therapies for the detection and treatment of a wide range of diseases such as cancer, immunodeficiency, and metabolic disorders, remains high.(1; 2) Viral-based delivery systems account for the majority of vehicles used in gene therapy clinical trials to date; safety concerns, however, motivate the need to engineer alternate delivery systems.(1; 3) Non-viral gene delivery methods have been developed to overcome the main limitations associated with viruses, such as the potential for immune responses, insertional mutagenesis, limited DNA vector size, and issues with large-scale production.(3–5) Polymeric nanoparticles are the most widely used non-viral carriers, owing to their ability in protecting the DNA from degradation, and improving intracellular delivery and transfection efficiency of the gene of interest.(6–12) Of all polymers developed for gene therapy applications, linear polyethylenimine (lPEI) is often utilized because it mediates high gene delivery efficiency with a satisfactory safety profile when used in optimized formulations in vivo.(7; 13–15) Therefore, lPEI/plasmid DNA nanoparticles have been tested in several clinical trials (e.g., NCT01274455 and NCT00595088), primarily through tissue-specific administration routes.(16)
While there has been increasing efforts to improve the physico-chemical properties and biological performance of lPEI as gene delivery carrier though molecular engineering and nanoparticle optimization, the progress to clinical application has been hindered by the lack of reproducible and scalable methods for assembling these polyelectrolyte complex nanoparticles. Bulk mixing in the form of vortexing or pipetting are widely used in laboratory-scale preparations. Due to the poor micro-mixing efficiency, scaling up these mixing processes in batch mode often leads to high degrees of variability, both within a preparation batch and between different batches, as a result of non-homogenous mixing and aggregation.(17–21) For example, a recent study reported that batch volume of the nanoparticle preparation by conventional bulk methods significantly affected PEI/siRNA nanoparticle size, with larger preparation solution volumes leading to larger and wider range of particle sizes.(22) Therefore, developing scalable production methods by which nanoparticles properties can be reproducibly tuned without compromising the biological performance is paramount.
Microfluidic devices with different designs have been reported aiming at delivering better control over polyelectrolyte complex nanoparticle size and its distribution. For instance, lPEI/siRNA nanoparticles prepared by a microfluidic device displayed significantly higher gene knockdown efficiency in vitro compared to those prepared by bulk mixing.(22) Furthermore, nanoparticle properties did not change when the batch size of microfluidic mixing was varied. Another study using microfluidics-assisted confinement to prepare polycation/DNA nanocomplexes.(23) Compared to bulk preparation, microfluidic preparation led to decrease in nanoparticle size distribution, yielding highly condensed, compact and stable nanostructures, reduction in cytotoxicity, and an enhancement in in vitro transfection efficiency. Microfluidic systems, however, have some inherent limitations, such as a narrow range of solvent choice in matching the compatibility with silicones, low tolerance for pressure change, and limited production throughput due to the small size of the microfluidic channels and low flow rates.(24; 25)
Here we describe a new method, flash nanocomplexation (FNC), which is capable of producing polyeletrolyte complex nanoparticles in a continuous and scalable manner. This process is analogous to the flash nanoprecipitation (FNP) process that has been used to produce block copolymer nanoparticles under rapid micromixing conditions (on the order of 1 msec) to establish homogeneous supersaturation conditions and controlled precipitation of hydrophobic solutes (organic or inorganic) using block copolymer self-assembly.(26–29) A key difference between FNC and FNP is that the former generates nanoparticles as a result of polyelectrolyte complexation without relying on solvent-induced supersaturation and precipitation of copolymers as it is in the case of FNP, whereas the phase separation in the case of FNC is induced by polyelectrolyte complexation. Compared to the bulk mixing method, the FNC process allows for the formation of uniform aggregates and size in a continuous flow operation process, which is amenable to the scale-up production. FNC also has the potential to offer a higher degree of control over particle size and distribution and improved colloidal stability.(29–36) Despite the extensive work on self-assembly of amphiphilic copolymer nanoparticles using the FNP method, there has been no work showing the suitability of preparing polyelectrolyte complex nanoparticles under similar mixing conditions. In this report, we detailed the first example of FNC preparation of polyelectrolyte complex nanoparticles using lPEI/plasmid DNA nanoparticles as an example, and demonstrated the versatility and unique advantages of the FNC process in comparison with the “standard” batch mixing method.
2. Results and Discussion
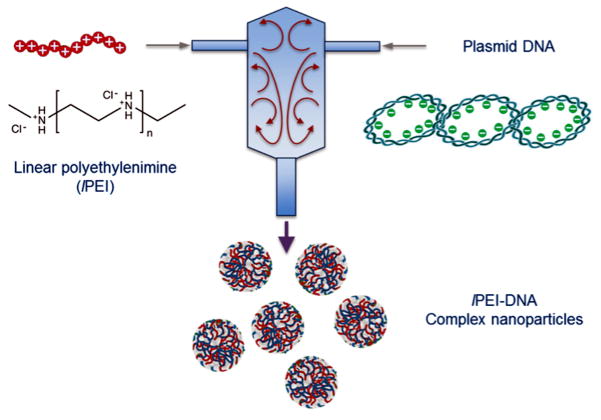
The production of highly uniform lPEI/DNA complex nanoparticles in large scale with high reproducibility is a key challenge to successful translation of these nanoparticles from the bench to the clinic. In a typical or standard preparation such as that recommended by PolyPlus Transfection using In vivo-jetPEI®, the preparation involves mixing an lPEI solution and a DNA solution at fixed concentrations in a mixing vial in a batch mode. The mixing volume is typically several hundred microliters. It is rather difficult to scale up such a batch-mixing preparation process while maintaining the uniformity oft he nanoparticles prepared. In the present work, we demonstrated for the first time the use of a flash mixing process to generate polyelectrolyte complex nanoparticles comprised of a cationic polymer, lPEI, and an anionic biopolymer, plasmid DNA. The central element of this process is a confined mixing chamber with defined geometries with two or more impinging fluid streams (inlets, Figure 1). These comfined impinging jets (CIJ) are introduced into the chamber under controlled, rapid mixing conditions,(28; 31) yielding lPEI/DNA complex nanoparticles with well-defined size and narrow distribution. More importantly, this CIJ device allows for high-throughput screening preparation of nanoparticles in either a smaller scale (~ 2 mL) or a larger scale (> 50 mL) production through a continuous flow approach. As shown in Figure 1, lPEI and DNA solutions were loaded in separate syringes and impinged at various flow rates (1 – 50 mL/min) into a confined chamber using digitally programmable pumps.
Figure 1.
Schematic diagram showing the CIJ device used to fabricate polyelectrolyte complex nanoparticles under rapid mixing conditions. Streams are independently loaded with lPEI and plasmid DNA, and lPEI/DNA complex nanoparticles are formed in a small confined chamber before being collected.
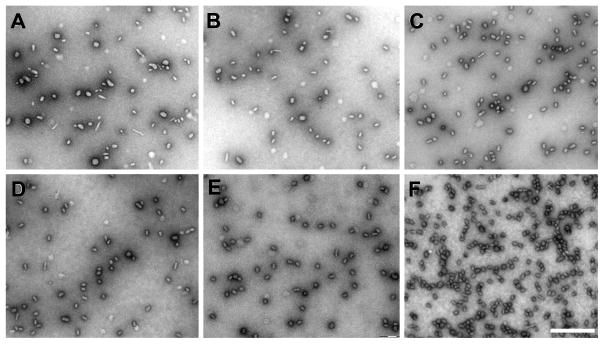
Process variables such as flow rate could influence the physiochemical properties (size, shape, and PDI) of the prepared lPEI/DNA nanoparticles. To evaluate the role of the flow rate on the preparation of lPEI/DNA complex nanoparticles, experiments were conducted at different flow rates (1 mL/min, Reynolds number Re = 95, up to 50 mL/min, Re = 4,750) while the concentrations of DNA and PEI solutions were kept constant. Transmission electron microscopy images (25) of lPEI/DNA nanoparticles suggested a noticeable effect of the flow rate on particle size and distribution (Figure 2). For flow rates below 20 mL/min (Re < 1,900, Figure 2A and 2B), nanoparticles were slightly bigger and more heterogeneous. In contrast, smaller (average 30 – 40 nm) and more homogeneous lPEI/DNA nanoparticles were generated when the flow rates oft he two solutions were higher than 20 mL/min (i.e. when Re number was higher than than 1,900). These results are consistant with the mixing dynamics in a typical FNP process. Since the characteristic mixing time is a function of the flow rate, the mixing time (τmix) is not short enough to provide a homogeneous micromixing environment at a low Re number, and hence resulting in the formation of larger and more heterogenous populations of nanoparticles. When the flow rate is high enough (i.e. reaching a high Re), the mixing time is on the order of a few milliseconds (< 10 ms) and the flow pattern assumes turbulent-like characteristics. Under these conditions, mixing or mass transfer is no longer a rate limiting step in the process of complexation, and thus more uniformly sized lPEI/DNA nanoparticles are generated.
Figure 2.
Effect of the flow rate on particle size and distribution. lPEI/DNA complex nanoparticles were prepared at varying flow rates and analyzed by TEM. DNA concentration was 25 μg/mL, N/P= 8, and pH of lPEI solution was 3.5. TEM images of lPEI-DNA complex nanoparticles prepared at 5 mL/min (A), 10 mL/min (B), 20 mL/min (C), 30 mL/min (D), 40 mL/min (E), and 50 mL/min (F). Scale bar is 500 nm.
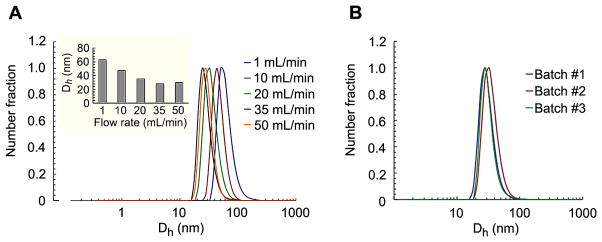
DLS analysis of lPEI/DNA nanoparticles prepared at various flow rates indicated that the average size of nanoparticles decreased with the flow rate. The average sizes of nanoparticles were similar when the flow rates were higher than 20 mL/min (Figure 3A), suggesting the limit of rapid mixing was achieved under this condition. These results are consistent with literature results observed for amphiphilic polymer nanoparticles prepared by the FNP method, where nanoparticle size becomes independent of flow rate for Re numbers above 1,600.(27–29; 36) Using an analogous comparison, the average particle size under such a condition is a function of the mixing time, the concentration of mixing components (i.e. polyeletrolytes), the complexation reaction rate, and the growth rate of the complex particles.(27; 28; 36) To further illustrate the robustness and reproducibility of the lPEI/DNA nanoparticle formation process in a CIJ device, 3 batches of nanoparticles were prepared by different operators at different times. DLS analysis (Figure 3B) showed no significant batch-to-batch variability, highlighting high reproducibility of this FNC process. Since CIJ-based FNC process can operate in a continuous mode, the physiochemical properties of the nanoparticles are independent of batch size. This process ensures the consistent production of nanoparticles at an industrial scale (> 1 g of nanoparticles per hour for each device).(37)
Figure 3.
Effect of the flow rate on number average size distribution of lPEI/DNA nanoparticles (A); insert graph sows mean number average particle size for the flow rates tested. Inter-batch variability for lPEI/DNA nanoparticles prepared at a flow rate of 40 mL/min. lPEI/DNA nanoparticles were prepared at an initial DNA concentration of 100 μg/mL, N/P= 8, and pH of lPEI solution is 3.5.
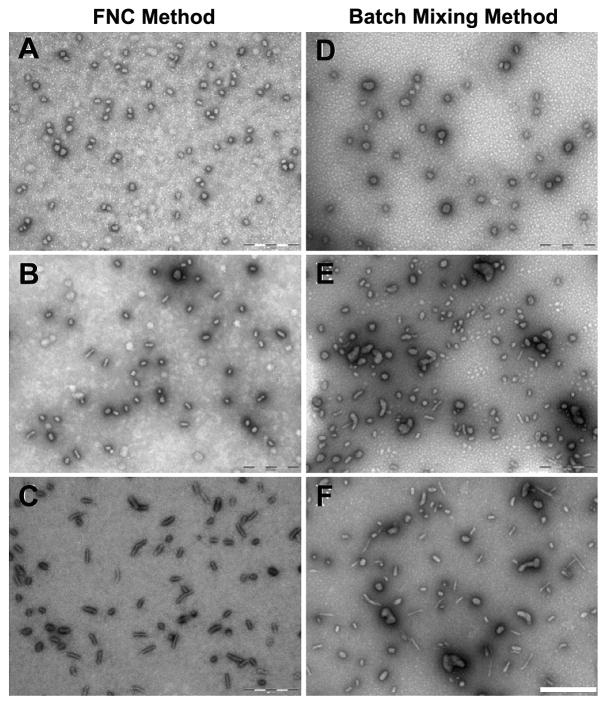
Having established the conditions at which lPEI/DNA nanoparticles were produced with high reproducibility in a CIJ device, we investigated how DNA concentration influences particle size and size distribution for FNC process in comparison with the bulk mixing method. The lPEI/DNA nanoparticles were prepared at DNA concentrations of 25, 50, and 100 μg/mL while keeping the lPEI/DNA ratio constant (N/P ratio = 8). Representative TEM images of the nanoparticle preparations shown in Figure 4 indicated that lPEI/DNA nanoparticles prepared by FNC in a CIJ device at a flow rate of 20 mL/min (Figure 4A–C) were slightly smaller and more uniform size distribution compared to the bulk mixing counterpart (Figure 4D–F) regardless the DNA concentration. The formation of smaller and uniform complex nanoparticles by FNC suggests that CIJ mixing could achieve more efficient mixing and uniform complexation than that in the bulk mixing condition tested here. Interestingly, when the concentration of DNA was increased from 25 to 100 μg/mL in the FNC preparation (Figure 4A–C), nanoparticles underwent a morphological transition from predominatly spherical shape to short rod-like nanoparticles. Although it requires further investigation, it seems that in addition to providing a better control over nanoparticle size and distribution, FNC may be useful in generating nanoparticles of different shapes via fine-tuning of the conditions used in the process.
Figure 4.
TEM images of lPEI/DNA complex nanoparticles prepared under fast mixing conditions (A–C) in a CIJ and bulk mixing (D–F) using different DNA concentrations. For fast mixing conditions, a flow rate of 20 mL/min was used. The pH of lPEI solutions was adjusted to 3.5 and a N/P ratio of 8 was used. Concentration of DNA used for complexation is 25 μg/mL (A, D), 50 μg/mL (B, E), and 100 μg/mL (C, F). Scale bar is 500 nm.
Formulation parameters and CIJ process variables play critical roles in determining the physiochemical properties of the prepared nanoparticles, including particle size and uniformity. We then investigated the effect of pH of lPEI solution on DNA complexation and nanoparticle formation, since the charge density of lPEI is highly dependent upon the pH of the solution. In this experiment, the initial pH value of lPEI solution was adjusted to different value before being impinged with DNA solution in the CIJ device. To minimize the exposure of DNA to low pH, the pH and concentration of DNA solution was not changed (10 mM TE buffe rat pH 7.8). As the pH value of the lPEI solution increased from 2.5 to 4.5, lPEI/DNA complex nanoparticles experienced a significant shape transition, from small and more compact nanoparticles (30 – 40 nm) at pH 2.5 to more predorminantly rod-like morphology at pH 4.5 (Figure 5B–D). Increasing the pH of lPEI solution to 5.5 (Figure 5A) further reduced the fraction of spherical nanoparticles present in the preparation (from 25% at pH 4.5 to 12% at pH 5.5). This trend is consistent with the effect of lPEI net charge density and its ability to effectively condense plasmid DNA. At low pH values (pH < 3.5), lPEI is completely protonated and more effectively condense DNA into more compact nanoparticles. At high pH values (pH > 4) the net positive charge density of lPEI is significantly lower, generating less compact, rod-like particles.
Figure 5.
TEM images of lPEI/DNA complex nanoparticles of various shapes prepared under fast mixing conditions in a CIJ using PEI solutions of different pH. A flow rate of 20 mL/min, DNA concentration of 25 μg/mL and N/P = 8 were used. (A) pH of lPEI solution is 5.5. (B) pH of lPEI solution is 4.5. (C) pH of lPEI solution is 3.5, and (D) pH of lPEI solution is 2.5. Scale bar is 500 nm.
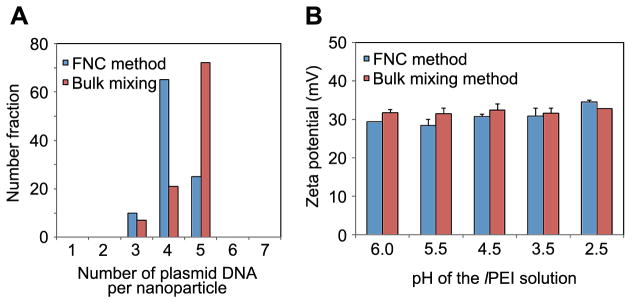
We also measured the surface charge lPEI/DNA nanoparticles prepared by FNC using lPEI solutions at various pH values. Nanoparticles prepared by FNC have an average positive surface charge of +30 mV in the preparation medium (Figure S1), regardless the pH of the starting lPEI solution. Similar values were observed for complex nanoparticles prepared by bulk mixing reflecting the large amount of residue positive charges on the surface of nanoparticles due tot he high N/P ratio used. When tested in PBS at physiological ionic strength, however, the surface charge of both set of nanoparticles dropped to +20 mV, as a result of deprotonation of lPEI polymer and charge screening effect of complex nanoparticles in the buffered solution.
Together with size and shape, it is perceiveable that the average amount of DNA per nanoparticles could play a significant role in gene transfection efficiency. Nanoparticles prepared via both the FNC and bulk mixing methods were evaluated for their DNA content distribution. To analyze the composition distribution of DNA nanoparticles prepared by FNC, we used a single particle analysis method based on cylindrical illumination confocal spectroscopy (CICS), recently developed in our labs,(38) which offers high detection uniformity and mass detection efficiency. For this analysis, lPEI/DNA nanoparticles were prepared using Cy5-labeled plasmid DNA and then passed through a microfluid chip to allow single particle measurement for their fluorescent intensity at 670 nm using CICS. In order to obtain the distribution of particles with differing DNA content, the peak intensity was deconvoluted using labeled plasmid DNA as a control. As shown above, uniform and compact lPEI-DNA nanoparticles were prepared using FNC method at a flow rate of 20 mL/min using 25 μg/mL DNA and pH 3.5 for lPEI solution. CICS analysis showed that the average number of DNA plasmids per nanoparticle (4.2) was similar for FNC nanoparticles than that for bulk mixing method (4.8) (Figure 6A), although the distribution of DNA among the nanoparticle population showed a noticeable difference. The majority of the FNC nanoparticles contained 4 DNA molecules, whereas the ones prepared by bulk mixing mostly contained 5 DNA molecules.
Figure 6.
Physico-chemical characterization of lPEI/DNA complex nanoparticles generated under fast and bulk mixing conditions. (A) Distribution of DNA content for particles prepared under fast and bulk mixing conditions using Cylindrical Illumination Correlation Spectroscopy. The average number of DNA per particle was found to be 4.2 and 4.7 for fast and bulk mixing, respectively. (B) Zeta-potential of lPEI/DNA complex nanoparticles prepared under fast and bulk mixing, and polymer solutions of several pH values. DNA concentration was 25 μg/mL and N/P ratio 8.
High degree of shear is known to cause serious fragmentation of plasmid DNA. Shear rate in a typical FNC or FNP processes can reach values of ~ 9,300 s-1 for a Re number of ~ 8,000 (35), which might damage large biomacromolecules such us DNA plasmids and proteins. To assess possible fragmentation of DNA during nanoparticle formation in a CIJ device, naked plasmid DNA was impinged at flow rates varying from 1 to 50 mL/min in the absence of lPEI. The flow through samples were analyzed by gel electrophoresis. As shown in Figure 7, all DNA samples exposed to different flow rates presented similar bands and intensities as the control DNA sample that was not subjected to FNC flow condition, suggesting that the plasmid DNA integrity was not compromised by the flow conditions used here.
Figure 7.
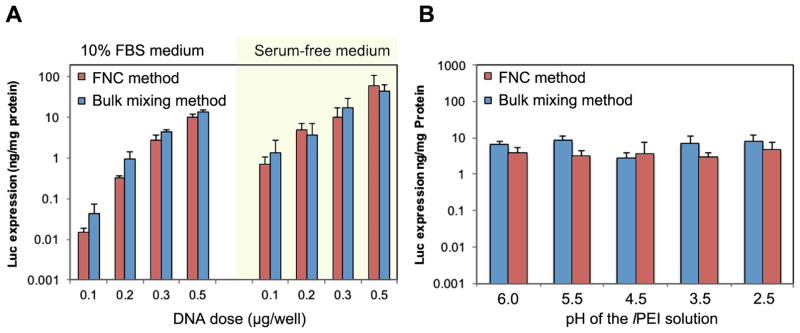
In-vitro transfection efficiency of lPEI/DNA complex nanoparticles HeLa cells. (A) DNA-dose dependent transfection efficiency of lPEI/DNA complex nanoparticles generated under fast and bulk mixing conditions in 10% serum and serum free conditions. (B) Transfection efficiency of lPEI/DNA complex nanoparticles generated under fast and bulk mixing conditions, and prepared with lPEI polymer solutions at different pH values. DNA concentration was 25 μg/mL and N/P ratio 8. Flow rate was 20 mL/min. Each bar represents mean ± standard deviation (n = 4).
To test the bioactivity of the plasmid DNA exposed to high flow rates, we complexed the flow through DNA with the standard transfection reagents including in vivo-jetPEI and Lipofectamine 2000, and tested its transfection efficiency in HeLa cells using a luciferase reporter plasmid DNA. All DNA samples exposed to different flow rates showed comparable levels of transfection efficiency to those that were not subjected to the FNC flow condition, suggesting that the integrity of plasmid DNA was fully maintained (Figure S2). The transfection efficiency increased as DNA dose increased from 0.1 μg/well to 0.5 μg/well. In addition, the transfection efficiency of these nanoparticles in serum free media was significantly higher than in serum containing media, especially at lower DNA doses (0.1 or 0.2 μg DNA/well). Nonetheless, nanoparticles prepared by the FNC method exhibited equivalent levels of transfection efficiency as those prepared by the batch mode mixing method at 200-μL scale. Given that lPEI is a highly effective transfection agent, we believe that the improvements in nanoparticle size and uniformity provided by FNC may be masked by the effectiveness of this transfection agent.
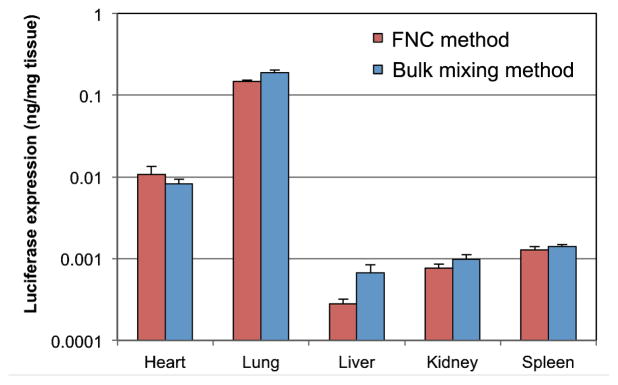
We also investigated the in vivo transfection efficiency of these nanoparticles in balb/c mice through tail vein injection. To obtain a quantitative measurement of luciferase expression in different organs, heart, lung, liver, kidney, and spleen tissues were harvested and homogenized; and the samples were recorded on a luminometer. Figure 8 showed that lung had the highest transfection per mg of tissue, which was 10 times higher than that observed in the heart, and 100 times higher than those detected in other organs. The reason might be that after injection from tail vein, lung was the first organ, which had a large area of capillary surface. More importantly, there was no statistically significant difference between the two groups injected with nanoparticles produced by FNC and the small-scale bulk mixing methods.
Figure 8.
Transfection efficiency of lPEI/DNA nanoparticles prepared by FNC and bulk mixing methods in different organs of Balb/c mice at 48 h following i.v. injection. lPEI/DNA complex nanoparticles were prepared with lPEI polymer solutions at pH 3.5 for both methods. DNA concentration was 25 μg/mL. The flow rate was 20 mL/min for FNC. Each bar represents mean ± standard deviation (n = 4).
These results collectively confirm that lPEI/DNA nanoparticles prepared by FNC method retained similar bioactivity as the batch mixing method. This CIJ-based FNC method provides a reliable and robust method for scale up production of these nanoparticles.
3. Conclusion
We have successfully developed an efficient FNC process for continuous production of lPEI/DNA nanoparticles with uniform and compact size. The quality of the lPEI/DNA nanoparticles prepared with this process is dependent on several experimental parameters including flow rates of the solutions, pH of lPEI solution, and concentrations of lPEI and DNA solutions. There is no significant batch-to-batch variability for the DNA nanoparticles prepared with this FNC method. More importantly, DNA sample remains intact and fully bioactive after being subjected to the flow conditions. The FNC prepared nanoparticles yielded the same transfection efficiency as those prepared with small scale batch-mode mixing. This FNC process could be applied for preparing DNA and RNA containing nanoparticles with other polycationic carriers. These results suggest that FNC can be easily extended for scale production of polyelectrolyte coacervate (PEC) nanoparticles.
4. Experimental Section
4.1. Materials
Linear polyethyleneimine (lPEI, molecular weight 22 kDa) was a gift from Polymer Chemistry Innovations, Inc. (Tucson, AZ), and purified using a pair of Amicon ultracentrifugation filters with MWCOs of 10 kDa and 50 kDa, respectively. Plasmid DNA, VR1255C (6.4 kb), encoding the gene for firefly luciferase driven by the cytomegalovirus promoter, was kindly provided by Vical (San Diego, CA). Plasmid DNA was amplified in DH5α E. coli and purified using an EndoFree Giga Kit (Qiagen, Valencia, CA) and dissolved at 1 mg/mL in endotoxin-free TE buffer (10 mM Tris, 1 mM EDTA, pH 7.8). Unless otherwise stated, all other chemicals were purchased from Sigma-Aldrich.
4.2. Nanoparticle preparation
FNC device design
lPEI/DNA complex nanoparticles were prepared in a CIJ mixer equipped with two streams. The CIJ as well as the FNC process are illustrated in Figure 1. The chamber dimensions are the same as those previously reported by Johnson et al. (27) and Shen et al. (29) It should be noted that the mixer used herein is designed to allow unequal flow momentum from the two opposing jets. (39; 40) Typically, the mixer inlets were connected to gas-tight plastic syringes (5, 10, 20, or 50 mL) via PTFE tubing with a ID of 1.55 mm. The complex nanoparticles were collected in scintillation vials through a PTFE tubing (ID = 0.75 mm, length = 12.7 cm) connected to the mixing chamber. The same flow rate at which the solutions of the lPEI polymer and plasmid DNA contained in syringes were impinged into the confined chamber was readily tuned via a programmable syringe pump (New Era Pump System, model NE-4000). The mixing efficiency and the nature of the flow is commonly defined by the Reynolds number (Re), a dimensionless number representing the ratio of the inertial flow to the viscous force:
| (1) |
For a CIJ device, the overall Re numbers is calculated by accumulating the contribution of multiple streams: (2)
| (2) |
where, ρi is the density of the fluid in the ith inleat stream (kg/m3); V is the mean fluid velocity (s); Qi is the stream flow rate of the ith inleat stream (m3/s); η is the viscosity of the fluid (Kg/m s); μi is the fluid viscosity of the ith inlet stream (Pa s); a is the diameter of the inlet nozzle (m) and n is the number of streams. For the device used here, there are two inlets introducing the solutions of lPEI and DNA.
lPEI/DNA complex nanoparticles formulation
In a typical FNC preparation of lPEI/DNA nanoparticles, the plasmid DNA was diluted into 2 mL with an appropriate amount of DI water to give a final concentration of 25 to 200 μg/mL DNA. Similarly a lPEI solution was diluted to 2 mL using DI water to give a final concentration corresponsing to an N/P ratio (ratio of amine in lPEI to phosphate in DNA) of 8. For example, for 200 μg/mL DNA condition, the concentration of lPEI solution was adjusted to 4.8 mM amines to achieve an N/P ratio of 8. The pH of the lPEI solution was adjusted using HCl (0.5 M) to obtain different pH values of 2.5, 3.5, 4.5, and 5.5 before nanoparticle preparation. Both solutions were then loaded in separate 5-mL syringes, and mounted on the same syringe pump to ensure the same flow rate for both solutions. The two streams were impinged inside the mixing chamber at varying flow rates (1 mL/min up to 50 mL/min) to start the nanoparticle preparation. The complex nanoparticles were collected. The first 0.5 mL of nanoparticle suspension was discarded since it takes a few hundred milliseconds to stablize the mixing condition.
4.3. Transmission electron microscopy (TEM)
TEM imaging samples of lPEI/DNA complex nanoparticles were prepared by incubating 10 μL of lPEI/DNA nanoparticle solution onto an ionized nickel grid covered with a carbon film. After 10 min, the solution was removed, and a 6-μL drop of 2% uranyl acetate was added to the grid. After 20 sec, the staining solution was removed, and the grid was dried at room temperature. The samples were imaged with a Technai FEI-12 electron microscope. Nanoparticle sizes on TEM images were characterized using Image J 1.44.
4.4. Size and zeta potential measurement
Particle size and zeta potential were measured by photon correlation spectroscopy and laser Doppler anemometry, respectively, using a Zetasizer Nano ZS90 (Malvern Instruments, Southborough, MA). Size measurement was performed at 25°C using a 90° scattering angle. The mean hydrodynamic diameter was determined by cumulative analysis. The zeta potential measurements were performed using a DTS1070-folded capillary cell in the automatic mode.
4.5. DNA content distribution in nanoparticles
The DNA content per nanoparticle was analyzed using the system described in reference (38). Plasmid DNA was labeled using Mirus Bio Label IT® Tracker™ Intracellular Nucleic Acid Localization Kits, Cy5 (Mirus Bio LLC. Madison, WI) and used to synthesize nanoparticles with lPEI in both bulk mixing and FNC methods. These particles were individually measured for their fluorescent intensity at 670 nm using Cylindrical Illumination Correlation Spectroscopy (CICS) and compared with free labeled DNA. In order to obtain the distribution of nanoparticles with differing DNA contents, the peak intensity was deconvolved and labeled naked DNA as used as a control.
4.6. In Vitro transfection of lPEI/DNA complex nanoparticles
HeLa cells were maintained in Dulbecco’s Modified Eagle’s Medium (DMEM) supplemented with 10% FBS and 100 U/mL Penicillin/100 μg/mL Streptomycin, and cells were cultured at 37°C and 5% CO2. Cells were seeded in 48-well plates at a density of 2 × 10⁴ cells/well 24 h prior to the transfection experiments. Various nanoparticle suspension equivalent to 0.1–0.5 μg of DNA dose/well were added to the cells and incubated for 4 h, followed which the media was refreshed. After 48 h, media was removed and cells were washed with 1× PBS (pH 7.4). One hundred μL of reporter lysis buffer (Promega, Madison, WI) was added to each well and cells were subjected to two freeze-thaw cycles. Twenty μL of cell lysate from each well was assayed using a luciferase assay kit (Promega, Madison, WI) on a luminometer (20/20n, Turner BioSystems, Sunnyvale, CA). The luciferase activity was converted to the amount of luciferase expressed using a recombinant luciferase protein (Promega) as the standard. Total protein content in the lysate was measured by BCA assay (Pierce, Rockford, IL), and luciferase expressed was normalized against total protein content.
4.7. In vivo transfection of lPEI/DNA complex nanoparticles
All in vivo procedures were approved by the Johns Hopkins University Institutional Animal Care and Use Committee. Balb/c mice (10 – 14 week-old, male, n = 4 per group, Charles River Laboratories, Frederick, MD) were injected with 200 μL of nanoparticle solutions encapsulating 40 μg plasmid DNA through lateral tail vein. At 48 h after injection, the major organs including the heart, lung, liver, kidney, and spleen were collected and homogenized by rotor/stator homogenizer in PBS. The luciferase expression levels in different tissues were measured by Luciferase Assay System (Promega, E1501) in 20/20 Luminometer (Turner BioSystem), calibrated using recombinant luciferase as standard, and normalized against tissue weight or concentration.
Supplementary Material
Acknowledgments
This study is partially supported by the National Institutes of Health/National Institute of Biomedical Imaging and Bioengineering through grants R01EB018358 and R21EB013274, and the Guangdong Innovative and Entrepreneurial Research Team Program (Grant No. 2013S086) in China.
Footnotes
Supporting Information is available from the Wiley Online Library or from the author.
References
- 1.Ginn SL, Alexander IE, Edelstein ML, Abedi MR, Wixon J. Gene therapy clinical trials worldwide to 2012 - an update. J Gene Med. 2013;15:65–77. doi: 10.1002/jgm.2698. [DOI] [PubMed] [Google Scholar]
- 2.Peer D, Karp JM, Hong S, FaroKhzad OC, Margalit R, Langer R. Nanocarriers as an emerging platform for cancer therapy. Nature Nanotechnology. 2007;2:751–60. doi: 10.1038/nnano.2007.387. [DOI] [PubMed] [Google Scholar]
- 3.Yin H, Kanasty RL, Eltoukhy AA, Vegas AJ, Dorkin JR, Anderson DG. Non-viral vectors for gene-based therapy. Nat Rev Genet. 2014;15:541–55. doi: 10.1038/nrg3763. [DOI] [PubMed] [Google Scholar]
- 4.Baum C, Kustikova O, Modlich U, Li Z, Fehse B. Mutagenesis and oncogenesis by chromosomal insertion of gene transfer vectors. Hum Gene Ther. 2006;17:253–63. doi: 10.1089/hum.2006.17.253. [DOI] [PubMed] [Google Scholar]
- 5.Bessis N, GarciaCozar FJ, Boissier MC. Immune responses to gene therapy vectors: influence on vector function and effector mechanisms. Gene Ther. 2004;11(Suppl 1):S10–7. doi: 10.1038/sj.gt.3302364. [DOI] [PubMed] [Google Scholar]
- 6.Bertrand N, Wu J, Xu X, Kamaly N, Farokhzad OC. Cancer nanotechnology: the impact of passive and active targeting in the era of modern cancer biology. Adv Drug Deliver Rev. 2014;66:2–25. doi: 10.1016/j.addr.2013.11.009. [DOI] [PMC free article] [PubMed] [Google Scholar]
- 7.Bonnet M-E, Erbacher P, Bolcato-Bellemin A-L. Systemic delivery of DNA or siRNA mediated by linear polyethylenimine (L-PEI) does not induce an inflammatory response. Pharmaceutical Research. 2008;25:2972–82. doi: 10.1007/s11095-008-9693-1. [DOI] [PubMed] [Google Scholar]
- 8.Chauhan VP, Jain RK. Strategies for advancing cancer nanomedicine. Nature Materials. 2013;12:958–62. doi: 10.1038/nmat3792. [DOI] [PMC free article] [PubMed] [Google Scholar]
- 9.Mura S, Nicolas J, Couvreur P. Stimuli-responsive nanocarriers for drug delivery. Nature Materials. 2013;12:991–1003. doi: 10.1038/nmat3776. [DOI] [PubMed] [Google Scholar]
- 10.Pack DW, Hoffman AS, Pun S, Stayton PS. Design and development of polymers for gene delivery. Nature Reviews Drug Discovery. 2005;4:581–93. doi: 10.1038/nrd1775. [DOI] [PubMed] [Google Scholar]
- 11.Jia HZ, Zhang W, Zhu JY, Yang B, Chen S, et al. Hyperbranched-hyperbranched polymeric nanoassembly to mediate controllable co-delivery of siRNA and drug for synergistic tumor therapy. Journal of controlled release : official journal of the Controlled Release Society. 2015;216:9–17. doi: 10.1016/j.jconrel.2015.08.006. [DOI] [PubMed] [Google Scholar]
- 12.Zhu JY, Zeng X, Qin SY, Wan SS, Jia HZ, et al. Acidity-responsive gene delivery for “superfast” nuclear translocation and transfection with high efficiency. Biomaterials. 2016;83:79–92. doi: 10.1016/j.biomaterials.2016.01.003. [DOI] [PubMed] [Google Scholar]
- 13.Jere D, Jiang HL, Arote R, Kim YK, Choi YJ, et al. Degradable polyethylenimines as DNA and small interfering RNA carriers. Expert Opinion on Drug Delivery. 2009;6:827–34. doi: 10.1517/17425240903029183. [DOI] [PubMed] [Google Scholar]
- 14.Patnaik S, Gupta KC. Novel polyethylenimine-derived nanoparticles for in vivo gene delivery. Expert Opinion on Drug Delivery. 2013;10:215–28. doi: 10.1517/17425247.2013.744964. [DOI] [PubMed] [Google Scholar]
- 15.Wightman L, Kircheis R, Rossler V, Carotta S, Ruzicka R, et al. Different behavior of branched and linear polyethylenimine for gene delivery in vitro and in vivo. Journal of Gene Medicine. 2001;3:362–72. doi: 10.1002/jgm.187. [DOI] [PubMed] [Google Scholar]
- 16.Buscail L, Bournet B, Vernejoul F, Cambois G, Lulka H, et al. First-in-man phase 1 clinical trial of gene therapy for advanced pancreatic cancer: safety, biodistribution, and preliminary clinical findings. Mol Ther. 2015;23:779–89. doi: 10.1038/mt.2015.1. [DOI] [PMC free article] [PubMed] [Google Scholar]
- 17.Mangraviti A, Tzeng SY, Kozielski KL, Wang Y, Jin Y, et al. Polymeric nanoparticles for nonviral gene therapy extend brain tumor survival in vivo. ACS Nano. 2015;9:1236–49. doi: 10.1021/nn504905q. [DOI] [PMC free article] [PubMed] [Google Scholar]
- 18.Mastorakos P, da Silva AL, Chisholm J, Song E, Choi WK, et al. Highly compacted biodegradable DNA nanoparticles capable of overcoming the mucus barrier for inhaled lung gene therapy. Proc Natl Acad Sci U S A. 2015 doi: 10.1073/pnas.1502281112. [DOI] [PMC free article] [PubMed] [Google Scholar]
- 19.Murday JS, Siegel RW, Stein J, Wright JF. Translational nanomedicine: status assessment and opportunities. Nanomedicine. 2009;5:251–73. doi: 10.1016/j.nano.2009.06.001. [DOI] [PubMed] [Google Scholar]
- 20.Valencia PM, Farokhzad OC, Karnik R, Langer R. Microfluidic technologies for accelerating the clinical translation of nanoparticles. Nat Nanotechnol. 2012;7:623–9. doi: 10.1038/nnano.2012.168. [DOI] [PMC free article] [PubMed] [Google Scholar]
- 21.Yang J, Hendricks W, Liu GS, McCaffery JM, Kinzler KW, et al. A nanoparticle formulation that selectively transfects metastatic tumors in mice. Proceedings of the National Academy of Sciences of the United States of America. 2013;110:14717–22. doi: 10.1073/pnas.1313330110. [DOI] [PMC free article] [PubMed] [Google Scholar]
- 22.Lim JM, Swami A, Gilson LM, Chopra S, Choi S, et al. Ultra-High Throughput Synthesis of Nanoparticles with Homogeneous Size Distribution Using a Coaxial Turbulent Jet Mixer. Acs Nano. 2014;8:6056–65. doi: 10.1021/nn501371n. [DOI] [PMC free article] [PubMed] [Google Scholar]
- 23.Ho YP, Grigsby CL, Zhao F, Leong KW. Tuning Physical Properties of Nanocomplexes through Microfluidics-Assisted Confinement. Nano Letters. 2011;11:2178–82. doi: 10.1021/nl200862n. [DOI] [PMC free article] [PubMed] [Google Scholar]
- 24.Kolishetti N, Dhar S, Valencia PM, Lin LQ, Karnik R, et al. Engineering of self-assembled nanoparticle platform for precisely controlled combination drug therapy. Proc Natl Acad Sci U S A. 2010;107:17939–44. doi: 10.1073/pnas.1011368107. [DOI] [PMC free article] [PubMed] [Google Scholar]
- 25.Romanowsky MB, Abate AR, Rotem A, Holtze C, Weitz DA. High throughput production of single core double emulsions in a parallelized microfluidic device. Lab Chip. 2012;12:802–7. doi: 10.1039/c2lc21033a. [DOI] [PubMed] [Google Scholar]
- 26.Johnson BK, Prud’homme RK. Flash NanoPrecipitation of organic actives and block copolymers using a confined impinging jets mixer. Australian Journal of Chemistry. 2003;56:1021–4. [Google Scholar]
- 27.Johnson BK, Prud’homme RK. Mechanism for rapid self-assembly of block copolymer nanoparticles. Phys Rev Lett. 2003;91:118302. doi: 10.1103/PhysRevLett.91.118302. [DOI] [PubMed] [Google Scholar]
- 28.Johnson BK, Prud’homme RK. Chemical processing and micromixing in confined impinging jets. Aiche Journal. 2003;49:2264–82. [Google Scholar]
- 29.Shen H, Hong SY, Prud’homme RK, Liu Y. Self-assembling process of flash nanoprecipitation in a multi-inlet vortex mixer to produce drug-loaded polymeric nanoparticles. Journal of Nanoparticle Research. 2011;13:4109–20. [Google Scholar]
- 30.D’Addio SM, Baldassano S, Shi L, Cheung LL, Adamson DH, et al. Optimization of cell receptor-specific targeting through multivalent surface decoration of polymeric nanocarriers. Journal of Controlled Release. 2013;168:41–9. doi: 10.1016/j.jconrel.2013.02.004. [DOI] [PMC free article] [PubMed] [Google Scholar]
- 31.D’Addio SM, Prud’homme RK. Controlling drug nanoparticle formation by rapid precipitation. Adv Drug Deliver Rev. 2011;63:417–26. doi: 10.1016/j.addr.2011.04.005. [DOI] [PubMed] [Google Scholar]
- 32.D’Addio SM, Saad W, Ansell SM, Squiers JJ, Adamson DH, et al. Effects of block copolymer properties on nanocarrier protection from in vivo clearance. Journal of Controlled Release. 2012;162:208–17. doi: 10.1016/j.jconrel.2012.06.020. [DOI] [PMC free article] [PubMed] [Google Scholar]
- 33.Gindy ME, Ji SX, Hoye TR, Panagiotopoulos AZ, Prud’homme RK. Preparation of Poly(ethylene glycol) Protected Nanoparticles with Variable Bioconjugate Ligand Density. Biomacromolecules. 2008;9:2705–11. doi: 10.1021/bm8002013. [DOI] [PubMed] [Google Scholar]
- 34.Lewis DR, Petersen LK, York AW, Zablocki KR, Joseph LB, et al. Sugar-based amphiphilic nanoparticles arrest atherosclerosis in vivo. Proceedings of the National Academy of Sciences of the United States of America. 2015;112:2693–8. doi: 10.1073/pnas.1424594112. [DOI] [PMC free article] [PubMed] [Google Scholar]
- 35.Luo HY, Santos JL, Herrera-Alonso M. Toroidal structures from brush amphiphiles. Chemical Communications. 2014;50:536–8. doi: 10.1039/c3cc46834h. [DOI] [PubMed] [Google Scholar]
- 36.Santos JL, Herrera-Alonso M. Kinetically Arrested Assemblies of Architecturally Distinct Block Copolymers. Macromolecules. 2014;47:137–45. [Google Scholar]
- 37.Kamaly N, Xiao Z, Valencia PM, Radovic-Moreno AF, Farokhzad OC. Targeted polymeric therapeutic nanoparticles: design, development and clinical translation. Chem Soc Rev. 2012;41:2971–3010. doi: 10.1039/c2cs15344k. [DOI] [PMC free article] [PubMed] [Google Scholar]
- 38.Beh CW, Pan D, Lee J, Jiang X, Liu KJ, et al. Direct interrogation of DNA content distribution in nanoparticles by a novel microfluidics-based single-particle analysis. Nano Lett. 2014;14:4729–35. doi: 10.1021/nl5018404. [DOI] [PMC free article] [PubMed] [Google Scholar]
- 39.Han J, Zhu ZX, Qian HT, Wohl AR, Beaman CJ, et al. A simple confined impingement jets mixer for flash nanoprecipitation. Journal of Pharmaceutical Sciences. 2012;101:4018–23. doi: 10.1002/jps.23259. [DOI] [PMC free article] [PubMed] [Google Scholar]
- 40.Zhu ZX. Flash Nanoprecipitation: Prediction and Enhancement of Particle Stability via Drug Structure. Molecular Pharmaceutics. 2014;11:776–86. doi: 10.1021/mp500025e. [DOI] [PMC free article] [PubMed] [Google Scholar]
Associated Data
This section collects any data citations, data availability statements, or supplementary materials included in this article.


