

Abstract
Altered γ-aminobutyric acid (GABA), glutamate (Glu) levels, and an imbalance between GABAergic and glutamatergic neurotransmissions have been involved in the pathophysiology of schizophrenia. However, it remains unclear how these abnormalities impact the onset and course of psychosis. In the present study, 21 drug-naïve subjects at ultrahigh risk for psychosis (UHR), 16 drug-naïve patients with first-episode schizophrenia (FES), and 23 healthy controls (HC) were enrolled. In vivo GABA and glutamate+glutamine (Glx) levels in the medial prefrontal cortex were measured using proton magnetic resonance spectroscopy. Medial prefrontal GABA and Glx levels in FES patients were significantly lower than those in HC and UHR, respectively. GABA and Glx levels in UHR were comparable with those in HC. In each group, there was a positive correlation between GABA and Glx levels. Reduced medial prefrontal GABA and Glx levels thus may play an important role in the early stages of schizophrenia.
1. Introduction
Schizophrenia is a severe psychiatric disorder that affects 1% of the population worldwide; it is characterized by a complex phenotype, including positive, negative, affective symptoms and cognitive impairments [1, 2]. Schizophrenia psychosis usually occurs in late adolescence and early adulthood between ages of 18 and 25, a key period for the maturation of the prefrontal cortex [3]. A recent neurodevelopmental model of schizophrenia has proposed that an imbalance of excitation and inhibition in the prefrontal cortex is involved in the pathophysiology of schizophrenia [4]. Data from human and nonhuman primate brains have provided evidence of N-methyl-D-aspartate (NMDA) receptor hypofunction in schizophrenia, contributing to the excitation of pyramidal neurons indirectly by reducing the activity of inhibitory γ-aminobutyric acid (GABA)ergic interneurons [4]. The activity of GABA interneurons is mediated by NMDA receptors, while glutamate (Glu) serves as a precursor for the synthesis of GABA and glutathione [5–8]. GABA interneurons, in turn, project to pyramidal neurons and influence their excitation [9–11]. Postmodern studies have further shown reduced synapse density in glutamatergic pyramid cells in schizophrenia, linking changes of synaptic plasticity to excitation-inhibition imbalance [4]. Excessive excitatory synaptic pruning in the prefrontal cortex may cause progressive brain tissue loss and lead to the development of psychosis [12]. GABA activity may be decreased in certain brain regions in schizophrenia, which may lead to reduce cortical plasticity and abnormal pruning [13]. Using advanced proton magnetic resonance spectroscopy (1H MRS), neurochemical concentrations such as glutamate and γ-aminobutyric acid can be measured in vivo [12, 14–16]. There is increasing evidence from MRS studies linking glutamatergic or GABAergic disturbances to cognitive deficits and the pathophysiology of schizophrenia [15, 17–21]. Thus, studies on the imbalance between GABAergic and glutamatergic systems should shed light into uncovering the mechanisms of schizophrenia [11, 22].
Aberrant GABAergic or glutamatergic levels in schizophrenia have been separately reported in previous studies [18, 21, 23–31]. Meta-analyses focusing on 1H MRS studies have shown glutamate alterations across several brain regions in schizophrenia [12, 16]. Marsman et al. reported lower Glu and higher glutamine (Gln) levels in the medial frontal cortex in schizophrenia [12]. Merritt et al. further suggested higher glutmate+glutamine (Glx) levels of the medial frontal cortex in subjects at high risk for schizophrenia rather than first-episode or chronic schizophrenia [16]. Higher Glu and Glx levels in the basal ganglia, Gln in the thalamus, and Glx levels in the medial temporal lobe were also found in schizophrenia [16]. Reduced Glx or Glu levels in the medial prefrontal cortex (mPFC) and anterior cingulate cortex (ACC) were observed in several studies on chronic schizophrenia but could not be repeated by other studies [30, 32, 33]. The mixed findings on glutamatergic alterations could be due to the illness progress, severity, duration, or pharmacological treatment [22]. Further studies on the ultrahigh risk for psychosis (UHR) and first-episode schizophrenia (FES), in particular, including drug-naïve subjects, are necessary to exclude the effects of medications.
In vivo GABA measurements have recently become available, aided by newly developed MRS sequences, Meshcher-Garwood point resolved spectroscopy (MEGA-PRESS), and J-Point resolved spectroscopy (JPRESS) [34, 35]. GABA alterations in schizophrenia are also controversial [15, 21, 27, 28, 36–39]. Several studies have reported lower GABA levels in the ACC, bilateral calcarine sulci, and mPFC in chronic schizophrenia [15, 38, 39]. However, unchanged or elevated GABA levels in the ACC and mPFC have also been observed [15, 28, 37, 39]. Evidence of GABA alterations in first-episode schizophrenia remains limited [22]. Three studies on drug-naïve or medicine-free FES patients showed reduced GABA levels in bilateral calcarine sulci and the left basal ganglia [27, 36]. In addition, a recent UHR study showed higher GABA in the dorsal caudate and mPFC [17]. Therefore, more studies on GABA alterations in both drug-naïve UHR and FES are needed.
One possible reason for the controversial findings of either GABA or Glu alterations in schizophrenia could be that these two neurotransmitter systems interact with each other [22, 40–43]. The changes in GABA or Glu in schizophrenia should not be determined separately [44]. Recently, several researchers have begun to examine the correlations between GABA and glutamatergic metabolites [17, 19]. Kegeles et al. found a strong positive correlation between medial prefrontal GABA and Glx levels across chronic schizophrenia and healthy controls (HC) [19]. Similarly, de la Fuente-Sandoval et al. also suggested significant correlations between these two neurotransmitters in both the mPFC and dorsal caudate across UHR and HC [17]. In addition, these correlations could differ among various brain regions in the two groups. For example, UHR subjects had a positive correlation between GABA and Glx levels in the mPFC rather than the caudate, while HC had a positive correlation between GABA and Glx in the caudate rather than the mPFC [17]. These results suggested that correlations between GABA and Glx could be an important feature for dysfunctional GABAergic and glutamatergic neurotransmitters. Thus, more attention should be paid to studies combining the GABA and Glu alterations in both drug-naïve FES patients and UHR subjects. This holds great promise for uncovering the impact of GABA and Glu alterations on the onset and course of psychosis.
In the present study, we recruited drug-naïve UHR subjects, drug-naïve FES patients, and HC subjects and measured both GABA and Glx levels in the mPFC. The mPFC was selected as the region of interest because it has been widely implicated in schizophrenia, including by the postmortem [45] and MRS studies mentioned [17, 19, 46]. We hypothesized that (1) medial prefrontal GABA or Glx levels should change in gradient with illness progression, and these changes would be more prominent in FES patients than in UHR subjects; (2) GABA levels should be correlated with Glx levels in FES and UHR subjects, and the correlations may differ across the three groups.
2. Materials and Methods
2.1. Subjects
2.1.1. UHR Group
Twenty-one UHR individuals were recruited from the outpatients in Shanghai Mental Health Center (SMHC). All UHR subjects met the criteria for at-risk mental state, as defined by the Structured Interview for Prodromal Syndromes (SIPS) and Scale of Prodromal Syndromes (SOPS) [47, 48]. The method for identifying UHR subjects with prodromal symptoms was introduced in detail in our previous study [48]. All UHR subjects were drug-naïve and completed their assessments on the day of their first visit to SMHC. Other inclusion criteria were being between the ages of 16 and 40 years and having at least nine years of education. Exclusion criteria included current pregnancy, major medical or neurological illness, or a history of suicide risk or alcohol or drug abuse. The mean duration of prodromal symptoms in the UHR group was 10.93 ± 16.40 months. Written informed consent was obtained from each UHR subject. Written informed consent was also obtained from his/her legal guardian if the UHR subject was younger than 18 years old.
2.1.2. FES Group
Sixteen FES patients were recruited from SMHC and met the diagnostic criteria for schizophrenia or schizophreniform psychosis based on the Structured Clinical Interview for DSM-IV (patient edition) [49]. These FES patients visited our hospital seeking help for the first time upon being diagnosed with schizophrenia and recruited, and they completed their assessments on the day of their first visit to SMHC. Inclusion criteria for FES patients were having a first-episode illness, no history of exposure to antipsychotics, being between the ages of 16 and 40 years, and having at least nine years of education. Exclusion criteria included a current pregnancy, major medical or neurological illness, or a history of suicide risk or alcohol or drug abuse. Clinical symptoms of each FES patient were assessed using the 24-item Brief Psychiatric Rating Scale (BPRS, expanded version) [50, 51]. The mean duration of psychosis in the FES group was 6.94 ± 6.03 months. Written informed consent was obtained from each FES subject. Written informed consent was also obtained from his/her legal guardian if the FES subject was younger than 18 years old.
2.1.3. HC Group
Twenty-three HCs were recruited by advertisement. All subjects were given the SCID (nonpatient edition) [52]. None had a history of psychiatric illnesses or a family history of mental disorders. Other inclusion criteria were being between the ages of 16 and 40 years and having at least nine years of education. Exclusion criteria included a current pregnancy, major medical or neurological illness, and alcohol or drug abuse. Written informed consent was obtained from each HC subject. Written informed consent was also obtained from his/her legal guardian, if the HC subject was younger than 18 years old.
The study was approved by the Research Ethics Committee of SMHC and in accordance with the Declaration of Helsinki. Handedness was determined by self-report from each participant, and all subjects were right-handed (see Table 1). None of the participants had any contraindication for magnetic resonance imaging (MRI).
Table 1.
Demographic and clinical characteristics among patients with first-episode schizophrenia (FES), subjects at ultrahigh risk for psychosis (UHR), and healthy controls (HC).
| HC | UHR | FES | Statistical significance | |
|---|---|---|---|---|
| Group size | 23 | 21 | 16 | — |
| Age (years) | 22.52 (5.50) | 21.05 (5.69) | 22.13 (5.49) | F(2.57) = 0.40, P = 0.67 |
| Years of education | 11.73 (2.03) | 10.90 (2.17) | 12.31 (2.47) | F(2.57) = 2.00, P = 0.15 |
| Gender (male/female) | 11/12 | 12/9 | 8/8 | χ 2 = 0.41, P = 0.82 |
| Handedness (right/left) | 23/0 | 21/0 | 16/0 | — |
| Tobacco use | 4/23 | 0/21 | 0/16 | χ 2 = 8.14, P = 0.017 |
| SIPS/SOPS | ||||
| Positive | — | 9.10 (3.00) | — | |
| Negative | — | 12.48 (5.33) | — | |
| General | — | 7.67 (2.97) | — | |
| Disorganization | — | 9.29 (3.39) | — | |
| BPRS | ||||
| Positive | — | — | 12.19 (3.75) | |
| Negative | — | — | 8.38 (2.53) | |
| Total | — | — | 43.56 (4.15) |
SIPS/SOPS: Structured Interview for Prodromal Syndromes and Scale of Prodromal Syndromes; BPRS: Brief Psychiatric Rating Scale.
2.2. MRI Acquisition
MRI data were obtained using a 3-Tesla Siemens Verio MR scanner with a 32-channel head coil (Siemens AG, Erlangen, Germany). The head position was fixed with foam padding to minimize movement artifacts.
Anatomical T1-weighted images were acquired using a three-dimensional magnetic preparation fast gradient echo (3D-MRPAGE) sequence with echo time (TE) = 2.96 ms, repetition time (TR) = 2300 ms, field of view (FOV) = 240 × 240 mm2, 256 × 256 matrix, a slice thickness of 1.0 mm, and 192 continuous sagittal slices. The T1-weighted images were used to localize the volume-of-interest (VOI) for the following MRS acquisition. All scans were reviewed by a senior radiologist who evaluated whether there were obvious artifacts, signal losses, or gross pathology.
The MRS data were acquired using a MEGA-PRESS sequence with TR = 1500 ms, TE = 68 ms, and 128 averages with water suppression. The VOI (30 × 30 × 30 mm3) of the mPFC was localized in the midsagittal and coronal slices, as shown in Figure 1. The VOI included Brodmann areas 24 and 32 (containing part of the anterior cingulate cortex). Six orthogonal fat saturation bands were placed surrounding the VOI to avoid signal interference. Automated shimming followed by manual shimming was conducted to reduce the water signal full-width at half maximum (FWHM) below 25 Hz.
Figure 1.

Midsagittal (a) and axial (b) views of the location of the 30 × 30 × 30 mm3 voxel (white square) in the mPFC. (c) Representative MRS spectrum of GABA and Glx fitted by the LCModel from one HC. The blue line is the raw experimental spectrum. The red line is the model-fitting of the experimental spectrum. The black line is the background signal. The peaks of GABA and Glx are shown.
2.3. Spectrum Quantification
MRS raw data were processed using the LCModel software (version 6.3-0I) [53]. Absolute GABA and Glx concentrations were quantified using scaling correction, the correction for relaxation, and partial volume effects based on the LCModel package and LCMgui, respectively. The edited spectra were fit using LCM-basis functions that were generated from phantom measurements using the MEGA-PRESS sequence with the appropriate acquisition parameters [54]. The GABA peak arose at 3.01 ppm and the Glx peak at 3.74 ppm [22]. The criteria for selecting reliable metabolite concentrations were based on the % SD of the fit for each metabolite, reflecting the Cramer–Rao lower bounds (CRLB) for the LCModel analysis [28, 55, 56]. Only the results with the % SD below 20% were included in the following analysis [56]. We obtained high spectral quality, as the % SD of all spectra from the three groups was lower than 15%.
2.4. Tissue Segmentation
To calculate the proportion of grey matter (GM), white matter (WM), and cerebrospinal (CSF) contained in the VOI, the volumetric 3D MPRAGE MRI data were segmented using the SPM8 software. In-house software developed in MATLAB (MathWorks Natick, MA) was then implemented to create a segmentation mask for each voxel, from which the proportions of GM, WM, and CSF were calculated. To obtain the tissue-composition-corrected metabolite intensities, each metabolite value was corrected for the CSF content of the VOI using the following formula: corrected metabolite level = uncorrected metabolite level/(1 − C), where C is the fractional CSF content of the VOI [30].
2.5. Statistical Analysis
All statistical analyses were conducted using SPSS v.20.0. The normality for the distribution of all independent variables, including age, years of education, and metabolite concentrations, was examined using Kolmogorov-Smirnov tests. Demographic variables, GM, WM, and CSF volumes within the VOI were compared among the three groups using analysis of variance (ANOVA). Chi-squared tests were performed to assess the group effect on gender and handedness. One-way ANOVA with the factor of group (UHR, FES, and HC) was conducted to compare group differences on GABA and Glx levels. Post hoc tests were performed between each two groups with Bonferroni corrections for multiple comparisons (P = 0.017 was the significant threshold level).
3. Results
3.1. Demographic and Clinical Characteristics
Demographic and clinical characteristics for three groups are shown in Table 1. All demographic variables, including age and years of education, were normally distributed. Age, education, gender, and handedness were all matched among the three groups. There was a significant group difference in tobacco use.
3.2. Voxel Tissue Composition, Spectral Quality, and Metabolite Levels
No data were discarded due to poor quality. These three groups did not differ in their signal-to-noise ratio (SNR) (P = 0.65) and FWHM (P = 0.97) from the LCModel. No between-group differences were found in the proportion of GM (P = 0.83), WM (P = 0.85), or CSF (P = 0.81) in the VOI of mPFC (shown in Table 2).
Table 2.
Means (SD) for tissue composition and spectral quality in the mPFC region in first-episode schizophrenia (FES), subjects at ultrahigh risk for psychosis (UHR), and healthy controls (HC).
| Group | Tissue composition | Spectral quality | |||
|---|---|---|---|---|---|
| CSF fraction | GM fraction | WM fraction | FWHM (ppm) | SNR | |
| HC | 0.12 (0.030) | 0.56 (0.032) | 0.32 (0.049) | 0.11 (0.04) | 22.43 (5.13) |
| UHR | 0.12 (0.028) | 0.56 (0.038) | 0.31 (0.046) | 0.11 (0.03) | 21.90 (4.29) |
| FES | 0.11 (0.027) | 0.56 (0.040) | 0.32 (0.047) | 0.11 (0.02) | 20.81 (3.12) |
GM: grey matter; WM: white matter; CSF: cerebrospinal fluid; FWHM: full-width at half maximum; SNR: signal-to-noise ratios.
There were significant main group effects on both GABA (P = 0.002) and Glx (P < 0.001) levels. Post hoc tests demonstrated significantly lower GABA levels in FES patients (2.27 ± 0.56 mmol/l) than HC (3.04 ± 0.69 mmol/l, P = 0.003) and UHR participants (2.96 ± 0.75 mmol/l, P = 0.01). Post hoc tests also revealed significantly lower Glx levels in FES patients (12.75 ± 2.66 mmol/l) compared with HC (16.57 ± 3.17 mmol/l, P < 0.001) and UHR subjects (16.37 ± 2.56 mmol/l, P = 0.001). However, both GABA and Glx levels in UHR subjects were comparable with HC subjects (P = 1.00 for GABA, P = 1.00 for Glx) (shown in Figure 2). Removing the four smoking HC subjects did not change the presence or absence of statistical significance.
Figure 2.

Absolute concentrations of GABA (a) and Glx (b) among FES patients and UHR and HC subjects. Lower GABA and Glx concentrations were observed in FES patients than UHR and HC subjects (∗ for P < 0.05 and ∗∗ for P < 0.01).
There were positive correlations between GABA and Glx levels in each group (r = 0.53, P = 0.009 for HC; r = 0.56, P = 0.008 for UHR; r = 0.79, P < 0.001 for FES), as shown in Figure 3. Further direct comparison of the correlation coefficients with z-transformation between the three groups did not indicate any significant differences (z = −1.35, P = 0.18 for HC versus FES; z = 0.13, P = 0.89 for HC versus UHR; z = −1.21, P = 0.23 for UHR versus FES). In addition, the Glx/GABA ratio did not indicate a significant main group effect (F = 0.11, P = 0.90; 5.63 ± 1.21 for HC, 5.79 ± 1.24 for UHR; 5.73 ± 0.88 for FES).
Figure 3.
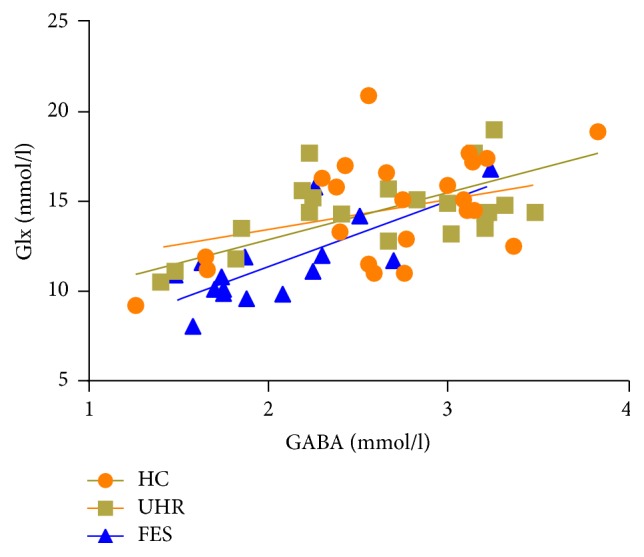
Scatter plots with linear regression fit for the relationship between GABA and glutamate+glutamine (Glx) levels among patients with first-episode schizophrenia (FES, r = 0.79, P < 0.001), subjects at ultrahigh risk for psychosis (UHR, r = 0.56, P = 0.008), and healthy controls (HC, r = 0.53, P = 0.009).
4. Discussion
The present study measured both GABA and Glx concentrations among drug-naïve UHR subjects, drug-naïve FES patients, and HC subjects. Significantly lower GABA and Glx levels in the mPFC were observed in drug-naïve FES patients than UHR or HC subjects, while GABA and Glx levels in UHR subjects were comparable with HC subjects. In addition, GABA and Glx levels were positively correlated within each group. Our findings, which are not confounded by medications, suggested that reduced GABA and Glx levels should play an important role in the early stages of psychosis.
Reduced medial prefrontal GABA concentration in FES patients indicates the existence of a dysfunctional GABA neurotransmitter system in the early stages of schizophrenia. In vivo measurements of GABA concentrations have recently become available by advanced MRS sequences [34]. However, findings showing GABA alterations in FES patients are relatively limited and less consistent [27, 36]. Kelemen et al. found lower GABA/Cr levels in the bilateral calcarine sulci in drug-naïve FES patients [27]. The GABA reduction remained after taking antipsychotic medication for eight weeks [27]. Lower GABA/Cr ratios were also found in the left basal ganglia in early-onset FES and remained after six months of treatment with antipsychotic medications in another study [36]. However, unchanged GABA/Cr ratios have been revealed in both the frontal lobe and parietooccipital lobe [36]. All these results suggest that alterations in GABA levels are related to the onset of schizophrenia but depend on the specific brain region and medication [27, 36]. Our findings demonstrating reduced medial prefrontal GABA levels in drug-naïve FES patients provide more evidence that GABA alterations have an important impact on the early stages of psychosis.
Deficits in the GABA neurotransmitter system in schizophrenia have also been proven by postmortem and electrophysiological studies [57–59]. Postmortem studies have demonstrated GABA deficits in a subclass of fast-spiking interneurons expressing Ca2+-binding protein parvalbumin in patients with schizophrenia [60]. Reduced message RNA and expression of GAD67 (the synthetic enzyme for GABA) and GAT1 (the transporter that clears synaptic GABA) [58] as well as an apparent compensatory upregulation in postsynaptic GABAA receptors in the dorsolateral prefrontal cortex [57, 61], ACC [58], and prefrontal cortex [45, 59, 62] have also been reported in chronic patients with schizophrenia. Electrophysiological studies have provided more evidence for the dysfunctional action of GABAergic transmission in schizophrenia reflected by deficits in gamma oscillation, P50, and the cortical inhibition index [63–67]. Attenuated gamma oscillation has been observed in FES patients [66]. Reduced auditory P50 suppression has reflected disrupted inhibitory gating of the brain in response to repeated auditory stimuli in drug-naïve FES patients [63, 65]. FES patients showed reduced short-interval cortical inhibition (SICI) and a prolonged cortical silence period (CSP) compared with healthy control subjects, suggesting weakened GABAA-mediated inhibition [64, 66]. All these findings further support the hypothesis that dysfunctional GABAergic transmission exists in FES patients [63–67].
In the present study, low medial prefrontal GABA levels were only observed in FES patients not in UHR subjects. A positron emission tomography (PET) study demonstrated the reduced binding potential of GABAA/benzodiazepine receptors in the right caudate in UHR individuals [68]. A recent MRS study indicated an elevated GABA/water ratio in the mPFC in UHR subjects [17]. In our previous study, we found that GABAB-mediated cortical inhibition was impaired in UHR, whereas GABAA-mediated cortical inhibition was not altered yet [69]. Whether GABA dysfunction has occurred before the onset of psychosis remains unclear. There was interplay between two GABA-mediated neurotransmitter systems (GABAA-mediated and GABAB-mediated ones) [70, 71]. Thus, there might be a compensatory effect between two GABA subsystems, leading to GABA deficits in FES patients rather than UHR subjects [64, 69]. Previous studies indicated that FES patients showed a reduced SICI and a prolonged duration of CSP, implying both GABAA and GABAB dysfunction, whereas UHR subjects only had a reduced SICI or prolonged duration of CSP, suggesting partially impaired GABA functions [64, 69]. Thus, medial prefrontal GABA reductions could be a candidate biomarker for the early stages of psychosis.
In addition, we found significant correlations between Glx and GABA levels in FES patients, in accordance with previous studies [17, 19]. Kegeles et al. reported a positive correlation between GABA and Glx levels in the mPFC in medicated and unmedicated patients with schizophrenia and HC subjects [19]. de la Fuente-sandoval et al. found a positive correlation between GABA and Glx levels across UHR and HC subjects [17]. Glu serves as a precursor for the synthesis of GABA and glutathione [5–8]. We hypothesized that the reduction of GABA levels might be secondary to a reduction in the glutamatergic system. There was also a significant correlation between GABA and Glx levels in UHR subjects, and both metabolites remained unchanged. Natsubori et al. also reported unchanged mPFC Glx levels in UHR subjects [30]. These findings suggest that the interplay of GABA and Glx systems might act in a mutually compensatory manner. Both impaired GABAergic and glutamatergic systems may contribute to the development of psychosis [25, 27].
There are limitations of the present study; thus, we should be cautious when interpreting our results. First, MRS data were only acquired in one region (mPFC), which made our results less comparable with previous studies on other regions, for example, the striatum, which will be improved in our further work. Second, we only recruited drug-naïve subjects, which made our sample size for each group relatively small. Considering that the heterogeneity of FES patients and UHR subjects may affect metabolic levels, further studies with a large sample size will be helpful in confirming our findings.
5. Conclusions
In summary, we found both reduced medial prefrontal GABA and Glx concentrations only in drug-naïve FES patients but not in drug-naïve UHR subjects, suggesting that GABA and Glx alterations may be associated with the early stages of psychosis.
Acknowledgments
This work was supported by grants from the National Natural Science Foundation of China (81201043, 81171267, 81171280, 81261120410, 81361120403, and 81471359), Shanghai Science and Technology Committee (15411967200, 14411961400, 134119b0300, 15ZR1435500, 14411963400, and 16XD1402400), National Key Clinical Disciplines at Shanghai Mental Health Center (OMA-MH, 2011-873), Shanghai Key Laboratory of Psychotic Disorders (13dz2260500), Shanghai Jiao Tong University Foundation (14JCRY04, YG2014MS40), SHSMU-ION Research Center for Brain Disorders (2015NKX001, 15ZH2015), Shanghai Health System Advanced Appropriate Technology (2013SY003), and The Medicine Engineering Intersection Program of Shanghai Jiaotong University (YG2015ZD12), Research Grant from Shanghai Hospital Development Center (SHDC12014111), Shanghai Mental Health Center (2014-FX-01, 2013-YJGJ-05, and 2013-YJTSZK-05), and Program of Shanghai Academic/Technology Research Leader (16XD1402400).
Disclosure
Yingying Tang is the co-first author and co-correspondence author.
Competing Interests
The authors report no competing interests related to this manuscript.
Authors' Contributions
Junjie Wang and Yingying Tang contributed equally to this work.
References
- 1.Ross C. A., Margolis R. L., Reading S. A. J., Pletnikov M., Coyle J. T. Neurobiology of Schizophrenia. Neuron. 2006;52(1):139–153. doi: 10.1016/j.neuron.2006.09.015. [DOI] [PubMed] [Google Scholar]
- 2.Freedman R. Schizophrenia. The New England Journal of Medicine. 2003;349(18):1738–1749. doi: 10.1056/nejmra035458. [DOI] [PubMed] [Google Scholar]
- 3.Insel T. R. Rethinking schizophrenia. Nature. 2010;468(7321):187–193. doi: 10.1038/nature09552. [DOI] [PubMed] [Google Scholar]
- 4.Cannon T. D. How schizophrenia develops: cognitive and brain mechanisms underlying onset of psychosis. Trends in Cognitive Sciences. 2015;19(12):744–756. doi: 10.1016/j.tics.2015.09.009. [DOI] [PMC free article] [PubMed] [Google Scholar]
- 5.Brosnan J. T., Brosnan M. E. Glutamate: a truly functional amino acid. Amino Acids. 2013;45(3):413–418. doi: 10.1007/s00726-012-1280-4. [DOI] [PubMed] [Google Scholar]
- 6.Duarte J. M. N., Gruetter R. Glutamatergic and GABAergic energy metabolism measured in the rat brain by 13C NMR spectroscopy at 14.1 T. Journal of Neurochemistry. 2013;126(5):579–590. doi: 10.1111/jnc.12333. [DOI] [PubMed] [Google Scholar]
- 7.Mathews G. C., Diamond J. S. Neuronal glutamate uptake contributes to GABA synthesis and inhibitory synaptic strength. Journal of Neuroscience. 2003;23(6):2040–2048. doi: 10.1523/JNEUROSCI.23-06-02040.2003. [DOI] [PMC free article] [PubMed] [Google Scholar]
- 8.Wu G., Fang Y.-Z., Yang S., Lupton J. R., Turner N. D. Glutathione Metabolism and Its Implications for Health. Journal of Nutrition. 2004;134(3):489–492. doi: 10.1093/jn/134.3.489. [DOI] [PubMed] [Google Scholar]
- 9.Brunel N., Wang X.-J. What determines the frequency of fast network oscillations with irregular neural discharges? I. Synaptic dynamics and excitation-inhibition balance. Journal of Neurophysiology. 2003;90(1):415–430. doi: 10.1152/jn.01095.2002. [DOI] [PubMed] [Google Scholar]
- 10.Buzsáki G., Kaila K., Raichle M. Inhibition and brain work. Neuron. 2007;56(5):771–783. doi: 10.1016/j.neuron.2007.11.008. [DOI] [PMC free article] [PubMed] [Google Scholar]
- 11.Kohn A., Whitsel B. L. Sensory cortical dynamics. Behavioural Brain Research. 2002;135(1-2):119–126. doi: 10.1016/S0166-4328(02)00139-0. [DOI] [PubMed] [Google Scholar]
- 12.Marsman A., van den Heuvel M. P., Klomp D. W. J., Kahn R. S., Luijten P. R., Hulshoff Pol H. E. Glutamate in schizophrenia: a focused review and meta-analysis of 1H-MRS studies. Schizophrenia Bulletin. 2013;39(1):120–129. doi: 10.1093/schbul/sbr069. [DOI] [PMC free article] [PubMed] [Google Scholar]
- 13.Keshavan M. S., Mehta U. M., Padmanabhan J. L., Shah J. L. Dysplasticity, metaplasticity, and schizophrenia: implications for risk, illness, and novel interventions. Development and Psychopathology. 2015;27(2):615–635. doi: 10.1017/s095457941500019x. [DOI] [PMC free article] [PubMed] [Google Scholar]
- 14.Mullins P. G., McGonigle D. J., O'Gorman R. L., et al. Current practice in the use of MEGA-PRESS spectroscopy for the detection of GABA. NeuroImage. 2014;86:43–52. doi: 10.1016/j.neuroimage.2012.12.004. [DOI] [PMC free article] [PubMed] [Google Scholar]
- 15.Rowland L. M., Kontson K., West J., et al. In vivo measurements of glutamate, GABA, and NAAG in schizophrenia. Schizophrenia Bulletin. 2013;39(5):1096–1104. doi: 10.1093/schbul/sbs092. [DOI] [PMC free article] [PubMed] [Google Scholar]
- 16.Merritt K., Egerton A., Kempton M. J., Taylor M. J., McGuire P. K. Nature of Glutamate Alterations in Schizophrenia: a meta-analysis of Proton Magnetic Resonance Spectroscopy Studies. JAMA Psychiatry. 2016;73(7):665–674. doi: 10.1001/jamapsychiatry.2016.0442. [DOI] [PubMed] [Google Scholar]
- 17.de la Fuente-Sandoval C., Reyes-Madrigal F., Mao X., et al. Cortico-striatal GABAergic and glutamatergic dysregulations in subjects at ultra-high risk for psychosis investigated with proton magnetic resonance spectroscopy. International Journal of Neuropsychopharmacology. 2016;19(3):1–10. doi: 10.1093/ijnp/pyv105. [DOI] [PMC free article] [PubMed] [Google Scholar]
- 18.Egerton A., Brugger S., Raffin M., et al. Anterior cingulate glutamate levels related to clinical status following treatment in first-episode schizophrenia. Neuropsychopharmacology. 2012;37(11):2515–2521. doi: 10.1038/npp.2012.113. [DOI] [PMC free article] [PubMed] [Google Scholar]
- 19.Kegeles L. S., Mao X., Stanford A. D., et al. Elevated prefrontal cortex γ-aminobutyric acid and glutamate-glutamine levels in schizophrenia measured in vivo with proton magnetic resonance spectroscopy. Archives of General Psychiatry. 2012;69(5):449–459. doi: 10.1001/archgenpsychiatry.2011.1519. [DOI] [PubMed] [Google Scholar]
- 20.Reid M. A., Stoeckel L. E., White D. M., et al. Assessments of function and biochemistry of the anterior cingulate cortex in schizophrenia. Biological Psychiatry. 2010;68(7):625–633. doi: 10.1016/j.biopsych.2010.04.013. [DOI] [PMC free article] [PubMed] [Google Scholar]
- 21.Rowland L. M., Krause B. W., Wijtenburg S. A., et al. Medial frontal GABA is lower in older schizophrenia: a MEGA-PRESS with macromolecule suppression study. Molecular Psychiatry. 2016;21(2):198–204. doi: 10.1038/mp.2015.34. [DOI] [PMC free article] [PubMed] [Google Scholar]
- 22.Wijtenburg S. A., Yang S., Fischer B. A., Rowland L. M. In vivo assessment of neurotransmitters and modulators with magnetic resonance spectroscopy: application to schizophrenia. Neuroscience and Biobehavioral Reviews. 2015;51:276–295. doi: 10.1016/j.neubiorev.2015.01.007. [DOI] [PMC free article] [PubMed] [Google Scholar]
- 23.Aoyama N., Théberge J., Drost D. J., et al. Grey matter and social functioning correlates of glutamatergic metabolite loss in schizophrenia. The British Journal of Psychiatry. 2011;198(6):448–456. doi: 10.1192/bjp.bp.110.079608. [DOI] [PubMed] [Google Scholar]
- 24.Chang L., Friedman J., Ernst T., Zhong K., Tsopelas N. D., Davis K. Brain Metabolite Abnormalities in the White Matter of Elderly Schizophrenic Subjects: implication for Glial Dysfunction. Biological Psychiatry. 2007;62(12):1396–1404. doi: 10.1016/j.biopsych.2007.05.025. [DOI] [PMC free article] [PubMed] [Google Scholar]
- 25.de la Fuente-Sandoval C., León-Ortiz P., Azcárraga M., et al. Glutamate levels in the associative striatum before and after 4 weeks of antipsychotic treatment in first-episode psychosis: a longitudinal proton magnetic resonance spectroscopy study. JAMA Psychiatry. 2013;70(10):1057–1066. doi: 10.1001/jamapsychiatry.2013.289. [DOI] [PMC free article] [PubMed] [Google Scholar]
- 26.Fuente-Sandoval C. D. L., León-Ortiz P., Favila R., et al. Higher levels of glutamate in the associative-striatum of subjects with prodromal symptoms of schizophrenia and patients with first-episode psychosis. Neuropsychopharmacology. 2011;36(9):1781–1791. doi: 10.1038/npp.2011.65. [DOI] [PMC free article] [PubMed] [Google Scholar]
- 27.Kelemen O., Kiss I., Benedek G., Kéri S. Perceptual and cognitive effects of antipsychotics in first-episode schizophrenia: the potential impact of GABA concentration in the visual cortex. Progress in Neuro-Psychopharmacology and Biological Psychiatry. 2013;47:13–19. doi: 10.1016/j.pnpbp.2013.07.024. [DOI] [PubMed] [Google Scholar]
- 28.Tayoshi S., Nakataki M., Sumitani S., et al. GABA concentration in schizophrenia patients and the effects of antipsychotic medication: A Proton Magnetic Resonance Spectroscopy study. Schizophrenia Research. 2010;117(1):83–91. doi: 10.1016/j.schres.2009.11.011. [DOI] [PubMed] [Google Scholar]
- 29.Kraguljac N. V., Reid M. A., White D. M., Den Hollander J., Lahti A. C. Regional decoupling of n-acetyl-aspartate and glutamate in schizophrenia. Neuropsychopharmacology. 2012;37(12):2635–2642. doi: 10.1038/npp.2012.126. [DOI] [PMC free article] [PubMed] [Google Scholar]
- 30.Natsubori T., Inoue H., Abe O., et al. Reduced frontal glutamate + glutamine and N-acetylaspartate levels in patients with chronic schizophrenia but not in those at clinical high risk for psychosis or with first-episode schizophrenia. Schizophrenia Bulletin. 2014;40(5):1128–1139. doi: 10.1093/schbul/sbt124. [DOI] [PMC free article] [PubMed] [Google Scholar]
- 31.Tibbo P., Hanstock C., Valiakalayil A., Allen P. 3-T Proton MRS investigation of glutamate and glutamine in adolescents at high genetic risk for schizophrenia. American Journal of Psychiatry. 2004;161(6):1116–1118. doi: 10.1176/appi.ajp.161.6.1116. [DOI] [PubMed] [Google Scholar]
- 32.Lutkenhoff E. S., Van Erp T. G., Thomas M. A., et al. Proton MRS in twin pairs discordant for schizophrenia. Molecular Psychiatry. 2010;15(3):308–318. doi: 10.1038/mp.2008.87. [DOI] [PubMed] [Google Scholar]
- 33.Tayoshi S., Sumitani S., Taniguchi K., et al. Metabolite changes and gender differences in schizophrenia using 3-Tesla proton magnetic resonance spectroscopy (1H-MRS) Schizophrenia Research. 2009;108(1-3):69–77. doi: 10.1016/j.schres.2008.11.014. [DOI] [PubMed] [Google Scholar]
- 34.Mescher M., Merkle H., Kirsch J., Garwood M., Gruetter R. Simultaneous in vivo spectral editing and water suppression. NMR in Biomedicine. 1998;11(6):266–272. doi: 10.1002/(sici)1099-1492(199810)11:6<266::aid-nbm530>3.0.co;2-j. [DOI] [PubMed] [Google Scholar]
- 35.Ryner L. N., Sorenson J. A., Thomas M. A. Localized 2D J-resolved 1H MR spectroscopy: strong coupling effects in vitro and in vivo. Magnetic Resonance Imaging. 1995;13(6):853–869. doi: 10.1016/0730-725x(95)00031-b. [DOI] [PubMed] [Google Scholar]
- 36.Goto N., Yoshimura R., Kakeda S., et al. No alterations of brain GABA after 6 months of treatment with atypical antipsychotic drugs in early-stage first-episode schizophrenia. Progress in Neuro-Psychopharmacology and Biological Psychiatry. 2010;34(8):1480–1483. doi: 10.1016/j.pnpbp.2010.08.007. [DOI] [PubMed] [Google Scholar]
- 37.Öngür D., Prescot A. P., McCarthy J., Cohen B. M., Renshaw P. F. Elevated gamma-aminobutyric acid levels in chronic schizophrenia. Biological Psychiatry. 2010;68(7):667–670. doi: 10.1016/j.biopsych.2010.05.016. [DOI] [PMC free article] [PubMed] [Google Scholar]
- 38.Yoon J. H., Maddock R. J., Rokem A., et al. GABA concentration is reduced in visual cortex in schizophrenia and correlates with orientation-specific surround suppression. Journal of Neuroscience. 2010;30(10):3777–3781. doi: 10.1523/JNEUROSCI.6158-09.2010. [DOI] [PMC free article] [PubMed] [Google Scholar]
- 39.Marsman A., Mandl R. C. W., Klomp D. W. J., et al. GABA and glutamate in schizophrenia: a 7 T 1H-MRS study. NeuroImage: Clinical. 2014;6:398–407. doi: 10.1016/j.nicl.2014.10.005. [DOI] [PMC free article] [PubMed] [Google Scholar]
- 40.Kahn R. S., Sommer I. E. The neurobiology and treatment of first-episode schizophrenia. Molecular Psychiatry. 2015;20(1):84–97. doi: 10.1038/mp.2014.66. [DOI] [PMC free article] [PubMed] [Google Scholar]
- 41.Lally N., Mullins P. G., Roberts M. V., Price D., Gruber T., Haenschel C. Glutamatergic correlates of gamma-band oscillatory activity during cognition: a concurrent ER-MRS and EEG study. NeuroImage. 2014;85:823–833. doi: 10.1016/j.neuroimage.2013.07.049. [DOI] [PubMed] [Google Scholar]
- 42.Owens E. M., Bachman P., Glahn D. C., Bearden C. E. Electrophysiological endophenotypes for schizophrenia. Harvard Review of Psychiatry. 2016;24(2):129–147. doi: 10.1097/hrp.0000000000000110. [DOI] [PMC free article] [PubMed] [Google Scholar]
- 43.Gonzalez-Burgos G., Lewis D. A. NMDA receptor hypofunction, parvalbumin-positive neurons, and cortical gamma oscillations in schizophrenia. Schizophrenia Bulletin. 2012;38(5):950–957. doi: 10.1093/schbul/sbs010. [DOI] [PMC free article] [PubMed] [Google Scholar]
- 44.Lewis D. A., Curley A. A., Glausier J. R., Volk D. W. Cortical parvalbumin interneurons and cognitive dysfunction in schizophrenia. Trends in Neurosciences. 2012;35(1):57–67. doi: 10.1016/j.tins.2011.10.004. [DOI] [PMC free article] [PubMed] [Google Scholar]
- 45.Benes F. M., McSparren J., Bird E. D., SanGiovanni J. P., Vincent S. L. Deficits in small interneurons in prefrontal and cingulate cortices of schizophrenic and schizoaffective patients. Archives of General Psychiatry. 1991;48(11):996–1001. doi: 10.1001/archpsyc.1991.01810350036005. [DOI] [PubMed] [Google Scholar]
- 46.Théberge J., Bartha R., Drost D. J., et al. Glutamate and glutamine measured with 4.0 T proton MRS in never-treated patients with schizophrenia and healthy volunteers. The American Journal of Psychiatry. 2002;159(11):1944–1946. doi: 10.1176/appi.ajp.159.11.1944. [DOI] [PubMed] [Google Scholar]
- 47.Miller T. J., McGlashan T. H., Rosen J. L., et al. Prodromal assessment with the structured interview for prodromal syndromes and the scale of prodromal symptoms: predictive validity, interrater reliability, and training to reliability. Schizophrenia Bulletin. 2003;29(4):703–715. doi: 10.1093/oxfordjournals.schbul.a007040. [DOI] [PubMed] [Google Scholar]
- 48.Zhang T., Li H., Woodberry K. A., et al. Prodromal psychosis detection in a counseling center population in China: an epidemiological and clinical study. Schizophrenia Research. 2014;152(2-3):391–399. doi: 10.1016/j.schres.2013.11.039. [DOI] [PMC free article] [PubMed] [Google Scholar]
- 49.First M. B. Structured Clinical Interview For DSM-IV (SCID-I/SCID-II) New York, NY, USA: Springer; 1995. (The Encyclopedia of Clinical Psychology). [Google Scholar]
- 50.Lukoff D., Nuechterlein K. H., Ventura J. Manual for the expanded brief psychiatric rating scale. Schizophrenia Bulletin. 1986;12:594–602. [Google Scholar]
- 51.Ventura J., Green M. F., Shaner A., Liberman R. P. Training and quality assurance with the Brief Psychiatric Rating Scale: ‘The drift busters’. International Journal of Methods in Psychiatric Research. 1993;3(4):221–244. [Google Scholar]
- 52.Spitzer R. L., Williams J. B. W., Gibbon M., First M. B. User's Guide for the Structured Clinical Interview for DSM-III-R: SCID. Arlington, Va, USA: American Psychiatric Association; 1990. [Google Scholar]
- 53.Provencher S. W. Estimation of metabolite concentrations from localized in vivo proton NMR spectra. Magnetic Resonance in Medicine. 1993;30(6):672–679. doi: 10.1002/mrm.1910300604. [DOI] [PubMed] [Google Scholar]
- 54.Goto N., Yoshimura R., Kakeda S., et al. Six-month treatment with atypical antipsychotic drugs decreased frontal-lobe levels of glutamate plus glutamine in early-stage first-episode schizophrenia. Neuropsychiatric Disease and Treatment. 2012;8:119–122. doi: 10.2147/NDT.S25582. [DOI] [PMC free article] [PubMed] [Google Scholar]
- 55.Cavassila S., Deval S., Huegen C., Van Ormondt D., Graveron-Demilly D. Cramér-Rao bounds: an evaluation tool for quantitation. NMR in Biomedicine. 2001;14(4):278–283. doi: 10.1002/nbm.701. [DOI] [PubMed] [Google Scholar]
- 56.Provencher S. W. LCModel & LCMgui User's Manual. http://s-provencher.com/pub/LCModel/manual/manual.pdf.
- 57.Lewis D. A., Hashimoto T., Volk D. W. Cortical inhibitory neurons and schizophrenia. Nature Reviews Neuroscience. 2005;6(4):312–324. doi: 10.1038/nrn1648. [DOI] [PubMed] [Google Scholar]
- 58.Benes F. M., Vincent S. L., Alsterberg G., Bird E. D., SanGiovanni J. P. Increased GABAA receptor binding in superficial layers of cingulate cortex in schizophrenics. The Journal of Neuroscience. 1992;12(3):924–929. doi: 10.1523/JNEUROSCI.12-03-00924.1992. [DOI] [PMC free article] [PubMed] [Google Scholar]
- 59.Benes F. M., Vincent S. L., Marie A., Khan Y. Up-regulation of GABAA receptor binding on neurons of the prefrontal cortex in schizophrenic subjects. Neuroscience. 1996;75(4):1021–1031. doi: 10.1016/0306-4522(96)00328-4. [DOI] [PubMed] [Google Scholar]
- 60.Hashimoto T., Volk D. W., Eggan S. M., et al. Gene expression deficits in a subclass of GABA neurons in the prefrontal cortex of subjects with schizophrenia. The Journal of Neuroscience. 2003;23(15):6315–6326. doi: 10.1523/JNEUROSCI.23-15-06315.2003. [DOI] [PMC free article] [PubMed] [Google Scholar]
- 61.Fung S. J., Webster M. J., Sivagnanasundaram S., Duncan C., Elashoff M., Weickert C. S. Expression of interneuron markers in the dorsolateral prefrontal cortex of the developing human and in schizophrenia. The American Journal of Psychiatry. 2010;167(12):1479–1488. doi: 10.1176/appi.ajp.2010.09060784. [DOI] [PubMed] [Google Scholar]
- 62.Ishikawa M., Mizukami K., Iwakiri M., Hidaka S., Asada T. Immunohistochemical and immunoblot study of GABAA α1 and β2/3 subunits in the prefrontal cortex of subjects with schizophrenia and bipolar disorder. Neuroscience Research. 2004;50(1):77–84. doi: 10.1016/j.neures.2004.06.006. [DOI] [PubMed] [Google Scholar]
- 63.Brockhaus-Dumke A., Schultze-Lutter F., Mueller R., et al. Sensory gating in schizophrenia: P50 and N100 gating in antipsychotic-free subjects at risk, first-episode, and chronic patients. Biological Psychiatry. 2008;64(5):376–384. doi: 10.1016/j.biopsych.2008.02.006. [DOI] [PubMed] [Google Scholar]
- 64.Hasan A., Wobrock T., Grefkes C., et al. Deficient inhibitory cortical networks in antipsychotic-naive subjects at risk of developing first-episode psychosis and first-episode schizophrenia patients: a cross-sectional study. Biological Psychiatry. 2012;72(9):744–751. doi: 10.1016/j.biopsych.2012.03.005. [DOI] [PubMed] [Google Scholar]
- 65.Hong X., Chan R. C. K., Zhuang X., et al. Neuroleptic effects on P50 sensory gating in patients with first-episode never-medicated schizophrenia. Schizophrenia Research. 2009;108(1-3):151–157. doi: 10.1016/j.schres.2008.11.016. [DOI] [PubMed] [Google Scholar]
- 66.Symond M. B., Harris A. W. F., Gordon E., Williams L. M. ‘Gamma synchrony’ in first-episode schizophrenia: a disorder of temporal connectivity? The American Journal of Psychiatry. 2005;162(3):459–465. doi: 10.1176/appi.ajp.162.3.459. [DOI] [PubMed] [Google Scholar]
- 67.Wobrock T., Schneider M., Kadovic D., et al. Reduced cortical inhibition in first-episode schizophrenia. Schizophrenia Research. 2008;105(1-3):252–261. doi: 10.1016/j.schres.2008.06.001. [DOI] [PubMed] [Google Scholar]
- 68.Kang J. I., Park H.-J., Kim S. J., et al. Reduced binding potential of GABA-A/benzodiazepine receptors in individuals at ultra-high risk for psychosis: an [18F]-fluoroflumazenil positron Emission Tomography Study. Schizophrenia Bulletin. 2013;40(3):548–557. doi: 10.1093/schbul/sbt052. [DOI] [PMC free article] [PubMed] [Google Scholar]
- 69.Tang Y., Zhang T., Edelman B., et al. Prolonged cortical silent period among drug-naive subjects at ultra-high risk of psychosis. Schizophrenia Research. 2014;160(1–3):124–130. doi: 10.1016/j.schres.2014.10.004. [DOI] [PubMed] [Google Scholar]
- 70.Hasan A., Falkai P., Wobrock T. Transcranial brain stimulation in schizophrenia: targeting cortical excitability, connectivity and plasticity. Current Medicinal Chemistry. 2013;20(3):405–413. [PubMed] [Google Scholar]
- 71.Wu C., Sun D. GABA receptors in brain development, function, and injury. Metabolic Brain Disease. 2015;30(2):367–379. doi: 10.1007/s11011-014-9560-1. [DOI] [PMC free article] [PubMed] [Google Scholar]