

Abstract
Several primate models indicate that cytotoxic T lymphocyte-inducing vaccines may be unable to prevent human immunodeficiency virus infection but may have a long-term benefit in controlling viral replication and delaying disease progression. Here we show that analysis of the kinetics of antigen-specific CD8+ T-cell expansion suggests a delay in activation following infection that allows unimpeded early viral replication. Viral kinetics do not differ between controls and vaccinees during this delay phase. An increase in virus-specific CD8+ T-cell numbers around day 10 postinfection coincides with a slowing in viral replication in vaccinees and reduces peak viral loads by around 1 log. However, this response is too little too late to prevent establishment of persistent infection.
The results of human immunodeficiency virus (HIV) vaccine trials in animal models have been both encouraging and disappointing. In most cases in which a vaccine effect has been observed, vaccination has been unable to prevent the establishment of chronic infection (49). However, several vaccines that induce CD8+ T-cell responses to virus have proved capable of blunting peak viral loads in acute infection and prolonging survival by reducing viral loads and preserving CD4+ T-cell counts during the stage of chronic infection (3, 7, 12, 16, 50) (although early reduction in viral growth does not always lead to long-term control) (22). The long-term outcome of low-level chronic infection is unclear, but vaccinated monkeys had significantly increased survival compared to unvaccinated controls, and human studies suggest that lower HIV viral loads are associated with increased survival (35). Thus, it seems that although “sterilizing immunity” may be difficult to achieve, disease-attenuating vaccines may be possible. Investigating why chronic infection can be controlled by vaccination while acute infection cannot be prevented is key to understanding and guiding the development of this new generation of vaccines.
Virus-specific CD8+ T lymphocytes are thought to play a dominant role in the control of viral replication in both acute and chronic HIV infection. The importance of CD8+ T cells in the control of HIV and simian immunodeficiency virus (SIV) infection is suggested by several lines of evidence: (i) the decline in virus levels in acute infection coincides with the peak in cytotoxic T lymphocyte (CTL) numbers (10, 28), (ii) depletion of CD8+ T cells leads to an increase in virus (24, 47), (iii) infusion of CTL leads to a reduction in viral load (31), (iv) viral “escape” from CTL recognition leads to an increase in viral load (6, 27, 43), and (v) there appears to be an association between CTL numbers and disease outcome in HIV infection (38).
To investigate the dynamics of CD8+ T-cell responses to infection and the role of virus-specific CD8+ T cells in controlling viral replication following experimental SHIV infection, we performed a kinetic analysis of a previously published gag-env plus interleukin 2 (IL-2) vaccine trial with rhesus macaques (7). Viral loads, CD4+ T-cell counts, and virus-specific CD8+ T-cell numbers were analyzed.
MATERIALS AND METHODS
Vaccination studies.
In the SHIV-89.6P challenge studies (7), rhesus monkeys (Macaca mulatta) were immunized with SIVmac239 Gag and HIV type 1 (HIV-1)-89.6P Env DNA vaccines plus either IL-2-immunoglobulin fusion protein (n = 4) or IL-2-immunoglobulin plasmid (n = 4). The latter two groups were pooled for the purposes of this analysis. Control monkeys (n = 8) were immunized with sham pV1R plasmid. Monkeys were challenged with 100 monkey-infectious doses of cell-free SHIV-89.6P 6 weeks after their final immunization. Four of the control monkeys and all eight of the vaccinees were mamu-A*01 positive. CD8+ T cells specific for the Mamu-A*01-restricted immunodominant SIV Gag p11c epitope (CTPYDINQM) or subdominant HIV-1 Env p41a epitope (YAPPISGQI) were detected using major histocompatibility complex (MHC) class I tetramers and fluorescence-activated cell sorting staining (7, 46).
In the SIVsm E660 challenge studies (16), rhesus monkeys were immunized with an SIV Gag DNA construct (n = 4) and challenged intravenously with 50 50% monkey-infectious doses of SIVsm E660.
Statistical analysis.
Nonparametric tests were used for both unpaired (Mann-Whitney) and paired (Wilcoxon matched pairs) comparisons between groups. Growth and decay rates of virus and virus-specific CD8+ T cells were determined using linear regression of log-transformed data. Decay rates of tetramer-positive cells were also determined using a double exponential decay formula, X = Ae−αt + Be−βt, where X is the number of tetramer-positive T cells, α and β are the decay rates, and A and B are the initial numbers of short- and long-lived cells, respectively.
Estimation of the number of infected cells.
Virus (V) and infected cells quickly establish a quasi-steady state in which the number of productively infected cells (T*) is given by the relationship T* = cV/Nδ, where c represents the clearance rate. The death rate of productively infected cells (δ) has been estimated in macaques as 0.5 to 1 day−1 (39, 51), consistent with decay rates of HIV-infected cells in humans (33). Estimates of the half-life of virus in macaques range from 3.3 to 26 min (23, 56), equivalent to a clearance rate of 38 to 302 day−1—slightly faster than that in humans (recently estimated at 23 day−1) (44). Estimates of the burst size of a productively infected cell (the number of virions produced by an infected cell in its lifetime) (N) in SIV and HIV range widely from 100 (21) to 5 × 10⁴ (H. Yuan Chen, M. Di Mascio, A. Perelson, A. Gettie, D. Ho, and L. Zhang, Abstr. 9th Conf. Retrovir. Opportunistic Infect., abstr. LB3, 2002). Although most of these estimates were not obtained from vaccinated animal studies, we do not believe they are likely to have been altered by vaccination during the first 10 days following SHIV infection, as the viral kinetics observed during this time do not differ from those of unvaccinated animals. In addition, estimates of the viral burst size did not differ between naïve animals and animals that had previously been exposed to virus (Yuan Chen et al., Abstr. 9th Conf. Retrovir. Opportunistic Infect.).
By using the range of estimates for each parameter, we can calculate an upper and a lower bound for the number of infected cells present at a given viral load. The minimum estimate for the number of infected cells would be obtained when δ = 1 day−1, c = 38 day−1, and N = 5 × 10⁴. Thus, assuming a volume of distribution of virus of 500 ml, for a viral load (V) on day 10 of ∼5 × 10⁵ copies ml−1 this calculation predicts that we would need 1.9 × 10⁵ infected cells in the animal to produce this level of virus. Lower values of burst size, for example, would produce higher estimates of the number of infected cells. Thus, when δ = 0.5 day−1, c = 302 day−1, and N = 100, then 1.5 × 10⁹ infected cells would be required to produce a viral load of 5 × 10⁵ copies ml−1 (possibly an unrealistically high estimate). Using the same approach, the minimum number of infected cells present on day 8, when mean viral load in vaccinees was ∼1.3 × 10⁴ copies ml−1, is ∼4.8 × 10³ cells.
RESULTS
Viral kinetics.
Comparison of the kinetics of viral replication in control and vaccinated animals can be used to assess the effects of vaccination in slowing or preventing viral replication. Interestingly, as shown in Fig. 1 and Table 1, up to day 10 following infection, viral loads were not significantly different between vaccinees and controls (mean, 4.3 × 10⁵ versus 1.1 × 10⁶ copies/ml [P = 0.16; Mann-Whitney test]). However, by day 14, viral loads were ∼12-fold lower in vaccinees than in controls (mean, 4.7 × 10⁶ versus 5.8 × 10⁷ copies ml−1 [P = 0.0003]). We also estimated viral replication rates, immediately before and after day 10, by calculating the slope of the viral load increase between days 7 to 10 and days 10 to 14 for individual monkeys. The average viral replication rate between day 7 and 10 in vaccinated monkeys was not significantly different from that seen with control monkeys (mean, 1.8 day−1 versus 1.6 day−1 [P = 0.08]), with a trend towards a faster viral replication in vaccinees. However, between day 10 and 14 viral replication rates were approximately 40% slower in vaccinees than in controls (0.60 day−1 versus 0.99 day−1 [P = 0.007]). Thus, there was no difference in viral kinetics between controls and vaccinees prior to day 10 judged either by viral replication rate over the 3 days prior or by viral loads on day 10, indicating that vaccination had no apparent effect on the early viral kinetics.
FIG. 1.

Outcome of acute SHIV-89.6P infection. Viral load (top panels) and number of p11c+ T cells (bottom panels) are shown for individual monkeys (black lines). (a and b) Mean viral growth rates for control (a) and vaccinated (b) monkeys prior to day 10 (blue lines) and after day 10 (red lines) are shown. Viral clearance rates are shown in green. (c and d) Average p11c+ T-cell expansion rates (blue lines) and double exponential decay results (red lines) for control (c) and vaccinated (d) monkeys are shown.
TABLE 1.
Kinetics of SHIV-89.6P viral loada
| Group and monkey | Viral kinetics
|
||
|---|---|---|---|
| Rise
|
Decay (day−1) | ||
| Day 7-10 (day−1) | Day 10-14 (day−1) | ||
| Controls | |||
| KPB | 1.48 | 0.95 | 0.82 |
| KPE | 1.41 | 0.81 | 0.64 |
| PKT | 1.27 | 1.26 | 0.68 |
| TDE | 1.49 | 1.02 | 0.52 |
| 766 | 1.63 | 0.73 | 0.85 |
| 780 | 1.61 | 0.88 | 0.49 |
| 810 | 1.55 | 0.92 | 0.66 |
| 826 | 2.21 | 1.38 | 0.83 |
| Mean ± SD | 1.58 ± 0.27 | 0.99 ± 0.22 | 0.69 ± 0.14 |
| Vaccinees | |||
| 712 | 1.83 | 0.66 | 0.73 |
| 772 | 1.83 | 0.73 | 0.51 |
| 798 | 2.08 | 0.51 | 0.54 |
| 839 | 1.87 | 0.53 | 0.84 |
| 483 | 1.52 | 0.43 | 0.87 |
| 728 | 1.62 | 0.32 | 0.87 |
| 833 | 1.51 | 0.49 | 0.78 |
| 893 | 1.84 | 1.13 | 0.64 |
| Mean ± SD | 1.76 ± 0.20 | 0.60 ± 0.25* | 0.72 ± 0.14 |
The data for eight control and eight vaccinated monkeys are shown (individual monkeys are identified in the first column). Rates of growth and decay of plasma viral load for individual animals are indicated, as are the means and standard deviations (SD) for groups. P values for differences in results between groups were determined by the Mann-Whitney test. *, P = 0.0078.
Following the peak in viral load at day 14 to 17, viral loads dropped significantly in both vaccinees and controls. Since the clearance rate of virus is much faster than the death rate of infected cells (23, 44, 56), a quasi-steady state is rapidly established in which the viral load is approximately proportional to the number of infected cells (21, 40, 42). Thus, the observed decay rate of virus is a measure of the decay rate of productively infected cells (32, 39). The initial rates of decay of virus following the peak of viremia were not significantly different between controls and vaccinees (0.69 day−1 versus 0.72 day−1).
Antigen-specific CD8+ T cells in HIV infection have traditionally been thought to act primarily through killing of infected CD4+ cells. Therefore, one would expect that since vaccinees had approximately 10-fold-higher numbers of virus-specific CD8+ T cells (Fig. 1), they would kill infected cells faster than controls. The viral kinetic analysis described above suggests that a 10-fold increase in the number of virus-specific CD8+ T cells in vaccinees has no significant effect on the decay rate of infected cells. There are several possible explanations for this that are consistent with the data: (i) virus-specific CD8+ T cells are functionally defective (4), (ii) down regulation of MHC class I or interference with viral peptide presentation prevents CD8+ T-cell recognition of infected cells (9), (iii) viral cytopathic effect leads to more-rapid cell death than CD8+-mediated cytolysis of infected cells, or (iv) killing of infected cells by CTL is higher in vaccinees, but this is balanced by increased infection of new target cells in vaccinees (32, 39)—as vaccinated animals have higher CD4 counts than controls (7).
Expansion of tetramer-positive CD8+ cells.
Although vaccination leads to higher numbers of antigen-specific CD8+ T cells, the question remains whether these cells respond faster than CD8+ T cells in controls. The dominant epitope in the CTL response to SHIV is the p11c epitope in Gag. We performed a kinetic analysis of p11c-specific CD8+ T cells (p11c+ T cells) (Fig. 1c and d; Table 2). Vaccinated animals had detectable p11c+ T cells from day 0 (time of infection), with cell numbers ranging from 0.9 to 8.5 cells μl−1. However, the number of p11c+ T cells in vaccinees did not increase significantly until 10 days after infection, and by day 10 the number had increased only 1.5 (± 0.27)-fold from the day of infection. Thus, there appears to be a prolonged delay before vaccine-induced p11c+ T-cell numbers begin to increase in peripheral blood. The initial expansion in p11c+ T cells on day 10 coincides with the change in viral kinetics between controls and vaccinees and thus may be responsible for the reduced viral load peak in vaccinees.
TABLE 2.
Kinetics of p11c+ CD8+ T cells following SHIV-89.6P infectiona
| Group and monkey | Rate of expansion (day−1) | Peak expansion (peak/day 0)b | Decay rate (day−1)c
|
% Memory (day 42/peak)d | ||
|---|---|---|---|---|---|---|
| Initial | Phase 1 | Phase 2 | ||||
| Controls | ||||||
| KPB | 0.73 | NAe | 0.39 | 0.45 | −0.013 | 11.3 |
| KPE | 1.03 | NA | 0.14 | 0.10 | −0.010 | 9.3 |
| PKT | 0.54 | NA | 0.42 | 0.30 | −0.014 | 3.9 |
| TDE | 0.60 | NA | 0.31 | 0.20 | −0.007 | 8.1 |
| Mean ± SD | 0.73 ± 0.22 | 0.32 ± 0.12 | 0.26 ± 0.15 | −0.011 ± 0.003 | 8.2 ± 3.1 | |
| Vaccinees | ||||||
| 712 | 1.22 | 207 | 0.13 | 0.18 | −0.001 | 15.0 |
| 772 | 0.86 | 78.1 | 0.15 | 0.16 | 0.005 | 11.1 |
| 798 | 0.92 | 50.3 | 0.09 | 0.05 | −0.009 | 30.4 |
| 839 | 0.92 | 74.0 | 0.16 | 0.13 | 0.006 | 17.0 |
| 483 | 0.96 | 52.7 | 0.09 | 0.04 | 0.000 | 36.8 |
| 728 | 1.20 | 212 | 0.17 | 0.19 | 0.002 | 6.8 |
| 833 | 0.93 | 56.5 | 0.21 | 0.78 | 0.011 | 25.1 |
| 893 | 0.51 | 45.4 | 0.14 | 0.10 | 0.006 | 19.9 |
| Mean ± SD | 0.94 ± 0.22 | 97.0 ± 70.4 | 0.14 ± 0.04* | 0.21 ± 0.24 | 0.0025 ± 0.006* | 20.3 ± 10.0* |
The data from the four Mamu-A*01+ control monkeys and eight vaccinated monkeys were used to estimate the rates of expansion and decline of p11c+ T cells; estimates are shown. P values with respect to differences in results between groups were determined. *, P < 0.05.
Peak expansion is calculated from the number of cells at the peak divided by the number at the time of infection (day 0).
Decay rates of p11c+ T cells for individual animals were estimated using a double exponential decay calculation with the results obtained from the peak to day 126 (or day of death).
The percent memory was determined by dividing the number of cells at day 42 by that at the peak.
NA, not available.
Once p11c+ T-cell numbers started to increase, their expansion rate was 0.94 ± 0.22 day−1 (corresponding to a doubling time of nearly 18 h). However, the observed expansion rate of the T-cell population does not necessarily represent the division rate of individual cells but is instead a measure of the net increase in cell numbers with time. Thus, it remains possible either that p11c+ T cells divided every 18 h or that p11c+ T cells divided more rapidly but that this rapid division was accompanied by rapid death and thus that only a slow net expansion was observed. Expansion continued until around day 14 to 17, coinciding with the peak of viremia, and then p11c+ T-cell numbers declined. By contrast, control monkeys first had detectable p11c+ T cells on day 14. If we assume that the number of p11c+ T cells was at the level of detection (0.1% of CD8+ T cells) at the prior measurement, day 10, a minimum expansion rate could be estimated (0.73 ± 0.22 day−1). This minimum rate was slower than but not significantly different from that of vaccinated animals.
A delay in p11c+ T-cell expansion after infection also appears to occur in control animals. If we assume that T-cell expansion occurs in controls at the same rate as in vaccinees, we can extrapolate back to find the time they started dividing. This time would be around day 6 (range, 5.0 to 7.7) if the precursor frequency were 1 in 105 and around day 9 (range, 7.5 to 10.1) if the precursor frequency were 1 in 104. Thus, delayed expansion also appears to occur in control animals, and the latter estimate is consistent with the delay in expansion observed in the vaccinated monkeys.
Decay of tetramer-positive cells.
The rate of decline of p11c+ T cells after their peak was calculated using two methods. First, to determine the initial decay we fitted an exponential decline to the data over the first week following the peak. This early decay was significantly slower in vaccinees than in controls (0.14 ± 0.04 versus 0.32 ± 0.12 day−1 [P = 0.049]), suggesting an extended half-life (t1/2) of the p11c+ T-cell population in vaccinees (average t1/2 of 5.3 days) compared to the results seen with control animals (average t1/2 of 2.7 days). However, since this decay represents the net decay of the p11c+ T-cell population, it is possible either that cells died faster in control animals or that cells died at the same rate in vaccinees and controls but that this death was balanced by increased proliferation of p11c+ T cells in vaccinated animals. Interestingly, the control animal with the slowest initial decay rate had relatively preserved CD4+ T cells and later appeared to control viral growth (monkey KPE; Fig. 1a and Table 2).
To assess the long-term survival of p11c+ T cells, a double exponential model (see Materials and Methods) was fitted to the data up to day 126 or the time of death, with the two decay rates representing short- and long-lived cells. This double exponential decay model gave a significantly better fit than a single exponential decay model (F test [P < 0.05]). Converting the estimated decay rates (Table 2) into half-lives and ignoring negative second-phase half-lives, since in these animals p11c+ expansion may be driven by antigen (see below), we estimate that in vaccinees these half-lives were approximately 3.3 and 156 days, corresponding to the half-lives of effector and memory cells, respectively.
In contrast to vaccinated animals, in control animals the early first-phase decline was followed by a later rise in p11c+ T-cell numbers (in parallel with rising viral loads; Fig. 1). Therefore, fitting of a double exponential model of decay in control animals shows expansion of p11c+ T cells in the second phase. The second-phase results differed between the controls and vaccinees (P = 0.016), with cell numbers decreasing in vaccinees and increasing in controls (Table 2). The rise in p11c+ T-cell numbers in control animals appears to parallel the rise in viral load in these animals (Fig. 1), consistent with the phenomenon of “memory inflation” recently described in murine cytomegalovirus infection in mice (25), but still never reached the levels seen in the vaccinated animals.
To estimate the production of long-lived (memory) cells in controls compared to vaccinees, we also determined the proportion of effector cells present at the peak of the response that persisted into the long-lived memory compartment. Comparing the number of p11c+ T cells at 6 weeks with that at the peak of the response, we found that a significantly larger proportion of cells from vaccinees remained at this time (vaccinees, 20.3 ± 10.0%; controls, 8.2 ± 3.1% [P = 0.049]). Thus, it appears that p11c+ T cells in control animals had a more rapid early decline than in vaccinees and contributed a smaller proportion of cells to the long-lived “memory” population. The increased survival and conversion into memory of p11c+ T cells in vaccinees may contribute to their long-term control of virus.
Kinetics of response to a subdominant epitope.
To confirm that the delay in initiation of expansion of p11c+ T-cell population was not specific to the p11c epitope or the Gag protein, we also analyzed the CD8+ T-cell response to the subdominant Mamu-A*01-restricted HIV-1 Env p41a epitope (YAPPISGQI) (p41a+ T cells) in the same monkeys (46). The low number of cells specific to these epitopes in unvaccinated monkeys precluded kinetic analysis in the control animals. In vaccinated monkeys the number of p41a+ T cells was not significantly raised compared to the results seen at day 0 until day 14. The maximum expansion rate of p41a+ T cells in vaccinees (estimated from the largest two-point slope) was significantly slower than the estimated expansion rate of p11c+ T cells (0.41 ± 0.11 day−1 versus 0.94 ± 0.22 day−1 [P = 0.0078; paired analysis]) and showed significantly less expansion from the time of infection (day 0) to the peak (7.5- ± 2.9-fold versus 97.0- ± 70.4-fold [P = 0.0002; paired analysis]) (Table 3). This is consistent with previous observations that subdominant responses may start later and grow more slowly than dominant responses (14) and suggests that vaccines that induce responses to subdominant epitopes are unlikely to lead to enhanced early viral control (although they may help delay viral escape). The kinetics of decay of p41a+ T-cell numbers matched that of p11c+ T cells (Table 2 and Table 3).
TABLE 3.
CD8+ T-cell responses to SHIV and SIVa
| Group and monkey | Rise (day−1) | Peak expansion (peak/day 0)b | Decay (day−1)
|
|
|---|---|---|---|---|
| Phase 1 | Phase 2 | |||
| SHIV-89.6P P41a | ||||
| 712 | 0.60 | 4.8 | 0.12 | −0.017 |
| 772 | 0.31 | 10.2 | NSc | NS |
| 798 | 0.28 | 3.8 | NS | NS |
| 839 | 0.49 | 7.4 | NS | NS |
| 483 | 0.56 | 5.2 | 0.19 | −0.001 |
| 728 | 0.37 | 6.6 | 0.17 | 0.0001 |
| 833 | 0.38 | 11.5 | 0.55 | 0.011 |
| 893 | 0.32 | 10.7 | 0.21 | 0.008 |
| Mean ± SD | 0.41 ± 0.11* | 7.53 ± 2.93** | 0.25 ± 0.17 | 0.0001 ± 0.011 |
| SIVsm E660 p11c | ||||
| P091 | 1.11 | 3,262 | 0.15 | 0.01 |
| N529 | 1.14 | NDd | NS | NS |
| T258 | 0.51 | 56.9 | 0.11 | 0.00 |
| 9298 | 1.02 | 253 | 0.14 | 0.01 |
| Mean ± SD | 0.94 ± 0.30 | 1,191 ± 1,797 | 0.13 ± 0.02 | 0.005 ± 0.007 |
The results of determinations of kinetics of p41a+ T cells following vaccination and experimental SHIV-89.6P infection or p11c+ T cells following SIVsm E660 infection for individual animals are shown, as are the means and standard deviations for groups. P values were determined from comparisons of the group results to the vaccinated-animal p11c+ T-cell kinetics results shown in Table 2. *,P = 0.0078; **, P = 0.0002.
The peak expansion was calculated by dividing the peak number of cells by the number at day 0.
NS, not significant. The double exponential decay model fit was not significantly better than that of a single-phase decay curve (F test; P > 0.05).
ND, not determined.
Kinetics of p11c+ T cells in SIV infection.
We also investigated the possibility that the delay in CD8+ T-cell expansion may be specific to the SHIV-89.6P virus used. Analysis of the p11c+ T cells in monkeys vaccinated with an SIV gag DNA construct and challenged with SIVsm E660 (16) was also performed. Numbers of p11c+ T cells were not elevated prior to day 8 and thereafter followed kinetics similar to that seen in SHIV-89.6P-infected macaques (Table 3). Taken together these results suggest that the delay in the initiation of expansion of virus-specific CD8+ T cells is seen in responses to different viral epitopes and in the response to both SHIV and SIV infection.
DISCUSSION
Analysis of the kinetics of virus and immune response following vaccination and challenge with SHIV demonstrates (i) a delay in growth of virus-specific CD8+ T cells in both controls and vaccinees, (ii) an absence of an effect of vaccination on viral growth prior to day 10, and (iii) increased formation of long-lived CD8+ T cells in vaccinated animals compared to control animals that may be important in the long-term control of virus. There are a number of possible explanations for the observed delay in the expansion of SHIV-specific CD8+ T cells. First, after antigen encounter there is a delay before the first cell division occurs. However, in murine systems in which the time to first division has been analyzed by 5-carboxyfluorescin diacetate succinimidyl ester (CSFE) labeling in vitro and in vivo, this delay is only 24 to 48 h (19). Second, expansion could be occurring in lymphoid tissue with a delay before the expanded cells are seen in the periphery. However, deuterated glucose labeling of T cells in humans has shown that proliferating cells appear in the blood after a delay of approximately 0.5 to 1 day (29, 36). Moreover, substantial increases in the number of p11c+ T cells can be observed in the blood as early as 1 week following vaccination in macaques (52), suggesting that the observed delay of ∼10 days following infection is a result of the kinetics of infection and not an intrinsic property of the T-cell response.
The explanation that we favor for the delay in expansion of antigen-specific CD8+ T cells is that antigen levels in early infection are simply too low to stimulate a response. That is, T cells do not respond to the very small numbers of infected cells soon after challenge, and infection does not trigger the T-cell response until some threshold is reached. Because CD8+ T cells do not recognize free virus but rather interact with viral peptides presented on MHC class I molecules on the surface of cells, this stimulation threshold may correlate with a critical number of infected cells, a critical antigen density on professional antigen-presenting cells, or even a critical level of host cell damage to provide adequate inflammatory costimulation. The number of p11c+ T cells appears to increase at around day 10 in both controls and vaccinees, consistent with evidence that naïve and memory cells have similar levels of sensitivity to the level of antigen, although memory cells may develop effector function more rapidly after triggering (26, 57).
The viral load on day 10 was approximately half a million copies per ml (mean, 4.3 × 10⁵ copies ml−1). Importantly, a viral load of 5 × 10⁵ copies ml−1 in blood corresponds to between 1.9 × 10⁵ and 1.5 × 10⁹ productively infected cells in the animal, depending on the estimates of viral production, infection, and infected cell decay one uses (see Materials and Methods). Thus, if the probability of a productively infected cell converting to latency is 1 in 105 or greater (13), latency will already have been established around the time that CD8+ T cells begin to expand and control virus. If the initial antigen stimulation occurs 1 to 2 days earlier than the observed increase in p11c+ T-cell numbers (as seen in mouse results) (19), then activation may have occurred on day 8, suggesting that as few as 4.8 × 10³ productively infected cells could be the threshold for stimulation of p11c+ T cells (see Materials and Methods).
The delay in CD8+ T-cell expansion and delay in viral control seen in these macaque models of HIV infection would seem at first to contradict the early CD8+ T-cell response and early viral control results seen in other animal models of infection. Murine infection with lymphocytic choriomeningitis virus and influenza virus provides good examples of CD8+ T-cell protection. Immunization several months prior to challenge with these viruses results in a reduction in peak viral loads in vaccinated mice by as early as day 5 postinfection and in protection from disease (5, 15, 17). However, although viral loads at day 5 are reduced by memory CD8+ T-cell activity, when viral growth is compared prior to the peak (for example, at day 3 following infection), no difference between control and vaccinated animals is found (5, 15, 17). Thus, like the SHIV model, these murine models exhibit a delay in the initiation of CD8+ T-cell control—at early time points viral kinetics do not differ between vaccinees and controls. The fact that the delay is shorter in these murine models may be related to the rapid kinetics of viral growth for these viruses (15, 30)—the threshold for the level of antigen required for CD8+ T-cell stimulation may be crossed much earlier in infection—or to the difference in size between mice and monkeys and the consequent difference in the abilities of antigen-specific CD8+ T cells to encounter their targets.
The absence of an effect of vaccination on early viral kinetics and the possible existence of a threshold level of antigen necessary to stimulate CD8+ T-cell activation and control of viral growth have profound implications for HIV vaccination. First, this finding provides an explanation for recent experiments in which vaccine-induced CD8+ T-cell responses to virus at levels as high as 25% of CD8+ T cells failed to control primary infection (50). Simply increasing the number of antigen-specific CD8+ T cells by different vaccination strategies may be of only limited benefit, as viral growth will still proceed to a threshold level prior to T-cell activation (although viral control after the threshold is reached may conceivably be more rapid). Second, it has been suggested that CD8+ T cells may control virus more effectively following a lower-dose challenge (such as sexual transmission of HIV) (34). However, if CD8+ T cells do not exert significant effects on viral growth until a threshold level of virus is reached, then a lower challenge dose will simply lead to a longer delay until CD8+ T-cell activation occurs but to similar kinetics after this time. Finally, the kinetic analysis suggests that targeting of more (subdominant) epitopes may also be of limited benefit in controlling the early growth of virus, since these responses appear to expand more slowly than the dominant response (Table 3). However, a more diverse response may play an important role in reducing long-term immunological escape of the virus (6).
In vitro experiments equate the level of antigen required for T-cell stimulation to the avidity of the T-cell response (1). Vaccination strategies that increase T-cell avidity should lead to earlier T-cell activation (at a lower level of virus) and thus to better viral control. It is noteworthy that an inverse correlation between antigen dose and T-cell avidity has been demonstrated (1, 11, 45). Thus, high-dose vaccination regimens aimed at eliciting high frequencies of memory CD8+ T cells may lead to lower T-cell avidity. Any potential gains achieved through the presence of increased numbers of T cells may be negated by lower T-cell avidity and a further delay in CD8+ T-cell activation and viral control. By contrast, repeated immunization has been suggested to increase the affinity of the responding T cells (37). Increased affinity of the responding T cells should lead to activation at lower viral loads and earlier viral control (Fig. 2).
FIG. 2.
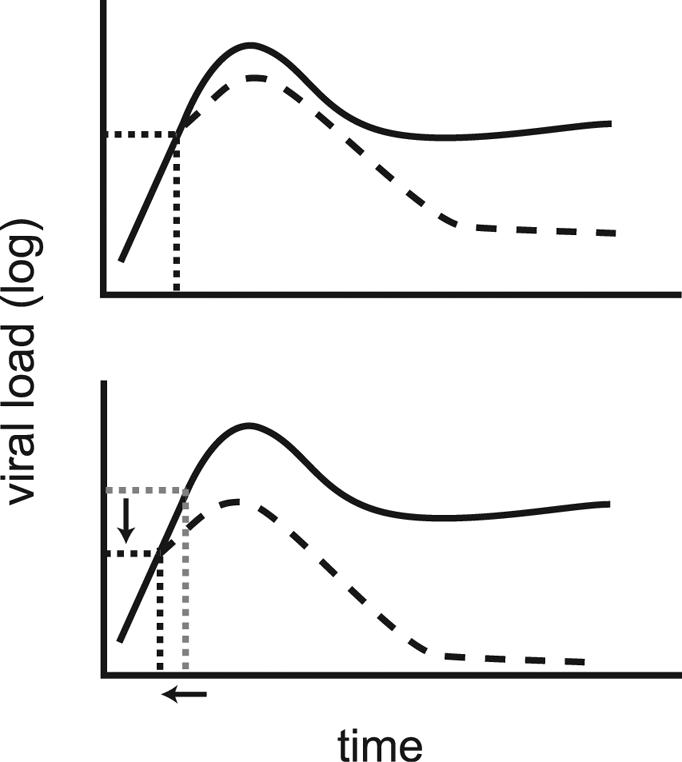
Higher T-cell affinity and early viral control (schematic). The early trajectories of viral loads are similar between control (solid lines) and vaccinated (dashed lines) animals. CD8+ T cells are activated once a threshold level of infection (dotted lines) is reached (top panel). Once activated, T cells exert their effects and control viral growth. Increased affinity of the responding CD8+ T cells leads to a reduced threshold for stimulation, earlier T-cell activation, and faster viral control (bottom panel).
The analysis of p11c+ T-cell kinetics also reveals a slower decay of effector cells and an increased proportion of these cells entering the long-lived (memory) compartment in vaccinees compared to control animal results. There are several possible explanations for this. Grayson et al. (20) have recently suggested that “primary effectors” (generated from naïve cells) have shorter survival and enter the memory pool less efficiently than “secondary effectors” (generated from memory cells) in mice. Thus, since control animals are required to make a primary response, it might be expected that there would be a faster decay of p11c+ T cells in controls and that a smaller proportion of these cells would enter the memory pool. Similarly, it has been suggested that CD4+ T cells are required for optimal generation of CD8+ T-cell memory (8, 48, 53). Since CD4+ T cells are severely depleted in control animals compared to vaccinee results (mean, 12.9 versus 69.6% of preinfection CD4+ T-cell numbers remaining at 17 days postinfection [P = 0.0003]), this may contribute to impaired memory formation in control animals. Finally, it has also been suggested that the presence of high levels of antigen may contribute to weak CD8+ T-cell memory (18, 55). Thus, the higher viral load in control animals in acute infection may also impair memory cell formation. Whatever the mechanism, the increased survival of virus-specific CD8+ T cells in vaccinated animals seems likely to contribute significantly to the long-term control of virus in these animals.
Although DNA and live viral vaccines for HIV have been reported to control both acute and chronic viral loads in a large number of studies using SHIV challenge, this effect is not observed in all monkey models of HIV infection. In particular, although vaccination appears to promote viral control in acute infection following SIVmac239 challenge, viral loads in vaccinees appear to be similar to those of unvaccinated animals during chronic infection (22, 54). The reasons for this are unclear, although it has been suggested that either the viral coreceptor tropism or the ability of antibodies to neutralize the challenge virus may determine long-term outcome. SHIV-89.6P is CXCR4 tropic, and infection leads to profound depletion of CD4+ T cells within 3 weeks of challenge. By contrast, both SIVmac239 and HIV are mostly CCR5 tropic and their presence leads to lower levels of CD4 depletion in acute infection. It is possible that differences in the rate of immune escape from CTL also contribute to the loss of viral control observed in SIVmac239 infection (2, 41). Further studies will clearly be required to address whether differences in viral or immune dynamics in the responses to SHIV versus SIV infection may underlie the observed differences in vaccination outcomes.
This analysis of the kinetics of CD8+ T-cell responses to HIV vaccination and challenge has important and clear implications for ongoing efforts to develop a CTL-inducing vaccine against HIV. The observed delay in initiation of CD8+ T-cell expansion provides a mechanistic basis for the inability of CD8+ T cells to mediate sterilizing immunity and suggests that shortening this delay may be a key issue to be addressed in future vaccine design. Estimates of the life span of antigen-specific CD8+ T cells and their contribution to memory also provide insight into the control of virus in chronic infection. This work indicates that T-cell avidity, activation state, time to first division, and effector function will be important parameters to measure in future vaccine studies.
Acknowledgments
We thank Dan Barouch and Norman Letvin for generously providing the data used in this analysis.
Portions of this work were done under the auspices of the U.S. Department of Energy and supported under contract W-7405-ENG-36. We also acknowledge support from the James S. McDonnell Foundation 21st Century Research Award/Studying Complex Systems and National Institutes of Health grants AI28433 and RR06555. R.M.R. was partially supported by a Marie Curie Fellowship of the European Community program “Quality of Life,” contract QLK2-CT-2002-51691.
REFERENCES
- 1.Alexander-Miller, M. A., G. R. Leggatt, and J. A. Berzofsky. 1996. Selective expansion of high- or low-avidity cytotoxic T lymphocytes and efficacy for adoptive immunotherapy. Proc. Natl. Acad. Sci. USA 93:4102-4107. [DOI] [PMC free article] [PubMed] [Google Scholar]
- 2.Allen, T. M., D. H. O'Connor, P. Jing, J. L. Dzuris, B. R. Mothe, T. U. Vogel, E. Dunphy, M. E. Liebl, C. Emerson, N. Wilson, K. J. Kunstman, X. Wang, D. B. Allison, A. L. Hughes, R. C. Desrosiers, J. D. Altman, S. M. Wolinsky, A. Sette, and D. I. Watkins. 2000. Tat-specific cytotoxic T lymphocytes select for SIV escape variants during resolution of primary viraemia. Nature 407:386-390. [DOI] [PubMed] [Google Scholar]
- 3.Amara, R. R., F. Villinger, J. D. Altman, S. L. Lydy, S. P. O'Neil, S. I. Staprans, D. C. Montefiori, Y. Xu, J. G. Herndon, L. S. Wyatt, M. A. Candido, N. L. Kozyr, P. L. Earl, J. M. Smith, H. L. Ma, B. D. Grimm, M. L. Hulsey, J. Miller, H. M. McClure, J. M. McNicholl, B. Moss, and H. L. Robinson. 2001. Control of a mucosal challenge and prevention of AIDS by a multiprotein DNA/MVA vaccine. Science 292:69-74. [DOI] [PubMed] [Google Scholar]
- 4.Appay, V., D. F. Nixon, S. M. Donahoe, G. M. A. Gillespie, T. Dong, A. King, G. S. Ogg, H. M. L. Spiegel, C. Conlon, C. A. Spina, D. V. Havlir, D. D. Richman, A. Waters, P. Easterbrook, A. J. McMichael, and S. L. Rowland-Jones. 2000. HIV-specific CD8+ T cells produce antiviral cytokines but are impaired in cytolytic function. J. Exp. Med. 192:63-75. [DOI] [PMC free article] [PubMed] [Google Scholar]
- 5.Bachmann, M. F., T. M. Kundig, H. Hengartner, and R. M. Zinkernagel. 1997. Protection against immunopathological consequences of a viral infection by activated but not resting cytotoxic T cells: T cell memory without “memory T cells”? Proc. Natl. Acad. Sci. USA 94:640-645. [DOI] [PMC free article] [PubMed] [Google Scholar]
- 6.Barouch, D. H., J. Kunstman, M. J. Kuroda, J. E. Schmitz, S. Santra, F. W. Peyerl, G. R. Krivulka, K. Beaudry, M. A. Lifton, D. A. Gorgone, D. C. Montefiori, M. G. Lewis, S. M. Wolinsky, and N. L. Letvin. 2002. Eventual AIDS vaccine failure in a rhesus monkey by viral escape from cytotoxic T lymphocytes. Nature 415:335-339. [DOI] [PubMed] [Google Scholar]
- 7.Barouch, D. H., S. Santra, J. E. Schmitz, M. J. Kuroda, T. M. Fu, W. Wagner, M. Bilska, A. Craiu, X. X. Zheng, G. R. Krivulka, K. Beaudry, M. A. Lifton, C. E. Nickerson, W. L. Trigona, K. Punt, D. C. Freed, L. M. Guan, S. Dubey, D. Casimiro, A. Simon, M. E. Davies, M. Chastain, T. B. Strom, R. S. Gelman, D. C. Montefiori, et al. 2000. Control of viremia and prevention of clinical AIDS in rhesus monkeys by cytokine-augmented DNA vaccination. Science 290:486-492. [DOI] [PubMed] [Google Scholar]
- 8.Belz, G. T., D. Wodarz, G. Diaz, M. A. Nowak, and P. C. Doherty. 2002. Compromised influenza virus-specific CD8+-T-cell memory in CD4+-T-cell-deficient mice. J. Virol. 76:12388-12393. [DOI] [PMC free article] [PubMed] [Google Scholar]
- 9.Bobbitt, K. R., M. M. Addo, M. Altfeld, T. Filzen, A. A. Onafuwa, B. D. Walker, and K. L. Collins. 2003. Rev activity determines sensitivity of HIV-1-infected primary T cells to CTL killing. Immunity 18:289-299. [DOI] [PubMed] [Google Scholar]
- 10.Borrow, P., H. Lewicki, B. H. Hahn, G. M. Shaw, and M. B. Oldstone. 1994. Virus-specific CD8+ cytotoxic T-lymphocyte activity associated with control of viremia in primary human immunodeficiency virus type 1 infection. J. Virol. 68:6103-6110. [DOI] [PMC free article] [PubMed] [Google Scholar]
- 11.Bullock, T. N., D. W. Mullins, and V. H. Engelhard. 2003. Antigen density presented by dendritic cells in vivo differentially affects the number and avidity of primary, memory, and recall CD8+ T cells. J. Immunol. 170:1822-1829. [DOI] [PubMed] [Google Scholar]
- 12.Chen, X., G. Scala, I. Quinto, W. Liu, T. W. Chun, J. S. Justement, O. J. Cohen, T. C. vanCott, M. Iwanicki, M. G. Lewis, J. Greenhouse, T. Barry, D. Venzon, and A. S. Fauci. 2001. Protection of rhesus macaques against disease progression from pathogenic SHIV-89.6PD by vaccination with phage-displayed HIV-1 epitopes. Nat. Med. 7:1225-1231. [DOI] [PubMed] [Google Scholar]
- 13.Chun, T. W., L. Carruth, D. Finzi, X. Shen, J. A. DiGiuseppe, H. Taylor, M. Hermankova, K. Chadwick, J. Margolick, T. C. Quinn, Y. H. Kuo, R. Brookmeyer, M. A. Zeiger, P. Barditch-Crovo, and R. F. Siliciano. 1997. Quantification of latent tissue reservoirs and total body viral load in HIV-1 infection. Nature 387:183-188. [DOI] [PubMed] [Google Scholar]
- 14.De Boer, R. J., M. Oprea, R. Antia, K. Murali-Krishna, R. Ahmed, and A. S. Perelson. 2001. Recruitment times, proliferation, and apoptosis rates during the CD8+ T-cell response to lymphocytic choriomeningitis virus. J. Virol. 75:10663-10669. [DOI] [PMC free article] [PubMed] [Google Scholar]
- 15.Doherty, P. C., and J. P. Christensen. 2000. Accessing complexity: the dynamics of virus-specific T cell responses. Annu. Rev. Immunol. 18:561-592. [DOI] [PubMed] [Google Scholar]
- 16.Egan, M. A., W. A. Charini, M. J. Kuroda, J. E. Schmitz, P. Racz, K. Tenner-Racz, K. Manson, M. Wyand, M. A. Lifton, C. E. Nickerson, T. M. Fu, J. W. Shiver, and N. L. Letvin. 2000. Simian immunodeficiency virus (SIV) gag DNA-vaccinated rhesus monkeys develop secondary cytotoxic T-lymphocyte responses and control viral replication after pathogenic SIV infection. J. Virol. 74:7485-7495. [DOI] [PMC free article] [PubMed] [Google Scholar]
- 17.Flynn, K. J., G. T. Belz, J. D. Altman, R. Ahmed, D. L. Woodland, and P. C. Doherty. 1998. Virus-specific CD8+ T cells in primary and secondary influenza pneumonia. Immunity 8:683-691. [DOI] [PubMed] [Google Scholar]
- 18.Gallimore, A., A. Glithero, A. Godkin, A. C. Tissot, A. Pluckthun, T. Elliott, H. Hengartner, and R. Zinkernagel. 1998. Induction and exhaustion of lymphocytic choriomeningitis virus-specific cytotoxic T lymphocytes visualized using soluble tetrameric major histocompatibility complex class I-peptide complexes. J. Exp. Med. 187:1383-1393. [DOI] [PMC free article] [PubMed] [Google Scholar]
- 19.Gett, A. V., and P. D. Hodgkin. 2000. A cellular calculus for signal integration by T cells. Nat. Immunol. 1:239-244. [DOI] [PubMed] [Google Scholar]
- 20.Grayson, J. M., L. E. Harrington, J. G. Lanier, E. J. Wherry, and R. Ahmed. 2002. Differential sensitivity of naive and memory CD8+ T cells to apoptosis in vivo. J. Immunol. 169:3760-3770. [DOI] [PubMed] [Google Scholar]
- 21.Haase, A. T., K. Henry, M. Zupancic, G. Sedgewick, R. A. Faust, H. Melroe, W. Cavert, K. Gebhard, K. Staskus, Z. Q. Zhang, P. J. Dailey, H. H. Balfour, Jr., A. Erice, and A. S. Perelson. 1996. Quantitative image analysis of HIV-1 infection in lymphoid tissue. Science 274:985-989. [DOI] [PubMed] [Google Scholar]
- 22.Horton, H., T. U. Vogel, D. K. Carter, K. Vielhuber, D. H. Fuller, T. Shipley, J. T. Fuller, K. J. Kunstman, G. Sutter, D. C. Montefiori, V. Erfle, R. C. Desrosiers, N. Wilson, L. J. Picker, S. M. Wolinsky, C. Wang, D. B. Allison, and D. I. Watkins. 2002. Immunization of rhesus macaques with a DNA prime/modified vaccinia virus ankara boost regimen induces broad simian immunodeficiency virus (SIV)-specific T-cell responses and reduces initial viral replication but does not prevent disease progression following challenge with pathogenic SIVmac239. J. Virol. 76:7187-7202. [DOI] [PMC free article] [PubMed] [Google Scholar]
- 23.Igarashi, T., C. Brown, A. Azadegan, N. Haigwood, D. Dimitrov, M. A. Martin, and R. Shibata. 1999. Human immunodeficiency virus type 1 neutralizing antibodies accelerate clearance of cell-free virions from blood plasma. Nat. Med. 5:211-216. [DOI] [PubMed] [Google Scholar]
- 24.Jin, X., D. E. Bauer, S. E. Tuttleton, S. Lewin, A. Gettie, J. Blanchard, C. E. Irwin, J. T. Safrit, J. Mittler, L. Weinberger, L. G. Kostrikis, L. Zhang, A. S. Perelson, and D. D. Ho. 1999. Dramatic rise in plasma viremia after CD8+ T cell depletion in simian immunodeficiency virus-infected macaques. J. Exp. Med. 189:991-998. [DOI] [PMC free article] [PubMed] [Google Scholar]
- 25.Karrer, U., S. Sierro, M. Wagner, A. Oxenius, H. Hengel, U. H. Koszinowski, R. E. Phillips, and P. Klenerman. 2003. Memory inflation: continuous accumulation of antiviral CD8+ T cells over time. J. Immunol. 170:2022-2029. [DOI] [PubMed] [Google Scholar]
- 26.Kersh, E. N., S. M. Kaech, T. M. Onami, M. Moran, E. J. Wherry, M. C. Miceli, and R. Ahmed. 2003. TCR signal transduction in antigen-specific memory CD8 T cells. J. Immunol. 170:5455-5463. [DOI] [PubMed] [Google Scholar]
- 27.Koenig, S., A. J. Conley, Y. A. Brewah, G. M. Jones, S. Leath, L. J. Boots, V. Davey, G. Pantaleo, J. F. Demarest, C. Carter, et al. 1995. Transfer of HIV-1-specific cytotoxic T lymphocytes to an AIDS patient leads to selection for mutant HIV variants and subsequent disease progression. Nat. Med. 1:330-336. [DOI] [PubMed] [Google Scholar]
- 28.Koup, R. A., J. T. Safrit, Y. Cao, C. A. Andrews, G. McLeod, W. Borkowsky, C. Farthing, and D. D. Ho. 1994. Temporal association of cellular immune responses with the initial control of viremia in primary human immunodeficiency virus type 1 syndrome. J. Virol. 68:4650-4655. [DOI] [PMC free article] [PubMed] [Google Scholar]
- 29.Kovacs, J. A., R. A. Lempicki, I. A. Sidorov, J. W. Adelsberger, B. Herpin, J. A. Metcalf, I. Sereti, M. A. Polis, R. T. Davey, J. Tavel, J. Falloon, R. Stevens, L. Lambert, R. Dewar, D. J. Schwartzentruber, M. R. Anver, M. W. Baseler, H. Masur, D. S. Dimitrov, and H. C. Lane. 2001. Identification of dynamically distinct subpopulations of T lymphocytes that are differentially affected by HIV. J. Exp. Med. 194:1731-1741. [DOI] [PMC free article] [PubMed] [Google Scholar]
- 30.Lau, L. L., B. D. Jamieson, T. Somasundaram, and R. Ahmed. 1994. Cytotoxic T-cell memory without antigen. Nature 369:648-652. [DOI] [PubMed] [Google Scholar]
- 31.Lieberman, J., P. R. Skolnik, G. R. Parkerson III, J. A. Fabry, B. Landry, J. Bethel, and J. Kagan. 1997. Safety of autologous, ex vivo-expanded human immunodeficiency virus (HIV)-specific cytotoxic T-lymphocyte infusion in HIV-infected patients. Blood 90:2196-2206. [PubMed] [Google Scholar]
- 32.Little, S. J., A. R. McLean, C. A. Spina, D. D. Richman, and D. V. Havlir. 1999. Viral dynamics of acute HIV-1 infection. J. Exp. Med. 190:841-850. [DOI] [PMC free article] [PubMed] [Google Scholar]
- 33.Markowitz, M., M. Louie, A. Hurley, E. Sun, M. Di Mascio, A. S. Perelson, and D. D. Ho. 2003. A novel antiviral intervention results in more accurate assessment of human immunodeficiency virus type 1 replication dynamics and T-cell decay in vivo. J. Virol. 77:5037-5038. [DOI] [PMC free article] [PubMed] [Google Scholar]
- 34.McMichael, A., and T. Hanke. 2002. The quest for an AIDS vaccine: is the CD8 T-cell approach feasible? Nat. Rev. Immunol. 2:283-291. [DOI] [PubMed] [Google Scholar]
- 35.Mellors, J. W., C. R. Rinaldo, Jr., P. Gupta, R. M. White, J. A. Todd, and L. A. Kingsley. 1996. Prognosis in HIV-1 infection predicted by the quantity of virus in plasma. Science 272:1167-1170. (Erratum 275:14, 1997.) [DOI] [PubMed] [Google Scholar]
- 36.Mohri, H., A. S. Perelson, K. Tung, R. M. Ribeiro, B. Ramratnam, M. Markowitz, R. Kost, A. Hurley, L. Weinberger, D. Cesar, M. K. Hellerstein, and D. D. Ho. 2001. Increased turnover of T lymphocytes in HIV-1 infection and its reduction by antiretroviral therapy. J. Exp. Med. 194:1277-1287. [DOI] [PMC free article] [PubMed] [Google Scholar]
- 37.Monsurro, V., M. B. Nielsen, A. Perez-Diez, M. E. Dudley, E. Wang, S. A. Rosenberg, and F. M. Marincola. 2001. Kinetics of TCR use in response to repeated epitope-specific immunization. J. Immunol. 166:5817-5825. [DOI] [PubMed] [Google Scholar]
- 38.Musey, L., J. Hughes, T. Schacker, T. Shea, L. Corey, and M. J. McElrath. 1997. Cytotoxic-T-cell responses, viral load, and disease progression in early human immunodeficiency virus type 1 infection. N. Engl. J. Med. 337:1267-1274. [DOI] [PubMed] [Google Scholar]
- 39.Nowak, M. A., A. L. Lloyd, G. M. Vasquez, T. A. Wiltrout, L. M. Wahl, N. Bischofberger, J. Williams, A. Kinter, A. S. Fauci, V. M. Hirsch, and J. D. Lifson. 1997. Viral dynamics of primary viremia and antiretroviral therapy in simian immunodeficiency virus infection. J. Virol. 71:7518-7525. [DOI] [PMC free article] [PubMed] [Google Scholar]
- 40.Nowak, M. A., and R. M. May. 2000. Virus dynamics: mathematical principles of immunology and virology. Oxford University Press, Oxford, United Kingdom.
- 41.O'Connor, D. H., T. M. Allen, T. U. Vogel, P. Jing, I. P. DeSouza, E. Dodds, E. J. Dunphy, C. Melsaether, B. Mothe, H. Yamamoto, H. Horton, N. Wilson, A. L. Hughes, and D. I. Watkins. 2002. Acute phase cytotoxic T lymphocyte escape is a hallmark of simian immunodeficiency virus infection. Nat. Med. 8:493-499. [DOI] [PubMed] [Google Scholar]
- 42.Perelson, A. S., D. E. Kirschner, and R. De Boer. 1993. Dynamics of HIV infection of CD4+ T cells. Math. Biosci. 114:81-125. [DOI] [PubMed] [Google Scholar]
- 43.Phillips, R. E., S. Rowland-Jones, D. F. Nixon, F. M. Gotch, J. P. Edwards, A. O. Ogunlesi, J. G. Elvin, J. A. Rothbard, C. R. M. Bangham, C. R. Rizza, and A. J. McMichael. 1991. Human immunodeficiency virus genetic variation that can escape cytotoxic T cell recognition. Nature 354:453-459. [DOI] [PubMed] [Google Scholar]
- 44.Ramratnam, B., S. Bonhoeffer, J. Binley, A. Hurley, L. Zhang, J. E. Mittler, M. Markowitz, J. P. Moore, A. S. Perelson, and D. D. Ho. 1999. Rapid production and clearance of HIV-1 and hepatitis C virus assessed by large volume plasma apheresis. Lancet 354:1782-1785. [DOI] [PubMed] [Google Scholar]
- 45.Rees, W., J. Bender, T. K. Teague, R. M. Kedl, F. Crawford, P. Marrack, and J. Kappler. 1999. An inverse relationship between T cell receptor affinity and antigen dose during CD4+ T cell responses in vivo and in vitro. Proc. Natl. Acad. Sci. USA 96:9781-9786. [DOI] [PMC free article] [PubMed] [Google Scholar]
- 46.Santra, S., D. H. Barouch, M. J. Kuroda, J. E. Schmitz, G. R. Krivulka, K. Beaudry, C. I. Lord, M. A. Lifton, L. S. Wyatt, B. Moss, V. M. Hirsch, and N. L. Letvin. 2002. Prior vaccination increases the epitopic breadth of the cytotoxic T-lymphocyte response that evolves in rhesus monkeys following a simian-human immunodeficiency virus infection. J. Virol. 76:6376-6381. [DOI] [PMC free article] [PubMed] [Google Scholar]
- 47.Schmitz, J. E., M. J. Kuroda, S. Santra, V. G. Sasseville, M. A. Simon, M. A. Lifton, P. Racz, K. Tenner-Racz, M. Dalesandro, B. J. Scallon, J. Ghrayeb, M. A. Forman, D. C. Montefiori, E. P. Rieber, N. L. Letvin, and K. A. Reimann. 1999. Control of viremia in simian immunodeficiency virus infection by CD8+ lymphocytes. Science 283:857-860. [DOI] [PubMed] [Google Scholar]
- 48.Shedlock, D. J., and H. Shen. 2003. Requirement for CD4 T cell help in generating functional CD8 T cell memory. Science 300:337-339. [DOI] [PubMed] [Google Scholar]
- 49.Shen, X. F., and R. F. Siliciano. 2000. AIDS—preventing AIDS but not HIV-1 infection with a DNA vaccine. Science 290:20. [DOI] [PubMed] [Google Scholar]
- 50.Shiver, J. W., T. M. Fu, L. Chen, D. R. Casimiro, M. E. Davies, R. K. Evans, Z. Q. Zhang, A. J. Simon, W. L. Trigona, S. A. Dubey, L. Huang, V. A. Harris, R. S. Long, X. Liang, L. Handt, W. A. Schleif, L. Zhu, D. C. Freed, N. V. Persaud, L. Guan, K. S. Punt, A. Tang, M. Chen, K. A. Wilson, K. B. Collins, G. J. Heidecker, V. R. Fernandez, H. C. Perry, J. G. Joyce, K. M. Grimm, J. C. Cook, P. M. Keller, D. S. Kresock, H. Mach, R. D. Troutman, L. A. Isopi, D. M. Williams, Z. Xu, K. E. Bohannon, D. B. Volkin, D. C. Montefiori, A. Miura, G. R. Krivulka, M. A. Lifton, M. J. Kuroda, J. E. Schmitz, N. L. Letvin, M. J. Caulfield, A. J. Bett, R. Youil, D. C. Kaslow, and E. A. Emini. 2002. Replication-incompetent adenoviral vaccine vector elicits effective anti-immunodeficiency-virus immunity. Nature 415:331-335. [DOI] [PubMed] [Google Scholar]
- 51.Staprans, S. I., P. J. Dailey, A. Rosenthal, C. Horton, R. M. Grant, N. Lerche, and M. B. Feinberg. 1999. Simian immunodeficiency virus disease course is predicted by the extent of virus replication during primary infection. J. Virol. 73:4829-4839. [DOI] [PMC free article] [PubMed] [Google Scholar]
- 52.Subbramanian, R. A., M. J. Kuroda, W. A. Charini, D. H. Barouch, C. Costantino, S. Santra, J. E. Schmitz, K. L. Martin, M. A. Lifton, D. A. Gorgone, J. W. Shiver, and N. L. Letvin. 2003. Magnitude and diversity of cytotoxic-T-lymphocyte responses elicited by multiepitope DNA vaccination in rhesus monkeys. J. Virol. 77:10113-10118. [DOI] [PMC free article] [PubMed] [Google Scholar]
- 53.Sun, J. C., and M. J. Bevan. 2003. Defective CD8 T cell memory following acute infection without CD4 T cell help. Science 300:339-342. [DOI] [PMC free article] [PubMed] [Google Scholar]
- 54.Vogel, T. U., M. R. Reynolds, D. H. Fuller, K. Vielhuber, T. Shipley, J. T. Fuller, K. J. Kunstman, G. Sutter, M. L. Marthas, V. Erfle, S. M. Wolinsky, C. Wang, D. B. Allison, E. W. Rud, N. Wilson, D. Montefiori, J. D. Altman, and D. I. Watkins. 2003. Multispecific vaccine-induced mucosal cytotoxic T lymphocytes reduce acute-phase viral replication but fail in long-term control of simian immunodeficiency virus SIVmac239. J. Virol. 77:13348-13360. [DOI] [PMC free article] [PubMed] [Google Scholar]
- 55.Wherry, E. J., J. N. Blattman, K. Murali-Krishna, R. van der Most, and R. Ahmed. 2003. Viral persistence alters CD8 T-cell immunodominance and tissue distribution and results in distinct stages of functional impairment. J. Virol. 77:4911-4927. [DOI] [PMC free article] [PubMed] [Google Scholar]
- 56.Zhang, L., P. J. Dailey, T. He, A. Gettie, S. Bonhoeffer, A. S. Perelson, and D. D. Ho. 1999. Rapid clearance of simian immunodeficiency virus particles from plasma of rhesus macaques. J. Virol. 73:855-860. [DOI] [PMC free article] [PubMed] [Google Scholar]
- 57.Zimmermann, C., A. Prevost-Blondel, C. Blaser, and H. Pircher. 1999. Kinetics of the response of naive and memory CD8 T cells to antigen: similarities and differences. Eur. J. Immunol. 29:284-290. [DOI] [PubMed] [Google Scholar]