Significance
Lipid scramblases play critical roles in diverse biological events, from cellular apoptosis to coagulation of the blood. The transmembrane protein 16 (TMEM16) family of membrane proteins consists of both ion channels and scramblases, but little is known about how these proteins conduct ions or lipids across the bilayer. Here, we present computational results on a fungal TMEM16 family member that provide insight into how scramblases deform the membrane to facilitate lipid permeation. We identified specific residues on the protein surface that are responsible for scrambling, and homologous positions in the mammalian TMEM16 family members may be promising pharmaceutical targets.
Keywords: TMEM16, lipid scrambling, continuum membrane models, simulation, anoctamin
Abstract
The transmembrane protein 16 (TMEM16) family of membrane proteins includes both lipid scramblases and ion channels involved in olfaction, nociception, and blood coagulation. The crystal structure of the fungal Nectria haematococca TMEM16 (nhTMEM16) scramblase suggested a putative mechanism of lipid transport, whereby polar and charged lipid headgroups move through the low-dielectric environment of the membrane by traversing a hydrophilic groove on the membrane-spanning surface of the protein. Here, we use computational methods to explore the membrane–protein interactions involved in lipid scrambling. Fast, continuum membrane-bending calculations reveal a global pattern of charged and hydrophobic surface residues that bends the membrane in a large-amplitude sinusoidal wave, resulting in bilayer thinning across the hydrophilic groove. Atomic simulations uncover two lipid headgroup-interaction sites flanking the groove. The cytoplasmic site nucleates headgroup–dipole stacking interactions that form a chain of lipid molecules that penetrate into the groove. In two instances, a cytoplasmic lipid interdigitates into this chain, crosses the bilayer, and enters the extracellular leaflet, and the reverse process happens twice as well. Continuum membrane-bending analysis carried out on homology models of mammalian homologs shows that these family members also bend the membrane—even those that lack scramblase activity. Sequence alignments show that the lipid-interaction sites are conserved in many family members but less so in those with reduced scrambling ability. Our analysis provides insight into how large-scale membrane bending and protein chemistry facilitate lipid permeation in the TMEM16 family, and we hypothesize that membrane interactions also affect ion permeation.
The compositional asymmetry between the leaflets of the plasma membrane influences the signaling properties of cells. Scramblases are a class of proteins that disrupt membrane asymmetry by facilitating the transfer of phospholipids from one leaflet to the other in an energy-independent manner. These transmembrane proteins play a role in events such as coagulation of the blood and cellular apoptosis by transporting phosphatidylserine (PS) from the inner leaflet to the outer leaflet of the plasma membrane (1). In particular, transmembrane protein 16 (TMEM16) family members have gained recent attention for their role in phospholipid scrambling in platelets and fungi. The TMEM16 family members have diverse functions. For example, TMEM16A and -B are calcium-activated chloride channels, TMEM16F is a nonspecific cation channel and scramblase, and the fungal Aspergillus fumigatus TMEM16 is another dual scramblase/ion channel (2–6).
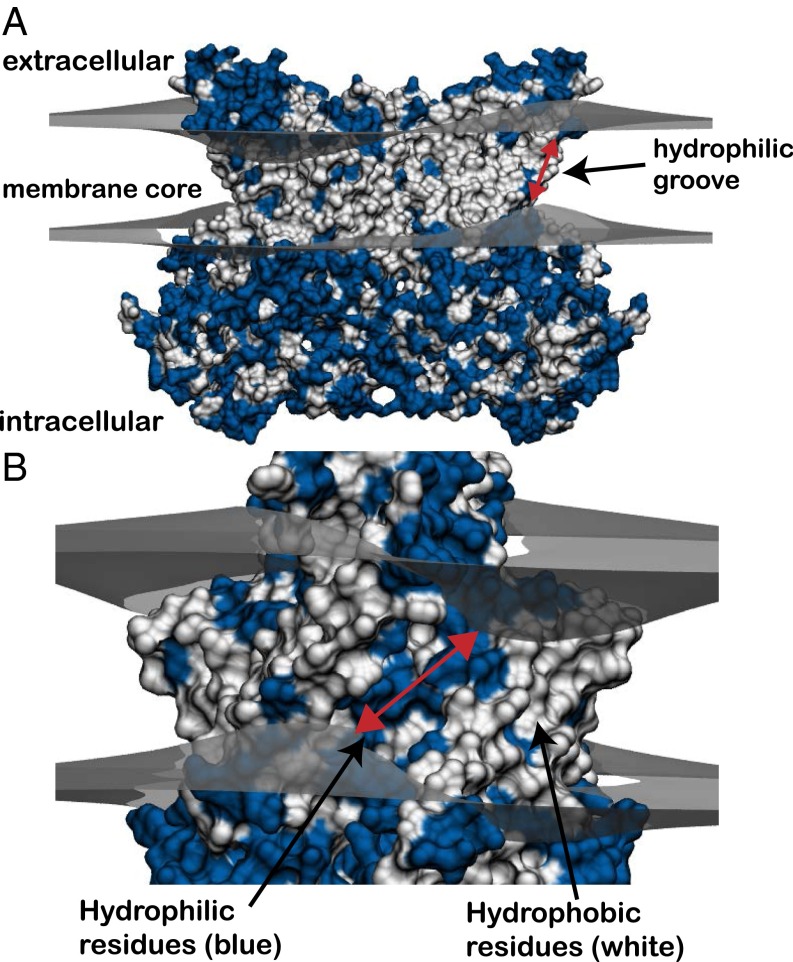
The structure of the Nectria haematococca TMEM16 (nhTMEM16) membrane protein revealed a possible mechanism for phospholipid conduction across the membrane (Fig. 1A) (7). The protein forms a dimer, and each subunit has a hydrophilic groove composed of polar and charged residues that face the membrane core and traverses the entire bilayer (blue strip in Fig. 1B). Flippases and floppases (ATP-dependent proteins that shuttle lipids from or to the extracellular leaflet, respectively) possess a similar hydrophilic groove, and lipids are believed to permeate these grooves in a similar manner as in scramblases (8). Computational analysis has revealed that it is energetically costly to place polar and charged residues in the core of the membrane (9, 10), and these high energy costs have been corroborated experimentally (11, 12), albeit the per-residue, experimental-insertion energy scales are generally less unfavorable than computational predictions. The hydrophilic groove likely distorts the membrane shape to provide a more favorable environment for polar headgroup conduction from one leaflet to the other (7). This mechanism was later supported by experimental evidence that helices forming the hydrophilic groove are essential for scrambling in TMEM16F (13). Nonetheless, there is currently little information concerning the specific interactions involved in facilitating headgroup conduction along the hydrophilic groove. Moreover, it is not known whether nhTMEM16 is also an ion channel, and if it is, whether the hydrophilic groove plays a role in ion conduction.
Fig. 1.
Predicted membrane bending around nhTMEM16 dimer based on continuum modeling. (A) Crystal structure of the fungal scramblase, nhTMEM16 (PDB ID code 4WIS), deforming the upper and lower membrane leaflets (gray surfaces) predicted from our hybrid continuum-atomistic model. Each surface represents the hydrophobic–hydrophilic interface where the polar headgroups meet the hydrophobic core of the acyl chains. The membrane bends in a large amplitude wave that attempts to expose polar and charged residues (blue), while burying hydrophobic residues (white). (B) Ninety-degree rotation of the view in A showing one of the two hydrophilic grooves that span the membrane core. The membrane is maximally distorted at each groove, and the leaflet-to-leaflet distance is 18.3 (red arrow).
Computational approaches provide a unique set of tools for probing protein function at a high spatial and temporal level. However, large-scale membrane deformations and lipid translocation are slow processes that are difficult to study with traditional fully atomistic molecular dynamics (MD) simulations, given current computational limitations. To mitigate some of these concerns, Sansom and coworkers (14) used their membrane protein simulation pipeline, MemProtMD, to run less demanding coarse-grained simulations on nhTMEM16. Over the course of 1 s, the authors observed approximately 15 lipids traverse the hydrophilic groove from the extracellular to the cytoplasmic leaflet of the membrane. Although making important strides toward revealing how this protein functions, because the protein was restrained and coarse-grained, little can be said about the individual interactions facilitating lipid permeation and the timescale of lipid permeation.
Here, we use our implicit membrane model together with fully atomistic MD simulations to revisit the global and local mechanisms of lipid scrambling in nhTMEM16. We previously developed a fast, hybrid continuum-atomistic model that treats the protein in atomistic detail, while implicitly representing the membrane using elasticity theory (15–17). Both our continuum model and MD simulations show that nhTMEM16 generates large-scale membrane deformations around the entire membrane–protein interface, including areas far away from the hydrophilic groove. We also identify conserved, charged residues at the ends of the groove that transiently bind to phosphatidylcholine (PC) headgroups. These residues appear to coordinate lipid translocation and are conserved in many mammalian TMEM16 family members. One of these headgroup-interaction sites appears to nucleate headgroup-stacking interactions that extend through the hydrophilic groove. Lastly, continuum calculations on homology models of mammalian TMEM16 members also reveal large membrane deformations with a similar distortion pattern of distortion.
TMEM16 Induces Large-Scale Membrane Deformations
Using our continuum model, we calculated the membrane deformation induced by nhTMEM16. We found that nhTMEM16 significantly distorts the membrane. A large-amplitude, slow gentle bend occurs around the entire skirt of the protein with the most pronounced deformation at the hydrophilic groove (Fig. 1). Because the protein is a symmetric dimer, the distortion pattern has a twofold symmetry when viewed perpendicular to the plane of the membrane. The deformation is not a direct pinch, or vertical thinning, of the membrane across the groove, but rather, nhTMEM16 induces bending curvature in the angular direction along the protein–bilayer contact curve (i.e., the membrane is high on the left side of the groove and then dips down low on the right side as viewed in Fig. 1B). The energetic cost of the deformation, using standard material properties of 1-palmitoyl-2-oleoyl PC (POPC) bilayers (Table S1) (17–27), is 60 kcal/mol, and the bending energy dominates over the compression and surface tension terms.
Table S1.
Parameter values used in all continuum model calculations
| Parameter | Value | Ref(s). |
| Membrane thickness | 28.5 | 18 |
| Surface tension | 3.00 N | 19 |
| Bending modulus | N | 20 |
| Gaussian modulus | 21, 22 | |
| Compression modulus | N | 23, 24 |
| Partenskii–Jordan coefficient | 4.27 | 17, 25 |
| Protein dielectric | 2.0 | 26 |
| Membrane core dielectric | 2.0 | 27 |
| Headgroup dielectric | 80.0 | 27 |
| Water dielectric | 80.0 | 26 |
All membrane values correspond to POPC bilayers. Additional parameters used in the electrostatic calculations are identical to values reported in ref. 19.
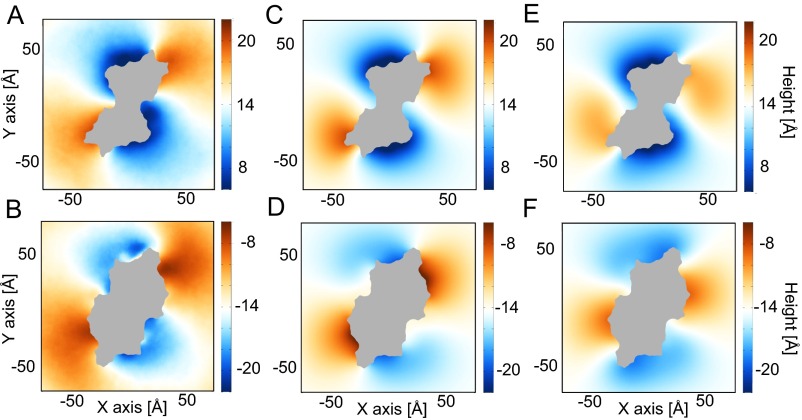
The highest point of the lower leaflet and lowest point of the upper leaflet are offset from each other, but the distance of closest approach between the two surfaces (red arrow in Fig. 1B) is directly through the hydrophilic groove. This shortened path length is 18.3 compared with 28.5 for the flat POPC bilayer at equilibrium. We hypothesized not only that this deformation is driven by the residues within the hydrophilic groove but also that the shape is driven by surface-anchoring residues along the skirt of the protein. To test this idea, we neutralized all charged and hydrophilic residues within the hydrophilic groove. If the electrostatics of the hydrophilic groove is driving the deformation, one would expect little to no deformation from the neutralized mutant. On the contrary, although we see less extreme distortion, the deformation persists, with only a 12 kcal/mol reduction in the total membrane-bending energy (Fig. S1). Thus, this large-scale deformation appears to be a global mechanism that requires the entire protein, rather than just the hydrophilic groove. Nonetheless, 18.3 is still a large distance for a zwitterionic or charged lipid to permeate through the low-dielectric core of the membrane, so we turned to atomistic MD simulations to further investigate how specific interactions within the groove may further aid passage.
Fig. S1.
Extracellular view of upper and lower leaflet heights predicted from MD and continuum calculations. (A and B) The upper and lower leaflet surfaces, respectively, calculated from averaging results from MD simulations. (C and D) The upper and lower leaflet surfaces, respectively, determined from continuum calculations. (E and F) The upper and lower leaflet surfaces, respectively, determined from continuum calculations when all residues within the hydrophilic groove are neutralized. Surfaces are colored by height, where red is an upward deflection, blue is a downward deflection, and white is no deflection. The area occupied by the protein is shaded gray.
Molecular Simulations Reveal Lipid-Interaction Sites
Ion channels often have ion-binding sites along the conducting pore (28), and these sites serve as “stepping stones” for ions as they pass through the channel. To determine how lipids interact with nhTMEM16 and if lipid conduction occurs via a similar stepping stone mechanism, we carried out 16 independent fully atomistic MD simulations of nhTMEM16 embedded in a homogeneous POPC bilayer—8 lasting 120 ns and 8 lasting 400 ns for an aggregate simulation time of 4.16 s. We started by comparing the average, computed headgroup-core surfaces from all simulations with the results from our continuum calculations (Fig. S1). The deformation profiles of the upper and lower leaflets using both methods are remarkably similar, as we noted previously (17). The MD simulations confirm that the protein induces a large-amplitude sinusoidal wave along the membrane–protein contact boundary with the greatest distortion centered on the hydrophilic groove. Moreover, the close match to the continuum results suggests that the MD simulations have relaxed close to equilibrium.
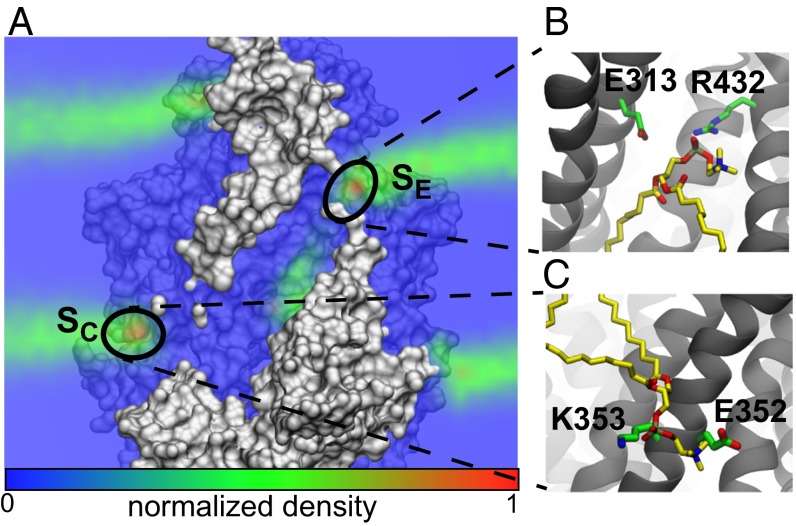
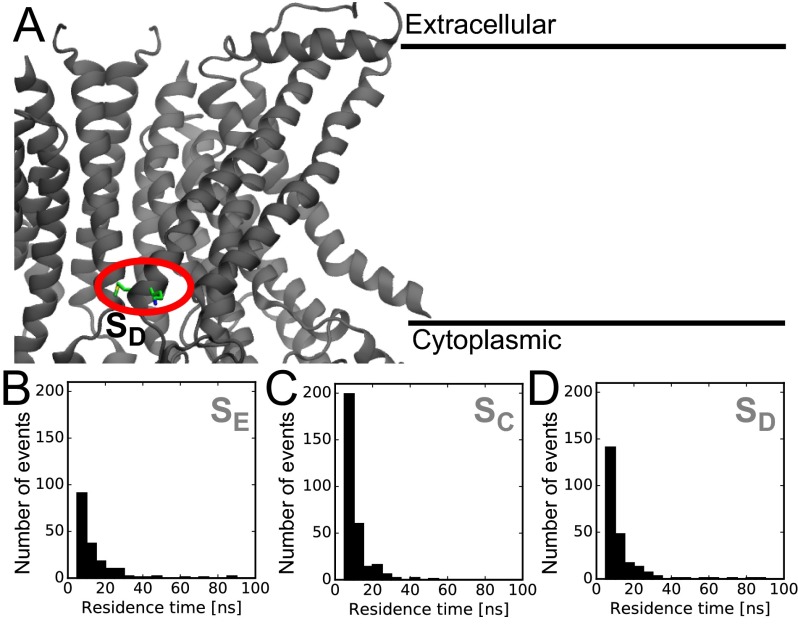
Next, we calculated the phosphate density averaged over all simulations. If lipid headgroups were localizing to specific sites on the protein, then these sites would be revealed by an increase in density. During the simulations, lipid headgroups entered the hydrophilic groove, and the analysis revealed two regions of increased density compared with bulk—one at each end of the groove (Fig. 2A). The extracellular site () has a local density about three times higher than the equilibrium density far from the protein, and we found two oppositely charged residues, E313 and R432, that were responsible for stabilizing PC lipids (Fig. 2B). Lipids at this site are isolated from nearby headgroups, and therefore, the site might be a stepping stone for lipid conduction through the groove. In the cytoplasmic leaflet at the base of the groove, we found another high-density region () with 3.5 times the bulk density value. The site contains two charged residues, E352 and K353, that heavily interact with nearby headgroups (Fig. 2C). To investigate these two sites further, we calculated residence times of lipid headgroups at each position. We considered an encounter an interaction in which a headgroup approaches within 8 of one of the sites and remains for more than 5 ns. Both the and sites have many collisions with lipids, and some events persist for over 80 ns (Fig. S2 B and C), but the majority of these encounters are rather short-lived compared with well-defined binding sites, such as cardiolipin binding to the UraA symporter (29). Moreover, these residence times are comparable to another randomly chosen position at the protein–membrane boundary (; Fig. S2 A and D). Thus, despite increased localization of lipid headgroups at the and sites, lipids at these sites are still quite dynamic.
Fig. 2.
Phosphate density computed from MD simulations reveals headgroup localization. (A) Cross-section of phosphate density overlaid on the nhTMEM16 structure. Two maxima (red) are highlighted at both sides of the hydrophilic groove. (B) Simulation snapshot showing a lipid (yellow) interacting with two residues, E313 and R423, at the extracellular site (). (C) Simulation snapshot showing a lipid (yellow) interacting with two residues, E352 and K353, at the cytoplasmic site ().
Fig. S2.
Residence times of lipid-binding sites compared with control site. (A) Residues forming the dummy site used as a control in the residence time calculations. The methionine and lysine forming this site are circled in red. (B–D) Residence times of lipid headgroups at the , , and a control site, respectively. Two outlier residence times of 248 and 317 ns were omitted from B.
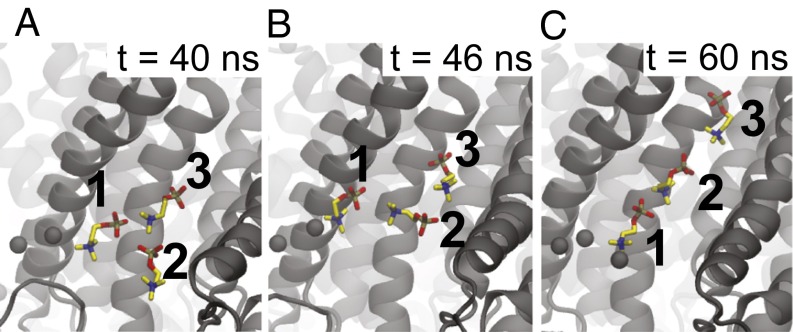
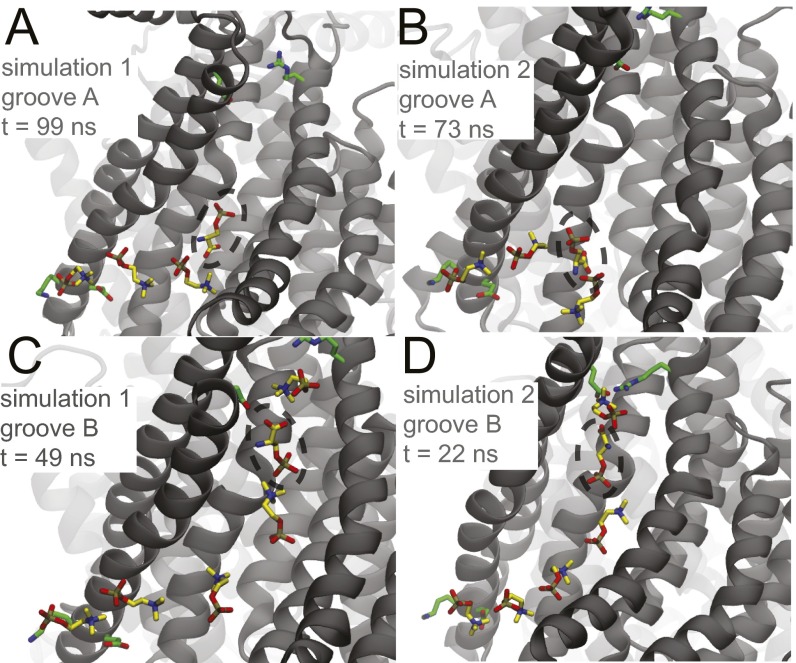
Most revealing, we observed two flopping events where a lipid headgroup fully traversed the hydrophilic groove from the cytoplasmic to the extracellular leaflet (Movie S1 and Fig. S3) and two flipping events where a lipid traversed the groove in the opposite direction (Movie S2). All four events occurred in independent simulations. Once each crossing event started, it took 20–40 ns to complete, indicating that when permeation does occur, it happens quickly. During passage, the headgroup interacts transiently with the hydrophilic side chains in the groove. At one point, the lipid phosphate forms simultaneous hydrogen bonds with T333 and Y439, residues at a narrow constriction point in the groove. Additionally, water penetrates into the groove to further stabilize the headgroup during passage (Fig. S4). Most importantly, the permeating phospholipid forms dipole–dipole interactions with neighboring phospholipid headgroups that grow into the hydrophilic groove in a single-file chain (Fig. 3). The negative charge of the phosphate (gold/red) interacts electrostatically with the positive charge on the choline group (blue/yellow) of the adjacent lipid. Analysis of all of our simulation data revealed that these dipole stacks are a common feature, and they often extend halfway through the groove from the inner leaflet. In one of the two flopping transitions, the third lipid in the stack is the one that transits to the extracellular leaflet (Fig. 3). Initially, lipid 3 is adjacent to lipid 1 (Fig. 3A), but lipid 2 inserts itself between 1 and 3 (Fig. 3B), growing the chain into the groove (Fig. 3C). Next, lipid 3 moves on to the site before entering the outer leaflet, and this jump is catalyzed by transient interactions with hydrophilic side chains and water in the groove. We also see this process happen in reverse for the lipid-flipping events (Fig. S5).
Fig. S3.
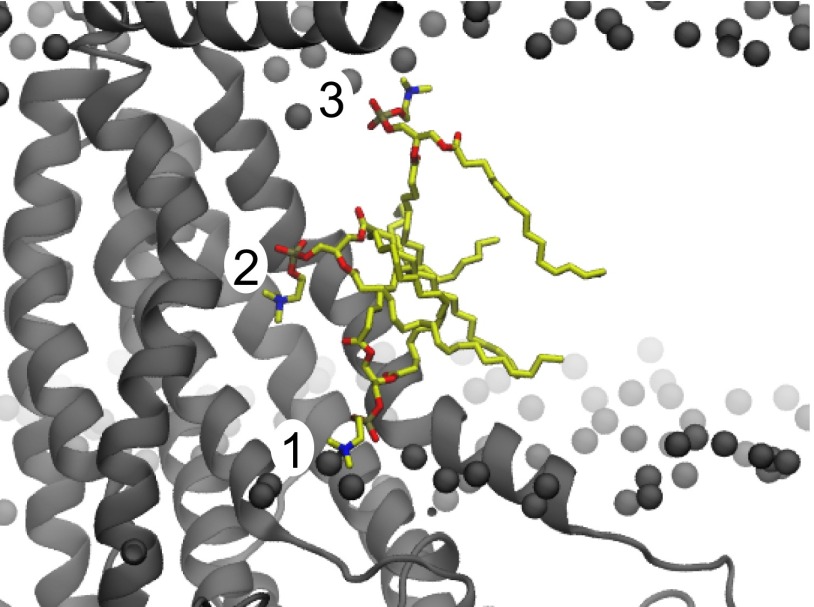
Phospholipid configurations during a flopping event where 1, 2, and 3 are early, middle, and late in the processes, respectively. TM3 and TM4 were removed for clarity.
Fig. S4.
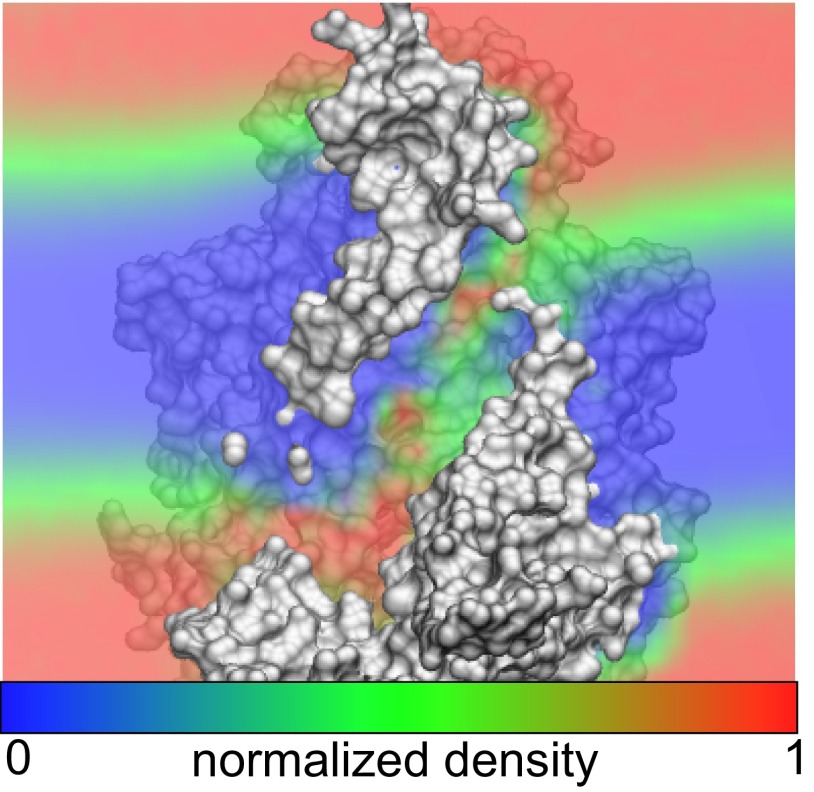
Cross-section of normalized water density overlaid on nhTMEM16 structure. Water enters the hydrophilic groove achieving densities close to bulk values (red) at several locations.
Fig. 3.
Lipid penetration into the groove occurs via a dipole-stacking mechanism. A–C are sequential MD snapshots during the lipid-flopping event. The negative phosphate groups (gold) interact with the positive choline groups (blue) of neighboring lipids. Lipid 2 inserts between lipids 1 and 3 and then stretches out to push lipid 3 far into the groove on the way to the extracellular space over the course of 20 ns. For clarity, only the phosphatidylcholine group is shown. The phosphorus atoms of all other lipids in the cytoplasmic leaflet are shown as black spheres.
Fig. S5.
Atomic details of lipid flipping. A–C are sequential MD snapshots showing dipole stacking during a lipid-flipping event. Before A, lipid 3 crossed the narrow portion of the groove from the site to add itself to the top of the dipole stack already composed of lipids 1 and 2. In B, lipid 2 dissolves from the stack, and then in C, lipid 3 forms a new dipole interaction with lipid 1, resulting in a shorter stack. These interactions closely resemble the time-reversed stacking interactions seen during the lipid-flopping events (Fig. 4).
Tracing these dipole stacks backward, they end at the site (Fig. 4A). We quantified the length of the dipole stack over time and found that the permeation event is associated with extension of the stack to five lipids, at which point the upper lipid moves to the other leaflet and the entire stack retreats (Fig. 4B). The headgroup at the top of the chain is closest to and, thus, is more likely to traverse the hydrophobic core (Fig. 4C). We conjecture that residues at the site at the mouth of the hydrophilic groove may stabilize and orient lipids to nucleate these stacking interactions. To further investigate dipole ordering, we calculated the 3D dipole vector field near the site (Fig. S6). The vector field reveals that lipid dipoles point away from the site into the hydrophilic groove, reaffirming that this is a common feature in all of our simulations. The simulations show that headgroups can insert or remove from any point in the chain, so growth does not always happen as illustrated in Fig. 3.
Fig. 4.
Lipid stacking originates at the site. (A) Stacking headgroup–dipole interactions from Fig. 3 trace back to the . The lipid numbering and the coloring scheme are the same as Fig. 3. (B) Height of the dipole stack in time for the simulation in which a lipid permeates the groove. The permeation event occurs in the gray region. (C) Cartoon model of -mediated dipole stacking. One headgroup binds to . Lipids randomly insert at different locations on the dipole stack. As the stack grows, the top headgroup is placed deeper into the hydrophilic groove.
Fig. S6.
Lipid dipoles align near site. (A) Three-dimensional vector field of PC lipid dipoles at the cytoplasmic end of the hydrophilic groove. Arrows point from the positive to the negative charge. (B) Dipole lipid stack from the . This snapshot is from a simulation where a lipid did not fully permeate. (C) Dipole stack superimposed on the 3D dipole vector field.
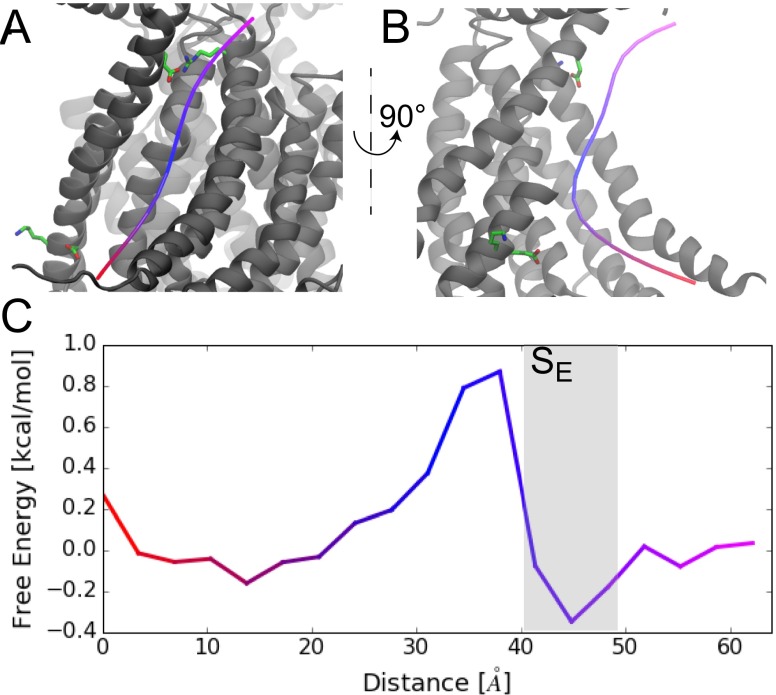
To determine the energetics of lipid translocation, we aligned 4,160 snapshots spaced 1 ns apart from the full 4.16-s unbiased dataset, partitioned space into cubes of side length 2 , and computed the lipid density based on the center of mass of each headgroup. The twofold symmetry of the protein was taken into account to double the configurations used to construct the map. Next, we generated a 3D potential of mean force from the headgroup density in the vicinity of the hydrophilic groove. Using a string method (30–32), we calculated, post analysis, the minimum energy path through this landscape from one leaflet to the other (Fig. S7). The procedure borrows heavily from the method described in ref. 32. Briefly, we started by fitting a straight line through the groove, assigned 20 equally spaced beads along this string, and minimized the pathway by a simulated annealing procedure. We find that the energy profile along the minimized path is smooth with a small barrier on the order of 1 kcal/mol near the midplane of the membrane. This result indicates that lipids are relatively stable in the groove, which is likely a consequence of both dipole stacking and water penetration. The site is adjacent to the barrier and slightly stabilizes lipids by 0.4 kcal/mol relative to bulk.
Fig. S7.
Permeating lipids experience a small energy barrier. (A) Minimum-energy pathway through the hydrophilic groove determined using a string method. (B) Rotated view of the minimum-energy path. The extracellular half of TM4 is removed for clarity. (C) Free-energy profile along the minimum energy path. The color scheme matches the coloring of the path in A and B.
TMEM16 scramblases are largely nonspecific and scramble lipids of varying size and chemistry (33). In particular, PS scrambling is an important cell signal. These headgroups are negatively charged and, thus, cannot form dipole–dipole interactions. To examine the stability of PS in the groove, we ran two 100-ns simulations replacing the headgroup of a single POPC lipid in each hydrophilic groove by a PS headgroup, resulting in a POPS lipid. All four PS lipids remain stable in the groove over the entire simulation, and there is no significant drift away from the midplane (Fig. S8). Either the phosphate or carboxylate of the PS form charge–charge interactions with the choline of the neighboring PC lipid in a stacking-like manner.
Fig. S8.
POPC dipole stacking stabilizes POPS in the hydrophilic groove. Single PC headgroups were replaced with PS (indicated by dashed circles) and restarted for two simulations (two grooves per simulation; four POPS lipids total). Two POPS molecules were placed in the cytoplasmic side of the groove (A and B), and two were placed in the extracellular end (C and D). Simulations were run for 80 ns, and the snapshots were taken at different times after 20 ns of production. Dipole stacks were observed in all four hydrophilic grooves. For C and D, the dipole stacks observed were not present at the beginning of the simulations. Interestingly in B, when POPS in the middle of the dipole chain, the PC dipoles switch directions, as expected. This result could have an important consequence on lipid flipping through the midplane barrier.
Mammalian TMEM16 Family Members Bend Membranes.
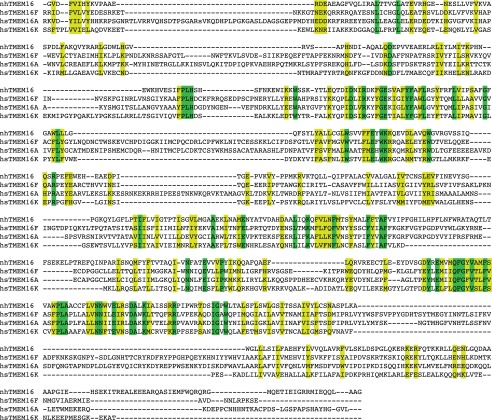
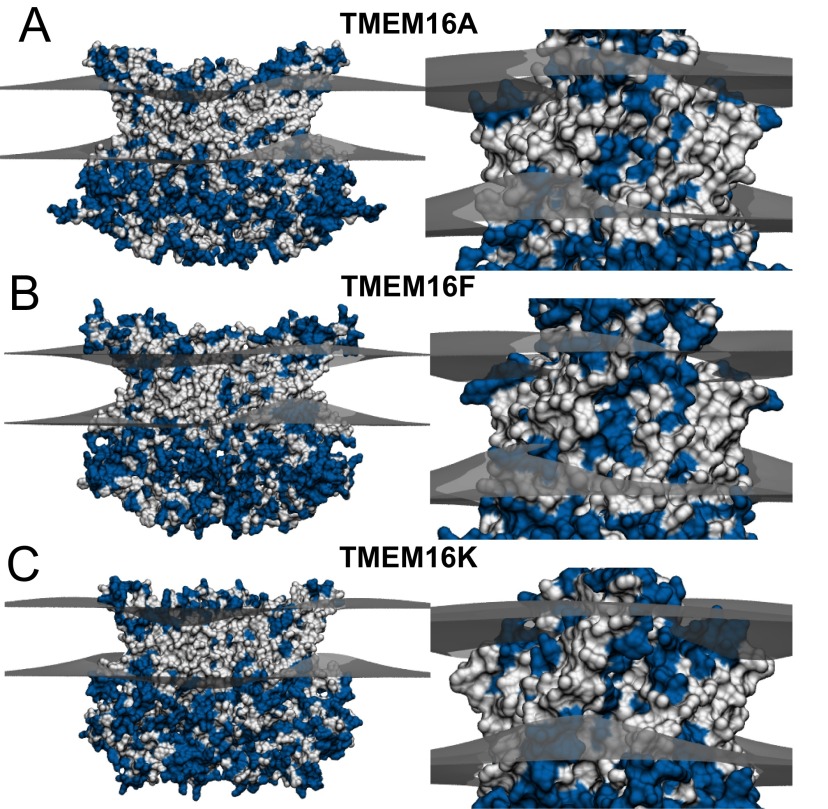
Next, we investigated whether mammalian family members influence the geometry of the membrane. Unfortunately, there are no structures of the mammalian homologs, so we created homology models with MODELLER comparative modeling program (34) using nhTMEM16 as a template structure and the alignments in Fig. S9. Although the sequence identity is rather low (17 to 20.5%), the final models have relatively well-defined hydrophobic transmembrane domains (white regions in Fig. S10), indicating that the gross features of the alignments are likely to be correct. We then used our hybrid continuum-atomistic model to qualitatively predict the deformation around TMEM16A, TMEM16F, and TMEM16K (Fig. S10 A–C, respectively). All three proteins produce significant distortions in the membrane, similar to nhTMEM16, with TMEM16A producing the least energetic distortion (41 kcal/mol), followed by TMEM16K (58 kcal/mol), and finally TMEM16F (75 kcal/mol). In addition, all three proteins thin the membrane at the hydrophilic groove, and the distances of closest approach between headgroup regions are 23.2 , 20.8 , and 20.5 for TMEM16A, TMEM16K, and TMEM16F, respectively. Because TMEM16F has been shown to scramble lipids, it is not surprising that it produces a similar deformation field, and the distortion energy is 25% higher than the value for nhTMEM16. However, although TMEM16A produces an energetic distortion 32% less than that of nhTMEM16, TMEM16A protein does not scramble, so the membrane deformation was unexpected. Likewise, it is not known whether TMEM16K scrambles lipids; however, the bending energy produced by the homology model is comparable to the distortion produced by nhTMEM16, suggesting that it may cause scrambling.
Fig. S9.
Sequence alignment of TMEM16A, TMEM16F, TMEM16K, and nhTMEM16. This alignment was carried out with the program Promals3d (47) using all 10 human TMEM16 family members plus nhTMEM16. No hand adjustments were performed. Strictly conserved residues are highlighted green and homologous residues are yellow.
Fig. S10.
Predicted membrane deformations around mammalian TMEM16 family members based on continuum modeling: TMEM16A (A), TMEM16F (B), and TMEM16K (C). Ninety-degree rotations of each protein showing the hydrophilic groove are displayed to the right. The predicted membrane surfaces at the upper and lower hydrophobic–hydrophilic interfaces are gray. Hydrophobic and hydrophilic residues on the proteins are white and blue, respectively.
Discussion
Global and Local Mechanisms of Lipid Scrambling.
By combining our continuum membrane-bending model with fully atomistic simulation, we discovered two features that likely facilitate lipid scrambling. First, we find that nhTMEM16 twists the membrane around the hydrophilic groove (Fig. 1B). This deformation thins the membrane by 36%, thus providing a shorter pathway for a hydrophilic headgroup to cross. The computed membrane distortion energy value for nhTMEM16 is 8–20 times higher than theoretical and experimental values for gramicidin (25, 35) and rhodopsin (36) and about twice as high as values estimated for the membrane associated gating energy of the mechanosensitive channel of large conductance (MscL) (37, 38). Because the leaflet-to-leaflet distance is still large (18.3 ), thinning is not likely the sole mechanism. The MD simulations also reveal that the hydrophilic groove is flanked by two lipid-interaction sites. The cytoplasmic site appears to coordinate PC headgroups, orienting their dipoles so that they stack up through the groove into the membrane core (Fig. 4A). Our simulations suggest that the site is not an obligate stepping stone because the four lipids that traverse the hydrophilic groove never visit the area, but are simply passed to/from the cytoplasmic leaflet by an existing dipole chain. We frequently observe lipids skirt the site as they enter/leave the groove in part due to its large width at the cytoplasmic leaflet. On the other hand, all four permeating lipids pass through the site. Thus, the extracellular site appears to be a stepping stone for lipids during the scrambling process.
The energy barrier for PC permeation is quite small, revealing that lipids are relatively stable throughout the groove. Based on this profile, we suggest that the rate of permeation is within a factor of 2–10 of the free diffusion value along the pathway. Enhanced kinetic-based simulations will be required to confirm this claim. The simulations also reveal that solo PS lipids are stabilized in the groove through favorable electrostatic interactions with the choline group of the neighboring PC lipid (Fig. S8); however, there are several open questions regarding lipid scrambling for non–PC-like molecules. Because charged lipids like PS cannot form dipole stacks on their own, do they require PC-like lipids to enter the groove? What is the energetic barrier for PS or other lipids? Perhaps copermeation with ions or different lipid types is an important feature. Additional studies are required to quantitatively answer these questions.
Connections to the Mammalian TMEM16 Family Members.
The mammalian TMEM16 proteins are potential therapeutic targets for a range of pathologies, and we attempted to connect our observations on the fungal nhTMEM16 to these mammalian homologs. Homology models of all three proteins produced significant distortions in the membrane (Fig. S10), which was expected for TMEM16F because it has been shown to scramble lipids. TMEM16K function is less clear. No scrambling activity at the plasma membrane was observed using annexin binding assays, which measure PS exposure at the cell surface (39). However, TMEM16K localizes to the endoplasmic reticulum, rather than the plasma membrane, so additional studies must be carried out to determine whether TMEM16K scrambles lipids or permeates molecules.
If TMEM16A conducts ions at the membrane–protein interface via a structure analogous to the hydrophilic groove in nhTMEM16, then there must be key differences within this region that differentiate lipid scrambling from ion conduction. This claim is supported by TMEM16A and TMEM16F chimera studies that tested for scrambling (13). It was found that a stretch of residues on transmembrane helix 3 (TM3) and TM4 are responsible for the lack of scrambling in TMEM16A, and swapping these residues with the corresponding residues in TMEM16F enabled scrambling in TMEM16A. This region was termed the scrambling domain (SCRD), and a subset of residues was found to be essential for lipid scrambling (SCRD*). The site falls in the SCRD* domain, drawing close connections between the simulations and the functional studies (Fig. 5A). The charged glutamate and lysine of the site are present in the robust scramblases (39, 40) but shifted one helix turn into the membrane compared with nhTMEM16. Given the overall alignment of the entire TM4 segment, we believe that this shift is correct, but we acknowledge that it may be an alignment artifact. The other mammalian proteins with little to no scrambling activity, such as TMEM16A, lack an site. In addition, TMEM16A and TMEM16B, another chloride channel, have a glutamate and aspartate pair situated one more helix turn deeper into the membrane than the site in mammalian scramblases. As we have argued, the oppositely charged residues in nhTMEM16 coordinate headgroup geometry to facilitate dipole stacking deep into the hydrophilic groove. The acidic pair of charges in TMEM16A and -B may disrupt phosphate binding to prevent a chain of lipids growing into the groove. It will be interesting to see whether manipulating any of these charged pair sites within the SCRD∗ domain has a strong effect on scrambling in TMEM16A or -F.
Fig. 5.
Sequence alignment of TMEM16 family members at the and sites. (A) The site in nhTMEM16, composed of E352 (red) and K353 (blue), is in TM4. Family members with robust scrambling activity all have an -like site with adjacent glutamate and lysine pairs, whereas this positive and negative pairing is not present in the family members with weak or nonexistent scrambling. The minimal scramblase domain [SCRD* (13)] encompasses the site. (B) The site is composed of residue E313 (red) in TM3 and R432 (blue) in TM6. The charge pairing is conserved in many TMEM16 members, but glutamate is found in TM6 and the arginine in TM3. In both A and B, basic and acidic residues that we suggest influence scrambling activity are highlighted in cyan and red, respectively.
The site is conserved across the mammalian TMEM16s, except in TMEM16K and -H; however, the basic and acidic residues have switched positions compared with the fungal protein (Fig. 5B). Thus, we believe that oppositely charged residues at the extracellular ends of TM3 and TM6 are important for lipid interactions in nearly all family members, but it does not matter in which helix the basic and acidic residues reside. The arginine in TMEM16A (R511), which makes up one-half of the site, was previously shown to be critical for ion selectivity and pore blocker sensitivity (41). It was deduced that R511 forms part of the binding site for the pore blocker 1PBC (PubChem SID 49642647). Combined with our lipid-permeation studies, we believe that the site is important for both lipid permeation and ion conduction.
We wanted to return to our finding that TMEM16A, a nonscramblase, bends the membrane. We hypothesize that membrane bending and thinning across the hydrophilic groove and the coincident location of the extracellular site in scramblase and ion channel members may be related. Thinning may aid in shuttling charged ion and polar headgroups between leaflets. Perhaps lipids interact with the site and penetrate part of the way across the thinned membrane to form a more favorable electrostatic pathway for ions through the low-dielectric hydrophobic core. Although lipids diffuse into and out of the site in our simulations, perhaps in TMEM16A, they are tightly coordinated setting up a nonpermeating set of sites for ions to hop along from one leaflet to the other (42). Additional studies will be needed to test these claims.
Materials and Methods
Continuum membrane-bending calculations were carried out as described in refs. 15–17. Briefly, a physics-based model is used that considers the energy of the protein in the membrane as the sum of three dominant terms:
| [1] |
where is the electrostatic energy, is the nonpolar energy, and is the membrane deformation energy. The membrane deformation and its associated energy are determined by prescribing displacement and contact-angle boundary conditions and solving the Euler–Lagrange equation that comes from a Helfrich-like energy functional (16, 43). Further details on the continuum calculations can be found in SI Materials and Methods.
All MD simulations used the 4WIS structure of nhTMEM16 (7). Missing loops were built with MODELLER 9.15 (34). The structure was embedded in a POPC lipid membrane and solvated in 150 mM KCl using CHARMM-GUI (chemistry at Harvard molecular mechanics–graphical user interface) (44). Two initial systems were constructed of sizes: (i) 335,204 total atoms, 74,394 waters, and 666 lipids; and (ii) 356,426 total atoms, 79,428 waters, and 710 lipids. All simulations were run in the isothermal-isobaric (NPT) ensemble with Amber on GPUs using the CHARMM36 force field (45, 46). The membrane simulation protocol follows closely recent published standards (44). Each system 1 simulation was run for 120 ns each, whereas system 2 simulations were run for 400 ns. There were no noticeable differences between 1 and 2, so all simulations were combined for the analyses, yielding a total aggregate time of 4.16 s. For further details on our simulation setup, please refer to our previous work ref. 17 and SI Materials and Methods.
Homology models were constructed using MODELLER 9.15 (34). A multiple sequence alignment of all 10 human TMEM16 proteins and nhTMEM16 was first performed using the promals3d web server (47), and the results for TMEM16A, -F, -K, and nhTMEM16 are shown in Fig. S9. This alignment was used along with the automodel routine with symmetry constraints to create 3,000 homology models each of TMEM16A, -F, and -K using nhTMEM16 [Protein Data Bank (PDB) ID code 4WIS] as a template. For each protein, the model with the lowest discrete optimized protein energy (DOPE) score was then chosen as the representative structure to carry out the continuum membrane-bending calculations in Fig. S10 (48).
SI Materials and Methods
Continuum Calculations.
Continuum membrane-bending calculations were carried out as described in refs. 15–17. Briefly, a physics-based model is used that considers the energy of the protein in the membrane as the sum of three dominant terms:
| [S1] |
where is the electrostatic energy, is the nonpolar energy, and is the membrane deformation energy. The membrane deformation and its associated energy are determined by prescribing displacement and contact angle boundary conditions and solving the Euler–Lagrange equation that comes from a Helfrich-like energy functional (16, 43). The electrostatic energy is calculated by solving the Poisson–Boltzmann equation using the software package APBS (adaptive Poisson–Boltzmann solver) (49). The nonpolar energy associated with burying portions of the protein in the water-excluded regions of the membrane is assumed to be proportional to the protein’s buried solvent-accessible surface area (SASA):
| [S2] |
where is the SASA of the protein in the membrane, is SASA of the full protein before membrane insertion, and is a surface tension (0.028 kcal/mol) (15, 26, 49). The displacement and contact angle boundary conditions that minimize are determined by optimization staring with a global simulated-annealing method followed by local optimization with Powell’s method (16, 51). All continuum membrane surfaces are the final minimized results computed using the 3.3 X-ray structure of nhTMEM16 (PDB ID code 4WIS) or homology models based on 4WIS.
MD Methods and Analysis.
Eight independent simulations of system 1 and eight of system 2 were equilibrated using the default equilibration scheme provided by CHARMM-GUI for a total 5.075 ns. The last step of equilibration was extended by 4.8 ns with no restraints on the membrane, but a 0.1 kcal/mol/ restraint on the protein backbone heavy atoms to allow the membrane to relax around the protein before production runs. For production, simulations were run using a semiisotropic pressure tensor and the Berendsen barostat. The Langevin thermostat was used with a temperature setting of 303.15 K and a friction coefficient of 1 ps−1. The SHAKE algorithm was used with a 2-fs time step. A nonbonded cutoff of 8 was used and electrostatics were calculated using the particle mesh Ewald method. Two additional simulations were initiated starting from production snapshots from systems 1 and 2 in which a single POPC lipid in the hydrophilic groove was replaced by a POPS lipid. Because the lipid tails of POPS and POPC are identical, only the headgroups were replaced. These systems were equilibrated using the default scheme from CHARMM-GUI for 375 ps, followed by 100 ns of production for each.
Representative membrane surfaces from the MD simulations were calculated by averaging membrane configurations at a 0.2-ps stride as follows. Each snapshot was aligned to the starting structure at time 0 by first centering the transmembrane domain of the protein and then rotating the system about the z axis to minimize the root-mean-squared deviation of the transmembrane domain backbone atoms. We only allowed rotations about the z axis to prevent out of plane rotation of the membrane from frame to frame. For each snapshot, we constructed the upper and lower surfaces where the headgroups meet the lipid tails by considering the collection of C2 carbon atoms of the phospholipid acyl chains. The space between these surfaces defines the hydrophobic core of the membrane. Interpolated surfaces for the upper and lower leaflets were generated using the cubic interpolation function available in SciPy (51). To determine the phosphorus densities in Fig. 2, we followed the same alignment procedure and then binned on the phosphorus positions using a 3D Cartesian array with 2 spacing. The reported density was averaged over all snapshots. The dipole vector field was calculated by taking snapshots from all simulations using 1-ns spacing. We aligned the helices forming the hydrophilic groove then binned lipid headgroups in 3D space and averaged their dipole vector in each bin. Bins with less than 20 lipids were omitted due to poor sampling.
Supplementary Material
Acknowledgments
We thank David Argudo, Frank V. Marcoline, Tina Han, Christian Peters, Jason Tien, John Rosenberg, Lily Jan, Daniel Minor Jr., Marco Mravic, William DeGrado, and Matthew Jacobson for helpful discussions. This work was supported in part by NIH Grants R01-GM117593, R01-GM089740, and T32-EB009389. Computations were performed, in part, at the Texas Advanced Computing Center through the support of National Science Foundation Division of Molecular and Cellular Biosciences Grant MCB-80011 and the Extreme Science and Engineering Discovery Environment.
Footnotes
The authors declare no conflict of interest.
This article is a PNAS Direct Submission.
This article contains supporting information online at www.pnas.org/lookup/suppl/doi:10.1073/pnas.1607574113/-/DCSupplemental.
References
- 1.Bevers EM, Rosing J, Zwaal RFA. Development of procoagulant binding sites on the platelet surface. Adv Exp Med Biol. 1985;192:359–371. doi: 10.1007/978-1-4615-9442-0_25. [DOI] [PubMed] [Google Scholar]
- 2.Yang YD, et al. TMEM16A confers receptor-activated calcium-dependent chloride conductance. Nature. 2008;455(7217):1210–1215. doi: 10.1038/nature07313. [DOI] [PubMed] [Google Scholar]
- 3.Caputo A, et al. TMEM16A, a membrane protein associated with calcium-dependent chloride channel activity. Science. 2008;322(5901):590–594. doi: 10.1126/science.1163518. [DOI] [PubMed] [Google Scholar]
- 4.Schroeder BC, Cheng T, Jan YN, Jan LY. Expression cloning of TMEM16A as a calcium-activated chloride channel subunit. Cell. 2008;134(6):1019–1029. doi: 10.1016/j.cell.2008.09.003. [DOI] [PMC free article] [PubMed] [Google Scholar]
- 5.Yang H, et al. TMEM16F forms a Ca2+-activated cation channel required for lipid scrambling in platelets during blood coagulation. Cell. 2012;151(1):111–122. doi: 10.1016/j.cell.2012.07.036. [DOI] [PMC free article] [PubMed] [Google Scholar]
- 6.Malvezzi M, et al. Ca2+-dependent phospholipid scrambling by a reconstituted TMEM16 ion channel. Nat Commun. 2013;4:2367. doi: 10.1038/ncomms3367. [DOI] [PMC free article] [PubMed] [Google Scholar]
- 7.Brunner JD, Lim NK, Schenck S, Duerst A, Dutzier R. X-ray structure of a calcium-activated TMEM16 lipid scramblase. Nature. 2014;516(7530):207–212. doi: 10.1038/nature13984. [DOI] [PubMed] [Google Scholar]
- 8.Baldridge RD, Graham TR. Identification of residues defining phospholipid flippase substrate specificity of type IV P-type ATPases. Proc Natl Acad Sci USA. 2012;109(6):E290–E298. doi: 10.1073/pnas.1115725109. [DOI] [PMC free article] [PubMed] [Google Scholar]
- 9.MacCallum JL, Bennet WF, Tieleman DP. Partitioning of amino acid side chains into lipid bilayers: Results from computer simulations and comparison to experiment. J Gen Physiol. 2007;129(5):371. doi: 10.1085/jgp.200709745. [DOI] [PMC free article] [PubMed] [Google Scholar]
- 10.Dorairaj S, Allen TW. On the thermodynamic stability of a charged arginine side chain in a transmembrane helix. Proc Natl Acad Sci USA. 2007;104(12):4943–4948. doi: 10.1073/pnas.0610470104. [DOI] [PMC free article] [PubMed] [Google Scholar]
- 11.Hessa T, et al. Recognition of transmembrane helices by the endoplasmic reticulum translocon. Nature. 2005;433(7024):377–381. doi: 10.1038/nature03216. [DOI] [PubMed] [Google Scholar]
- 12.Moon CP, Fleming KG. Side-chain hydrophobicity scale derived from transmembrane protein folding into lipid bilayers. Proc Natl Acad Sci USA. 2011;108(25):10174–10177. doi: 10.1073/pnas.1103979108. [DOI] [PMC free article] [PubMed] [Google Scholar]
- 13.Yu K, et al. Identification of a lipid scrambling domain in ANO6/TMEM16F. Elife. 2015;4:e06901. doi: 10.7554/eLife.06901. [DOI] [PMC free article] [PubMed] [Google Scholar]
- 14.Stansfeld PJ, et al. MemProtMD: Automated insertion of membrane protein structures into explicit lipid membranes. Structure. 2015;23(7):1350–1361. doi: 10.1016/j.str.2015.05.006. [DOI] [PMC free article] [PubMed] [Google Scholar]
- 15.Choe S, Hecht KA, Grabe M. A continuum method for determining membrane protein insertion energies and the problem of charged residues. J Gen Physiol. 2008;131(6):563–573. doi: 10.1085/jgp.200809959. [DOI] [PMC free article] [PubMed] [Google Scholar]
- 16.Callenberg KM, Latorraca NR, Grabe M. Membrane bending is critical for the stability of voltage sensor segments in the membrane. J Gen Physiol. 2012;140(1):55–68. doi: 10.1085/jgp.201110766. [DOI] [PMC free article] [PubMed] [Google Scholar]
- 17.Argudo D, Bethel NP, Marcoline FV, Grabe M. Continuum descriptions of membranes and their interaction with proteins: Towards chemically accurate models. Biochim Biophys Acta. 2016;1858:1619–1634. doi: 10.1016/j.bbamem.2016.02.003. [DOI] [PMC free article] [PubMed] [Google Scholar]
- 18.Kucerka N, Nieh MP, Katsaras J. Fluid phase lipid areas and bilayer thicknesses of commonly used phosphatidylcholines as a function of temperature. Biochim Biophys Acta. 2011;1808:2761–2771. doi: 10.1016/j.bbamem.2011.07.022. [DOI] [PubMed] [Google Scholar]
- 19.Latorraca NR, Callenberg KM, Boyle JP, Grabe M. Continuum approaches to understanding ion and peptide interactions with the membrane. J Membr Biol. 2014;247(5):395–408. doi: 10.1007/s00232-014-9646-z. [DOI] [PMC free article] [PubMed] [Google Scholar]
- 20.Kucerka N, Tristram-Nagle S, Nagle JF. Structure of fully hydrated fluid phase lipid bilayers with monounsaturated chains. J Membr Biol. 2005;208:193–202. doi: 10.1007/s00232-005-7006-8. [DOI] [PubMed] [Google Scholar]
- 21.Mingyang H, Briguglio JJ, Deserno M. Determining the Gaussian curvature modulus of lipid membranes in simulations. Biophys J. 2012;102(6):1403–1410. doi: 10.1016/j.bpj.2012.02.013. [DOI] [PMC free article] [PubMed] [Google Scholar]
- 22.Hu M, de Jong DH, Marrink SJ, Deserno M. Gaussian curvature elasticity determined from global shape transformations and local stress distributions: A comparative study using the MARTINI model. Faraday Discuss. 2013;161:365–382. doi: 10.1039/c2fd20087b. [DOI] [PubMed] [Google Scholar]
- 23.Venable RM, Brown FL, Pastor RW. Mechanical properties of lipid bilayers from molecular dynamics simulation. Chem Phys Lipids. 2015;192:60–74. doi: 10.1016/j.chemphyslip.2015.07.014. [DOI] [PMC free article] [PubMed] [Google Scholar]
- 24.Henriksen J, et al. Universal behavior of membranes with sterols. Biophys J. 2006;90:1639–1649. doi: 10.1529/biophysj.105.067652. [DOI] [PMC free article] [PubMed] [Google Scholar]
- 25.Partenskii MB, Jordan PC. Membrane deformation and the elastic energy of insertion: Perturbation of membrane elastic constants due to peptide insertion. J Chem Phys. 2002;117(23):10768–10776. [Google Scholar]
- 26.Sitkoff D, Sharp KA, Honig B. Accurate calculation of hydration free energies using macroscopic solvent models. J Chem Phys. 1994;98(7):1978–1988. [Google Scholar]
- 27.Stern HA, Feller SE. Calculation of the dielectric permittivity profile for a nonuniform system: Application to a lipid bilayer simulation. J Chem Phys. 2003;118(7):3401–3412. [Google Scholar]
- 28.Doyle DA, et al. The structure of the potassium channel: Molecular basis of K+ conduction and selectivity. Science. 1998;280(5360):69–77. doi: 10.1126/science.280.5360.69. [DOI] [PubMed] [Google Scholar]
- 29.Kalli AC, Sansom MS, Reithmeier RA. Molecular dynamics simulations of the bacterial UraA H+-uracil symporter in lipid bilayers reveal a closed state and a selective interaction with cardiolipin. PLoS Comput Biol. 2015;11(3):e1004123. doi: 10.1371/journal.pcbi.1004123. [DOI] [PMC free article] [PubMed] [Google Scholar]
- 30.Weinan E, Ren W, Vanden-Eijnden E. String method for the study of rare events. Phys Rev B. 2002;66:052301. doi: 10.1021/jp0455430. [DOI] [PubMed] [Google Scholar]
- 31.Maragliano L, Fischer A, Vanden-Eijnden E, Ciccotti G. String method in collective variables: Minimum free energy paths and isocommittor surfaces. J Chem Phys. 2006;125(2):24106. doi: 10.1063/1.2212942. [DOI] [PubMed] [Google Scholar]
- 32.Medovoy D, Perozo E, Roux B. Multi-ion free energy landscapes underscore the microscopic mechanism of ion selectivity in the KcsA channel. Biochim Biophys Acta. 2016;1858(7 Pt B):1722–1732. doi: 10.1016/j.bbamem.2016.02.019. [DOI] [PMC free article] [PubMed] [Google Scholar]
- 33.Suzuki J, Umeda M, Sims PJ, Nagata S. Calcium-dependent phospholipid scrambling by TMEM16F. Nature. 2010;468(7325):834–838. doi: 10.1038/nature09583. [DOI] [PubMed] [Google Scholar]
- 34.Šali A, Blundell TL. Comparative protein modelling by satisfaction of spatial restraints. J Mol Biol. 1993;234(3):779–815. doi: 10.1006/jmbi.1993.1626. [DOI] [PubMed] [Google Scholar]
- 35.Nielsen C, Goulian M, Andersen OS. Energetics of inclusion-induced bilayer deformations. Biophys J. 1998;74(4):1966–1983. doi: 10.1016/S0006-3495(98)77904-4. [DOI] [PMC free article] [PubMed] [Google Scholar]
- 36.Mondal S, Khelashvili G, Shan J, Andersen OS, Weinstein H. Quantitative modeling of membrane deformations by multihelical membrane proteins: Application to G-protein coupled receptors. Biophys J. 2011;101(9):2092–2101. doi: 10.1016/j.bpj.2011.09.037. [DOI] [PMC free article] [PubMed] [Google Scholar]
- 37.Chiang CS, Anishkin A, Sukharev S. Gating of the large mechanosensitive channel in situ: Estimation of the spatial scale of the transition from channel population responses. Biophys J. 2004;86(5):2846–2861. doi: 10.1016/S0006-3495(04)74337-4. [DOI] [PMC free article] [PubMed] [Google Scholar]
- 38.Ursell T, Huang KC, Peterson E, Phillips R. Cooperative gating and spatial organization of membrane proteins through elastic interactions. PLoS Comput Biol. 2007;3(5):e81. doi: 10.1371/journal.pcbi.0030081. [DOI] [PMC free article] [PubMed] [Google Scholar]
- 39.Suzuki J, et al. Calcium-dependent phospholipid scramblase activity of TMEM16 protein family members. J Biol Chem. 2013;288(19):13305–13316. doi: 10.1074/jbc.M113.457937. [DOI] [PMC free article] [PubMed] [Google Scholar]
- 40.Gyobu S, et al. A role of TMEM16E carrying a scrambling domain in sperm motility. Mol Cell Biol. 2015;36(4):645–659. doi: 10.1128/MCB.00919-15. [DOI] [PMC free article] [PubMed] [Google Scholar]
- 41.Peters CJ, et al. Four basic residues critical for the ion selectivity and pore blocker sensitivity of TMEM16A calcium-activated chloride channels. Proc Natl Acad Sci USA. 2015;112(11):3547–3552. doi: 10.1073/pnas.1502291112. [DOI] [PMC free article] [PubMed] [Google Scholar]
- 42.Whitlock JM, Hartzell HC. A Pore idea: The ion conduction pathway of TMEM16/ANO proteins is composed partly of lipid. Pflugers Arch. 2016;468(3):455–473. doi: 10.1007/s00424-015-1777-2. [DOI] [PMC free article] [PubMed] [Google Scholar]
- 43.Huang HW. Deformation free energy of bilayer membrane and its effect on gramicidin channel lifetime. Biophys J. 1986;50(6):1061–1070. doi: 10.1016/S0006-3495(86)83550-0. [DOI] [PMC free article] [PubMed] [Google Scholar]
- 44.Lee J, et al. CHARMM-GUI input generator for NAMD, GROMACS, AMBER, OpenMM, and CHARMM/OpenMM simulations using the CHARMM36 additive force field. J Chem Theory Comput. 2016;12(1):405–413. doi: 10.1021/acs.jctc.5b00935. [DOI] [PMC free article] [PubMed] [Google Scholar]
- 45.Case DA, et al. 2015. Amber 2015 (University of California, San Francisco)
- 46.Klauda JB, et al. Update of the CHARMM all-atom additive force field for lipids: Validation on six lipid types. J Phys Chem B. 2010;114(23):7830–7843. doi: 10.1021/jp101759q. [DOI] [PMC free article] [PubMed] [Google Scholar]
- 47.Pei J, Kim BH, Grishin NV. PROMALS3D: A tool for multiple sequence and structure alignment. Nucleic Acids Res. 2008;36(7):2295–2300. doi: 10.1093/nar/gkn072. [DOI] [PMC free article] [PubMed] [Google Scholar]
- 48.Shen MY, Sali A. Statistical potential for assessment and prediction of protein structures. Protein Sci. 2006;15(11):2507–2524. doi: 10.1110/ps.062416606. [DOI] [PMC free article] [PubMed] [Google Scholar]
- 49.Baker NA, Sept D, Joseph S, Holst MJ, McCammon JA. Electrostatics of nanosystems: Application to microtubules and the ribosome. Proc Natl Acad Sci USA. 2001;98(18):10037–10041. doi: 10.1073/pnas.181342398. [DOI] [PMC free article] [PubMed] [Google Scholar]
- 50.Sitkoff D, Ben-Tal N, Honig B. Calculation of alkane to water solvation free energies using continuum solvent models. J Phys Chem. 1996;100(7):2744–2752. [Google Scholar]
- 51.Kirkpatrick S, Gelatt CD, Vecchi MP. Optimization by simulated annealing. Science. 1983;220(4598):671–680. doi: 10.1126/science.220.4598.671. [DOI] [PubMed] [Google Scholar]
- 52.Jones E, Oliphant T, Peterson P, et al. 2001. SciPy: Open source scientific tools for Python. Available at www.scipy.org. Accessed April 18, 2016.
Associated Data
This section collects any data citations, data availability statements, or supplementary materials included in this article.


