Significance
Despite the importance of sociality in the evolutionary history of life, its molecular basis is still poorly understood. The role of novel genes vs. conserved genes is particularly hotly debated. Here we present evidence that a group of 180 odorant receptor genes in the clonal raider ant are expressed in neurons that have been shown to detect cuticular hydrocarbons, one of the most important classes of ant chemical signals. We show that these genes underwent a period of rapid gene duplication in the ancestors of ants and now comprise 0.5%–1.5% of all genes in ant genomes. This discovery provides a striking example of the importance of novel genes in social evolution.
Keywords: sociogenomics, chemosensation, social evolution, antennal lobe, Formicidae
Abstract
A major aim of sociogenomic research is to uncover common principles in the molecular evolution of sociality. This endeavor has been hampered by the small number of specific genes currently known to function in social behavior. Here we provide several lines of evidence suggesting that ants have evolved a large and novel clade of odorant receptor (OR) genes to perceive hydrocarbon-based pheromones, arguably the most important signals in ant communication. This genomic expansion is also mirrored in the ant brain via a corresponding expansion of a specific cluster of glomeruli in the antennal lobe. We show that in the clonal raider ant, hydrocarbon-sensitive basiconic sensilla are found only on the ventral surface of the female antennal club. Correspondingly, nearly all genes in a clade of 180 ORs within the 9-exon subfamily of ORs are expressed exclusively in females and are highly enriched in expression in the ventral half of the antennal club. Furthermore, we found that across species and sexes, the number of 9-exon ORs expressed in antennae is tightly correlated with the number of glomeruli in the antennal lobe region innervated by odorant receptor neurons from basiconic sensilla. Evolutionary analyses show that this clade underwent a striking gene expansion in the ancestors of all ants and slower but continued expansion in extant ant lineages. This evidence suggests that ants have evolved a large clade of genes to support pheromone perception and that gene duplications have played an important role in the molecular evolution of ant communication.
The field of sociogenomics seeks to understand the molecular basis of sociality, asking how social life evolved and how it is governed at the genomic level (1). A particularly pertinent question in the field is the role of novel genes vs. conserved genes in the evolution and regulation of social behaviors, including communication (2, 3). Communication is important to a broad range of organisms, yet relatively little is known about the genetic components of communication systems and how they evolve. A particularly interesting question in the field is how social signals are perceived and what sort of genetic and physiological specializations facilitate signal perception in highly social organisms (4, 5). In the most tractable sociogenomic models, the eusocial hymenopteran insects, communication is largely chemical, and the genetics and physiology of chemosensation in these species may hold the key to understanding their advanced communication (4, 6, 74).
Much is already known about the insect chemosensory system in general (8, 9). Briefly, chemicals are detected by porous sensory hairs (sensilla) located on chemosensory organs such as the legs, wings, palps, and especially the antennae. The sensilla house the dendrites of olfactory and/or gustatory receptor neurons (ORNs/GRNs) with receptor proteins in the olfactory receptor (OR), the gustatory receptor (GR), or the ionotropic receptor (IR) gene families recognizing specific chemicals. ORNs of the antennae pass signals on to the antennal lobes in the brain. Each ORN expresses a single receptor protein, and all receptor neurons expressing a given receptor protein are believed to innervate a single glomerulus (a roughly spherical bundle of neuron terminals) in the antennal lobe based on research in Drosophila melanogaster. In contrast, many different neurons expressing different receptor proteins may innervate the same sensillum (8–10).
Most of the research on perception of chemical signals (pheromones) in the eusocial Hymenoptera has focused on sensory anatomy and physiology. Extensive work has investigated the higher level olfactory brain centers of bees, wasps, and ants, finding specializations in olfactory processing that are potentially linked to social communication (5). At the level of peripheral detection, several studies in ants (Hymenoptera: Formicidae) have identified sensilla types that respond to specific types of pheromones. The trichoid curvata sensilla, for instance, have been shown to respond to volatile alarm pheromones in the ant Lasius fuliginosus (11). Hydrocarbons are perhaps the most important class of ant pheromones, involved in communicating species, colony, and caste identity as well as reproductive status in a variety of ant species (12–15). Renthal et al. (16) posited that the basiconic sensilla detect low volatility pheromones such as the hydrocarbons used to discriminate nestmates and nonnestmates, based on the fact that they have an ultrastructure appropriate for contact chemosensation and are concentrated in the portion of the antennae used to antennate conspecifics in Solenopsis invicta. Now numerous studies have used electrophysiology to confirm that ant basiconic sensilla are responsive to hydrocarbons (17–19), as well as a broad range of other odorants (19). By pharmacologically blocking the obligate odorant receptor coreceptor ORCO, Sharma et al. (19) were able to show that it is specifically odorant receptors in the basiconic sensilla that are sensitive to hydrocarbons.
In comparison, relatively little is known about the molecular basis of pheromone detection. Although a few studies have sought to implicate various small soluble proteins in pheromone recognition (17, 20–23), it seems more likely that these proteins are involved in generic odorant solubilization and play little role in odor coding (24, 25). The only known hymenopteran pheromone ligand–receptor pair to date is the honey bee (Apis mellifera) queen pheromone 9-ODA and the OR AmelOR11 (26). Zhou et al. (27) investigated the tuning of several ORs in the ants Harpegnathos saltator and Camponotus floridanus, but only found responses to two general odorants. Evolutionary studies have suggested that one clade of ORs, the so-called 9-exon ORs, are likely involved in important aspects of ant biology (27–30). These odorant receptors are particularly expanded in ants relative to other hymenopterans (27–29), and many clades within the 9-exon ORs show signatures of strong positive selection (30). In social Hymenoptera, most social behavior is displayed exclusively by females, and correspondingly, most genes within this group are specifically expressed in females in the ants Harpegnathos saltator and Camponotus floridanus (27). Based on this evidence, it has been proposed that this subfamily of ORs contains candidate hydrocarbon receptors (27–30).
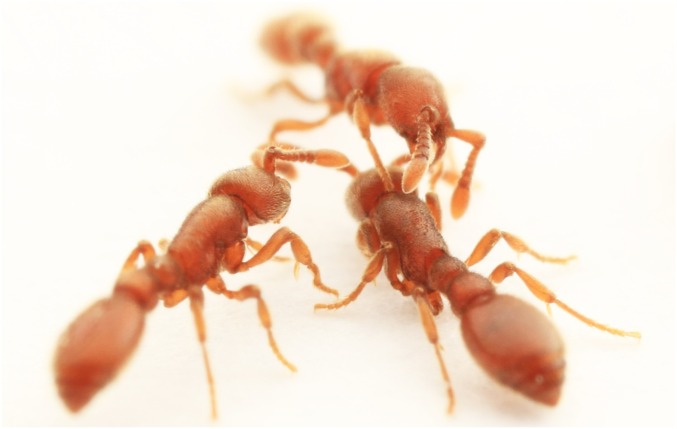
Here we use transcriptomic and neuroanatomical studies of the clonal raider ant Ooceraea biroi (formerly Cerapachys biroi; Fig. 1) (31) along with comparative genomic and evolutionary analyses to elucidate the role of ant ORs in social communication. We found that basiconic sensilla are restricted entirely to the ventral surface of the female antenna in the clonal raider ant, allowing us to look at which genes are expressed near basiconic sensilla. As in other ants, 9-exon ORs were largely expressed specifically in females. Furthermore, all but one gene in a large clade within the 9-exon ORs were highly enriched in the ventral half of the antenna, whereas only one non–9-exon OR showed ventral enrichment. Three-dimensional reconstructions of the antennal lobes of male and female clonal raider ants and retrograde tracing of ORNs from basiconic sensilla revealed a female-specific expansion in a cluster of glomeruli innervated by basiconic sensilla (the T6 cluster), corresponding to the unusually large number of 9-exon ORs expressed in female clonal raider ant antennae. Comparison with data from Camponotus floridanus (27, 32) showed that the number of glomeruli in the T6 cluster is tightly correlated with the number of 9-exon ORs expressed in the antennae. Evolutionary analyses show that this clade in particular underwent rampant gene expansion in the ancestors of ants, with slower but continued expansion in modern ant lineages. Together, this evidence suggests that genes in this clade within the 9-exon OR subfamily are expressed in basiconic sensilla and may function in contact chemosensation in general and nestmate recognition in particular. The diversification of this clade appears to have been contemporaneous with the evolution of ant eusociality, and arguably provides the most striking example of novel genes playing a role in social behavior identified to date.
Fig. 1.
Clonal raider ants antennate each other, tapping each other with the ventral surface of their antennal club.
Results
Basiconic Sensilla Are Absent from Male Antennae and Restricted to the Ventral Surface of Worker Antennae in the Clonal Raider Ant.
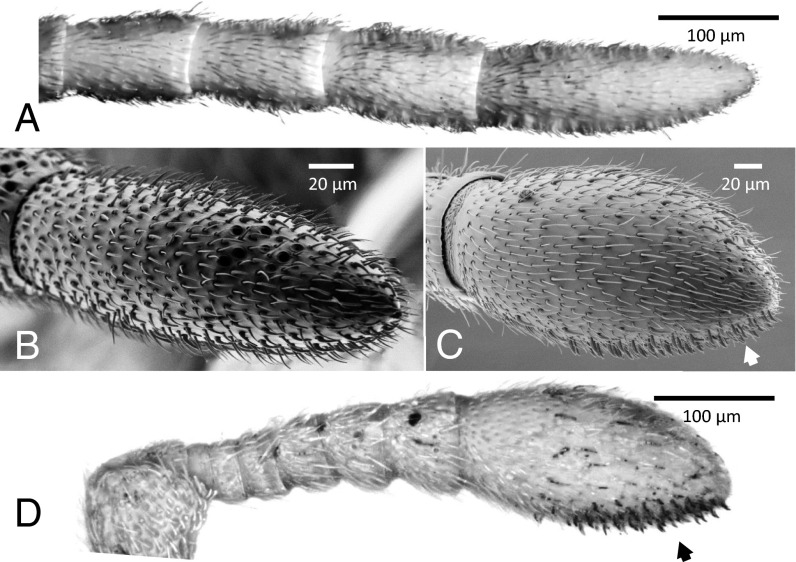
To investigate the basic sensory anatomy of the clonal raider ant, we performed light and scanning electron microscopy on male and worker antennae. We found five distinct morphological types of sensilla similar to those described in other ants: bristles/trichoid sensilla (morphologically indistinguishable in the clonal raider ant), trichoid curvata sensilla, ampullaceal sensilla, coeloconic sensilla, and basiconic sensilla (Fig. 2). Males entirely lack basiconic sensilla (Fig. 2 A and B), as in other ants and bees (16, 33–35). In contrast, workers possess about 65 basiconic sensilla, all clustered in an array on the anterior–ventral surface of the antennal club (Fig. 2 C and D). Silver staining showed that these sensilla are particularly porous (Fig. 2D), as described for S. invicta basiconic sensilla (16). The position of the basiconic sensilla array corresponds to the part of the antenna used to antennate objects, including conspecifics (Figs. 1 and 2 C and D). Although basiconic sensilla are enriched in the anterior–ventral surface in the fire ant (16), complete restriction of basiconic sensilla to a single surface of the antenna has not been described in other ants (16, 33, 36). Ampullaceal and coeloconic sensilla are restricted to the dorsal surface of the antennal club in workers and are found in the largest numbers on the dorsal surface of the terminal antennal segment in males. Trichoid curvata sensilla are restricted to the club in workers but show no obvious dorsal–ventral bias and are distributed across the male antenna. Bristles/trichoid sensilla are distributed evenly across the antenna in both sexes. However, silver staining showed that porous trichoid sensilla are much more abundant on worker antennal clubs than subsequent flagellar segments (Fig. 2D).
Fig. 2.
Sensory anatomy of the clonal raider ant. (A) Light micrograph of the apical four segments of a male antenna, with porous sensilla stained dark with precipitated silver. Note that the staining here is much fainter than in D because males lack the porous basiconic sensilla. (B) Scanning electron micrograph of apical segment of male antenna. (C) Scanning electron micrograph of apical segment of female antenna (antennal club), showing many basiconic sensilla clustered on the ventral surface (arrow). (D) Light micrograph of entire female antennal flagellum, with porous sensilla stained dark with precipitated silver. Darkly stained sensilla on the ventral surface are the particularly porous basiconic sensilla (arrow).
Genes in a Clade of Odorant Receptors Are Expressed in or near Basiconic Sensilla.
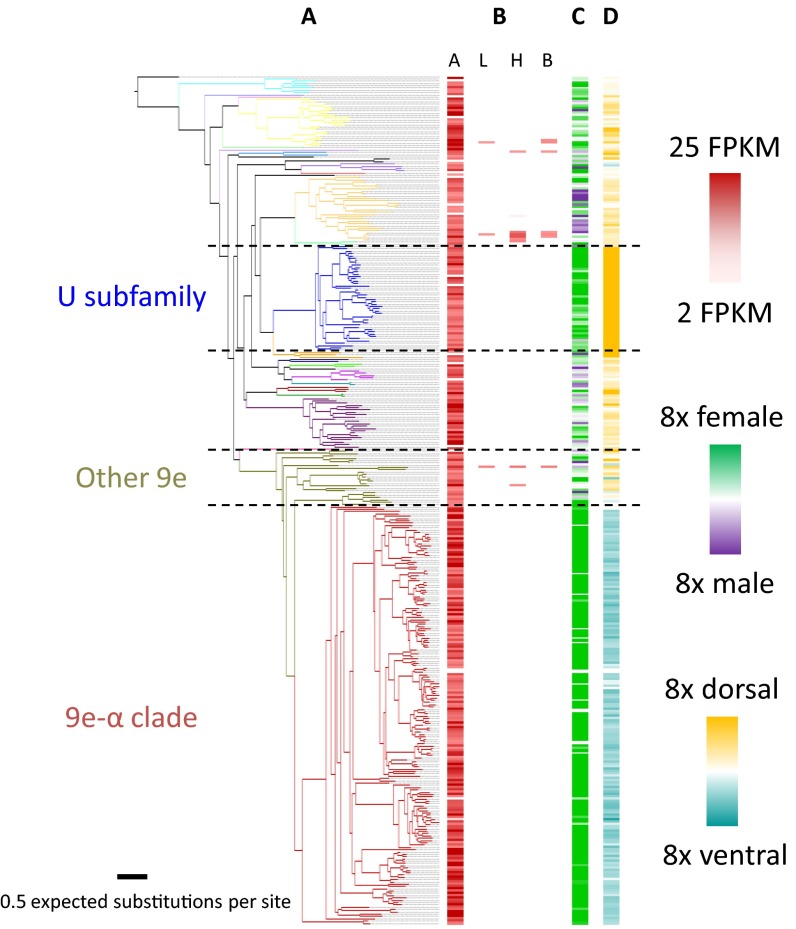
The unique spatial arrangement of basiconic sensilla in the clonal raider ant allowed us to examine whether specific odorant receptors were enriched in expression near basiconic sensilla. We therefore analyzed our previously generated sex-specific and tissue-specific RNA-seq libraries (25) and sequenced mRNA isolated specifically from the dorsal and ventral halves of the antennae. To examine phylogenetic influences on gene expression, these data were mapped onto a phylogeny of all putatively functional clonal raider ant odorant receptors (Fig. 3A). Nearly all odorant receptors were expressed exclusively in the antennae [339 of 350 genes expressed >2 FPKM (fragments per kilobase per million mapped reads); Fig. 3B]. Many genes and entire clades of genes showed strong sex-biased and even sex-specific expression (Fig. 3C). The two most striking examples of sex-biased and sex-specific expression were the entire U subfamily of ORs and a large clade of 180 genes within the 9-exon OR subfamily, which we will refer to as the 9e-α clade. For the U ORs, 38 of 42 genes with detectible expression were specifically expressed in workers, and 3 of the remaining 4 genes were worker biased. For the 9e-α ORs, all but three genes with detectible expression were specific to workers, and the remaining three were strongly worker biased and just over the 2 FPKM detection threshold in males (<2.5 FPKM).
Fig. 3.
Phylogeny and gene expression of clonal raider ant ORs. (A) Maximum likelihood phylogeny of OR genes. Branches are colored by OR subfamily, with the 9-exon subfamily split into 9e-α genes and other 9-exon genes. (B) Tissue-specific gene expression. A, antennae; L, legs; H, heads (minus antennae); B, bodies (abdomen + thorax – legs). Three biological replicates used per condition. (C) Gene expression enrichment in antennae of females vs. males. One biological replicate used per condition. (D) Gene expression enrichment in dorsal vs. ventral halves of female antennal club. Three biological replicates used per condition.
RNA-seq of dorsal and ventral halves of the antennal club revealed that all but one 9e-α OR were enriched in expression in the ventral half of the antenna, 165 consistently so in all three biological replicates and 47 significantly so [false discovery rate (FDR) < 0.05; Fig. 3D]. Five of 27 additional 9-exon ORs were enriched in the ventral half (all consistently enriched, three significantly enriched, FDR < 0.05), and one other OR was nonsignificantly enriched in the ventral half (only in two of three biological replicates, FDR > 0.05). The remaining ORs were all enriched in the dorsal half, 66 being significantly enriched (FDR < 0.05). Intriguingly, the U ORs showed the strongest dorsal enrichment, with all 46 genes consistently dorsally enriched and 38 genes showing significant enrichment (FDR < 0.05; Fig. 3D).
The Number of T6 Glomeruli Correlates with the Number of Expressed 9-Exon ORs.
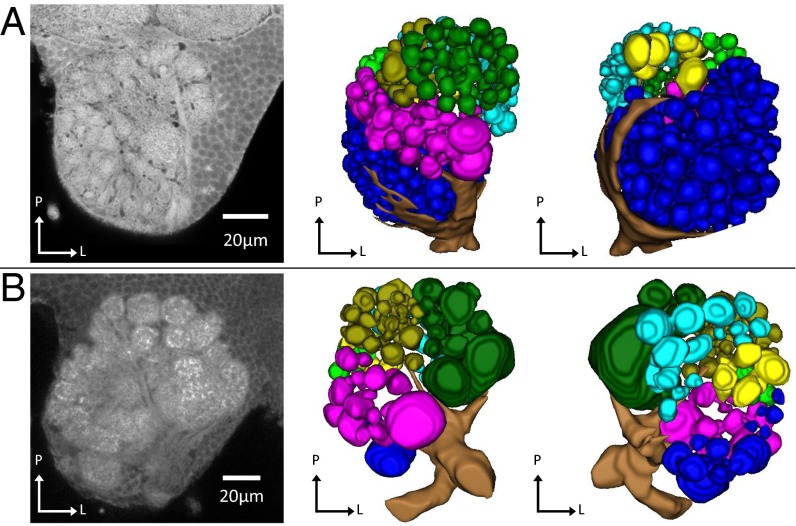
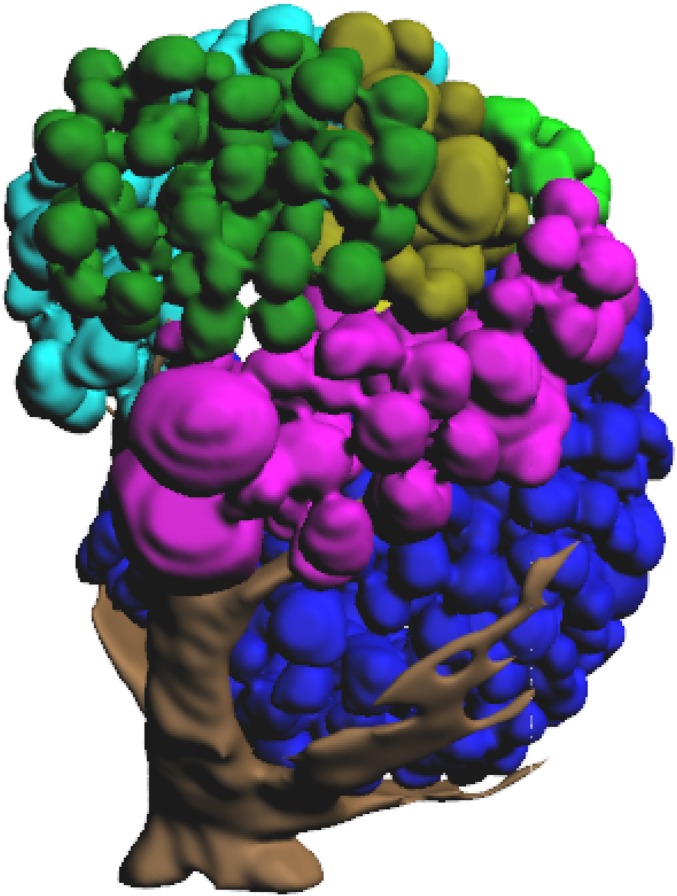
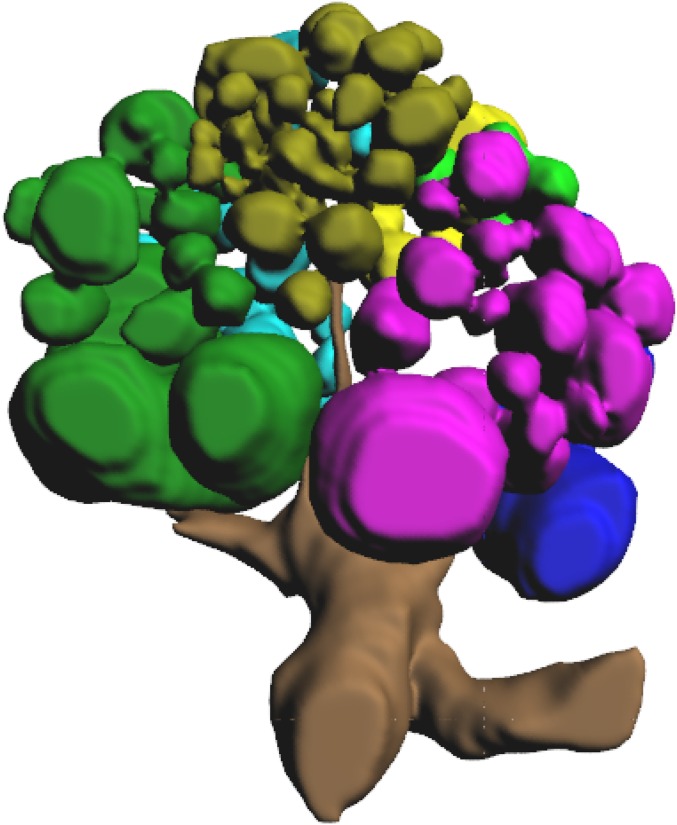
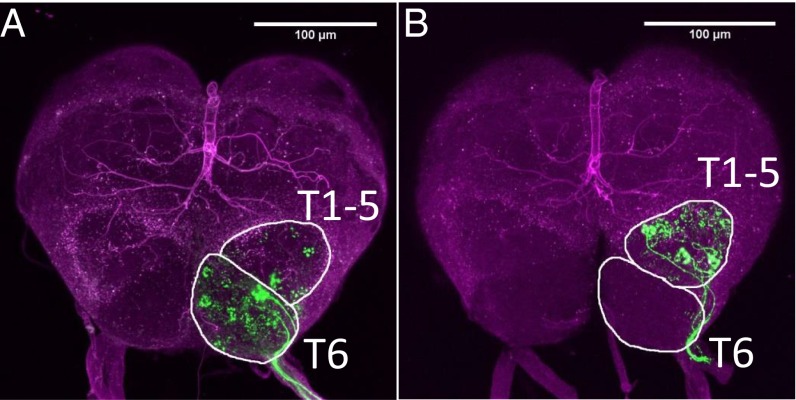
Odorant receptor neurons from basiconic sensilla project specifically to the T6 cluster of glomeruli in the antennal lobe of the leaf cutter ant Atta vollenweideri (37). We thus examined the olfactory neuroanatomy of male and worker clonal raider ants to test for neuroanatomical correlates of OR gene expression. These data were compared with data from Camponotus floridanus (27, 32), because no sex-specific antennal RNA-seq data are available for A. vollenweideri. Three-dimensional reconstruction of a clonal raider ant worker antennal lobe from confocal micrograph stacks revealed 493 glomeruli divided into seven clusters defined by diverging input tracts, similar to what has been described in other ants (32, 37, 38) (Fig. 4A, Table S1, and Fig. S1). The clonal raider ant male, on the other hand, possessed only 121 glomeruli, even fewer than other ant males (32, 38) (Fig. 4B, Table S1, and Fig. S2). As in both Camponotus and Atta, the largest cluster by far in the worker antennal lobe was the T6 cluster, located anterior medially (n-caudal medially). To confirm that this cluster was indeed innervated by ORNs from basiconic sensilla, as described in Atta vollenweideri, we performed retrograde staining of ORNs from ventral sensilla and dorsal sensilla (Fig. 5). Stained ORNs from ventral sensilla (including basiconic sensilla) innervated the entire antennal lobe cluster, including anywhere from 11 to >100 glomeruli in the T6 cluster (median = 25; Fig. 5A). ORNs from dorsal sensilla (excluding basiconic sensilla), on the other hand, projected predominantly to the T1–5 clusters and to only zero to five T6 glomeruli (median = 3; Fig. 5B). A Mann–Whitney u test confirmed that significantly more T6 glomeruli were innervated by ORNs from ventral sensilla (u = 0, P = 0.0079, n = 10). We also measured fluorescence intensity as an alternate quantification approach, and this likewise showed significantly higher relative fluorescence in the T6 cluster following staining of ORNs from ventral sensilla compared with staining of ORNs from dorsal sensilla (Mann–Whitney u test, u = 0, P = 0.0079, n = 10). No glomeruli clearly assignable to the T7 cluster were stained in any preparation.
Fig. 4.
Antennal lobes of (A) female and (B) male clonal raider ants. From Left to Right: representative slices from confocal micrograph stacks used in reconstruction, dorsal (n-ventral) view of 3D reconstruction of glomeruli and antennal nerve, ventral (n-dorsal) view of 3D reconstruction of glomeruli and antennal nerve. P, posterior (n-rostral); M, medial; L, lateral; gold, T1; dark green, T2; purple, T3; cyan, T4; light green, T5; blue, T6; yellow, T7. Figs. S1 and S2 show complete 3D models of female and male antennal lobes, respectively.
Table S1.
Glomeruli numbers and 9-exon, 9e-α, and total gene repertoire sizes for O. biroi, C. floridanus, and two species of Atta
| Species and sex | Glomeruli numbers | Gene repertoire sizes | |||||||||
| T1 | T2 | T3 | T4 | T5 | T6 | T7 | Total | 9-exon | 9e-α | Total | |
| O. biroi | 206 (313) | 180 (281) | 369 (515) | ||||||||
| Worker | 20 | 53 | 55 | 60 | 11 | 288 | 6 | 493 | 185 (258) | 162 (229) | 325 (421) |
| Male | 38 | 16 | 24 | 15 | 4 | 15 | 7 | 119 | 18 (22) | 3 (7) | 103 (122) |
| C. floridanus | 114 (141) | 75 (93) | 354 (407) | ||||||||
| Worker | 34 | 56 | 96 | 78 | 36 | 128 | 6 | 434 | 112 (?) | 74 (?) | 350 (?) |
| Male | 25 | 50 | 56 | 69 | — | 52 | 6 | 258 | 59 (?) | 23 (?) | 293 (?) |
| A. cephalotes | 136 (157) | 89 (99) | 393 (446) | ||||||||
| A. vollenweideri | ? | ? | ? | ||||||||
| Worker | 42–51 | 77–86 | 79–87 | 41–91 | 10–17 | 115–129 | — | 379–443 | ? | ? | ? |
In Atta, glomeruli numbers are from A. vollenweideri workers, whereas gene repertoires are from the A. cephalotes genome. Gene repertoire sizes in the first row for each species represent the number of genes in the genome, with the number of putatively functional genes followed by the number including pseudogenes in parentheses. Repertoire sizes for each sex in O. biroi and C. floridanus represent the number of genes expressed at >2 FPKM in the antenna of the respective sex, again with the number of putatively functional genes followed by the number including pseudogenes in parentheses. Information on the expression levels of pseudogenes was not available in C. floridanus. No antennal expression data are available for A. cephalotes. Glomeruli numbers for C. floridanus and A. vollenweideri are from Zube and Rössler (32) and Kelber et al. (37).
Fig. S1.
3D reconstruction of the antennal lobe of a worker clonal raider ant. Glomeruli colored by input tract: gold, T1; dark green, T2; purple, T3; cyan, T4; light green, T5; blue, T6; yellow, T7.
Fig. S2.
3D reconstruction of the antennal lobe of a male clonal raider ant. Glomeruli colored by input tract: gold, T1; dark green, T2; purple, T3; cyan, T4; light green, T5; blue, T6; yellow, T7.
Fig. 5.
Retrograde staining of ORNs (green) from (A) ventral and (B) dorsal sensilla to the antennal lobe of the clonal raider ant worker. Glomerular clusters T1–5 and T6 are outlined in white and brain autofluorescence is shown in purple. No neurons clearly assignable to T7 were stained in this experiment. (A) ORNs from sensilla on the ventral surface of the clonal raider ant worker antenna project to many glomeruli in the T6 cluster and several glomeruli in clusters T1–5. (B) ORNs from sensilla on the dorsal surface project to many glomeruli in clusters T1–5 and few or no glomeruli in cluster T6.
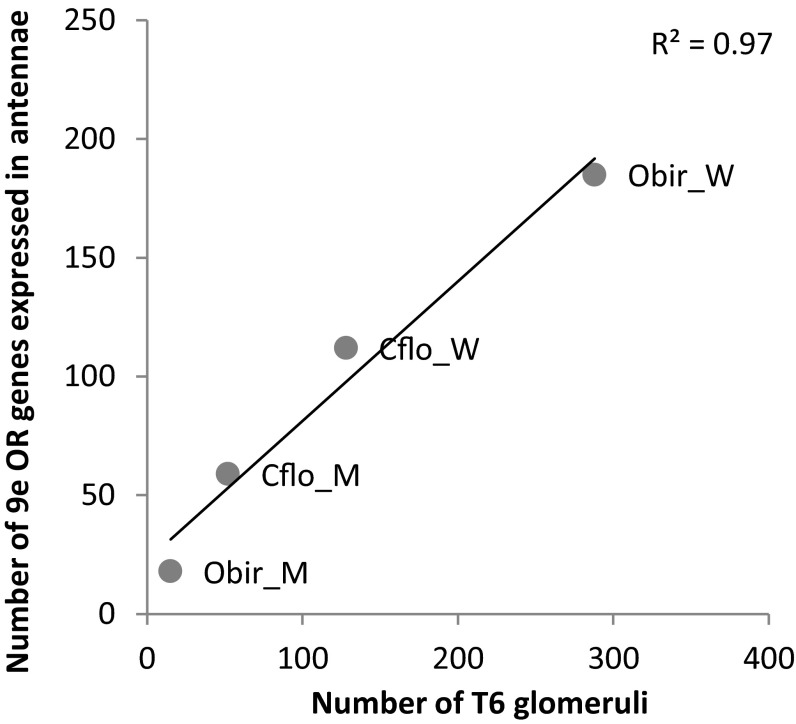
The T6 cluster of glomeruli is particularly large in clonal raider ant workers, corresponding to the expansion in 9-exon odorant receptors (Table S1). Comparison with data from C. floridanus (27, 32) showed that the number of T6 glomeruli is strongly correlated with the number of putatively functional 9-exon OR genes expressed in the antennae (Pearson's r; R2 = 0.97, P = 0.015; Fig. 6). However, this relationship is not one-to-one, as there are usually more T6 glomeruli than putatively functional 9-exon ORs.
Fig. 6.
Number of 9-exon ORs expressed in antennae vs. number of T6 glomeruli in the antennal lobe of male and worker Florida carpenter ants (Camponotus floridanus) and clonal raider ants (Ooceraea biroi) with linear regression line. Obir_M, male clonal raider ant; Obir_W, worker clonal raider ant; Cflo_M, male Florida carpenter ant; Cflo_W, worker Florida carpenter ant.
9e-α ORs Underwent a Massive Expansion in the Ancestors of Ants.
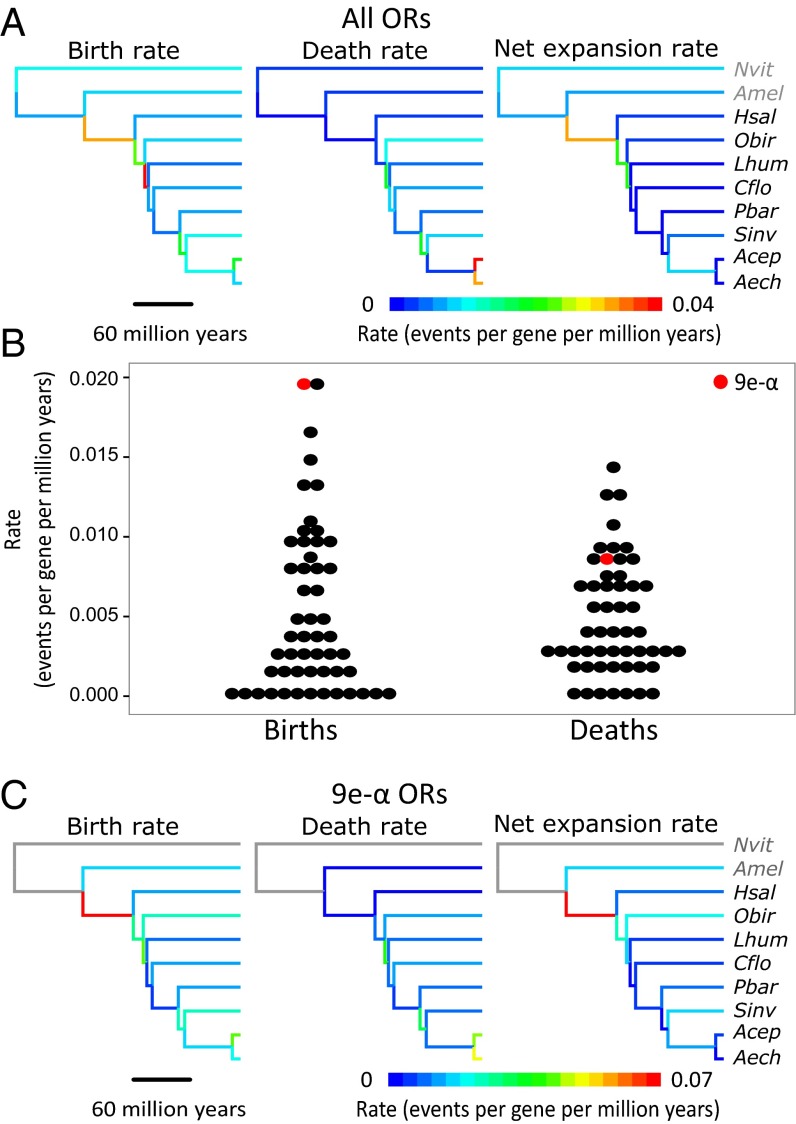
The OR gene repertoire has expanded more than threefold in the ancestors of ants (27, 31, 39). However, evolutionary histories of individual gene lineages have not been systematically investigated. We constructed a maximum-likelihood gene tree and parsimoniously reconciled the 70% bootstrap consensus gene tree with the species tree to analyze birth and death dynamics in OR genes using Notung (40). We recovered a tree topology and family-wide birth and death rates similar to Zhou et al. (27) (Datasets S1 and S2 and Fig. 7A). Notably, we found a high expansion rate along the branch leading to ants (Fig. 7A). The 9e-α clade was recovered as an aculeate-specific clade with 99% bootstrap support (Dataset S1). The consensus topology was consistent with the 9e-α clade being derived from a single gene in the most recent common ancestor (MRCA) of ants and bees, with a most parsimonious scenario of three 9e-α genes in the ant/bee MRCA, and a maximum of 26 genes. We divided odorant receptors into 53 groups that were consistent with being descended from single genes present in the MRCA of ants and bees (at ≥70% bootstrap support; Dataset S1). Analysis of birth and death rates of these groups showed that the 9e-α clade has exceptionally high gene birth rates but not particularly high gene death rates (Fig. 7B). The peak of expansion in the 9e-α ORs occurred in the ancestors of ants, with slower but continued expansion in subsequent lineages (Fig. 7C).
Fig. 7.
Evolutionary dynamics of ant odorant receptors. (A and C) Phylogeny of studied Hymenoptera with branches colored by birth rate, death rate, or net expansion rate (events per gene per million years) for (A) all odorant receptors and (C) 9e-α odorant receptors. Nonaculeate Hymenoptera branches in C are gray because 9e-α ORs evolved within the aculeate Hymenoptera. (B) Dot plot of birth rate and death rate within each of the 53 groups that were consistent with being descended from single genes present in the MRCA of ants and bees (at ≥70% bootstrap support; Dataset S1). Nvit, Nasonia vitripennis; Amel, Apis mellifera; Hsal, Harpegnathos saltator; Obir, Ooceraea biroi; Lhum, Linepithema humile; Cflo, Camponotus floridanus; Pbar, Pogonomyrmex barbatus; Sinv, Solenopsis invicta; Acep, Atta cephalotes; Aech, Acromyrmex echinatior.
Discussion
The unique morphology of the clonal raider ant antenna, with all pheromone-sensitive basiconic sensilla restricted to the ventral half of the female antennal club, allowed us to examine associations between sensilla types and odorant receptor gene expression. We found a large clade of odorant receptors within the 9-exon OR subfamily, the 9e-α ORs, that were expressed nearly exclusively in female antennae and showed strong ventral-biased expression within the antennal club. We also found that the number of 9-exon ORs expressed in the antennae strongly correlates with the number of glomeruli in the antennal lobe cluster innervated by ORNs from basiconic sensilla, the T6 cluster. This correlation provides further evidence that 9e-α ORs are expressed in basiconic sensilla. Evolutionary analyses indicate that 9e-α ORs have expanded from a few genes, and possibly a single gene, in the MRCA of ants and bees to as many as 180 genes in extant ants. Our results suggest that expansion within the OR genes has been important in shaping ant social evolution by providing ants with a large number of OR genes that are expressed in basiconic sensilla and potentially detect cuticular hydrocarbons and other low-volatility chemicals.
Genes for Hydrocarbon Recognition.
Ants are known to produce more than 1,000 different hydrocarbons that can be involved in social communication, ranging from nestmate recognition, species discrimination, task allocation, to reproductive signaling (12–15, 41). Discovering the molecular basis for hydrocarbon recognition has thus been a priority of the research community (4). Electrophysiological studies have pinpointed the neurons involved in hydrocarbon detection, showing that they are housed in female-specific basiconic sensilla (17–19). Meanwhile, 9-exon ORs have been proposed as candidate hydrocarbon receptors based on evolutionary studies (27–30). Here we integrate these previous findings by showing that genes in a clade within the 9-exon ORs, the 9e-α ORs, are nearly all female specific and biased in expression toward the ventral half of the antennal club in the clonal raider ant (Fig. 3), which contains all of the basiconic sensilla (Fig. 2). The three 9e-α ORs we did detect in male antennae were just barely above our detection threshold of 2 FPKM, and we suspect that they were spuriously classified as being expressed. Only a single OR outside the 9-exon subfamily showed any ventral bias, and this was inconsistent across biological replicates (two of three), suggesting that 9-exon ORs may be the only ORs expressed in basiconic sensilla in the clonal raider ant. Five of 26 9-exon ORs outside the 9e-α clade were ventrally enriched, all consistently so and three significantly so. These findings suggest an evolutionary scenario where a few 9-exon ORs were expressed in the basiconic sensilla of the solitary ancestral aculeate wasps, facilitating primitive hydrocarbon distinction, likely for prey or mate recognition, with one lineage then expanding in the ancestors of ants to form the 9e-α clade.
Kelber et al. (37) traced ORNs from individual sensilla in the leaf cutter ant Atta vollenweideri to show that all ORNs originating in basiconic sensilla terminate in the anterior–medial (n-caudal–medial) cluster of glomeruli designated as the T6 cluster. Our stainings of ORNs from ventral and dorsal sensilla support the projection of basiconic sensilla ORNs to T6 glomeruli (Fig. 5). We further found a strong correlation between the number of T6 glomeruli and the number of putatively functional 9-exon ORs expressed in the antennae, providing additional evidence that 9-exon ORs are expressed in basiconic sensilla (Figs. 4 and 6). In most cases, the number of T6 glomeruli was higher than the number of putatively functional 9-exon ORs, which contrasts with the expectation of one receptor–one glomerulus based on Drosophila melanogaster (10). However, the entire antennal lobes of both C. floridanus and O. biroi have more glomeruli than expressed putatively functional canonical chemosensory genes (refs. 27 and 32 and this study). This discrepancy could be due to ORNs expressing genes classified as pseudogenes still projecting to unique glomeruli, or due to genes missing from the current draft genome assemblies (as discussed in refs. 27 and 42). It should be noted that the described correlation is based on all 9-exon OR genes and not just 9e-α genes or those ventrally biased in our gene expression data, i.e., it probably includes some genes that are expressed in other sensilla types. This is consistent with the finding of Kelber et al. (37) that some ORNs from trichoid curvata sensilla also project to the T6 cluster.
Gene Expansion and Social Evolution.
A long-standing debate in the field of sociogenomics is the importance of conserved genes vs. novel genes in social evolution (2, 3). Researchers have tried to address this question primarily by either looking for signatures of positive selection associated with the evolution of sociality (43, 44) or by looking for genes that are differentially expressed between different morphological and behavioral castes (45, 46). An alternative approach is to find genes with specific functions in social behavior and to examine their evolution. However, this undertaking has been difficult because functional genetics in social insects is still in its infancy. Here we present evidence suggesting that a specific clade of genes is involved in an important aspect of social communication in ants: the detection of hydrocarbons. Based on this finding, we then examined the course of evolution of these genes using comparative genomics and phylogenetic methods. We find that a single lineage of OR genes, the 9e-α lineage, has undergone massive expansion in the ancestors of ants, with continued expansion in subsequent ant lineages (Fig. 7).
Engsontia et al. (31) examined patterns of positive selection in ant ORs and found seven lineages under positive selection, all of which fall into the 9e-α clade. Additionally, Zhou et al. (39) found that the 9-exon subfamily has the highest selection coefficient of all ant OR subfamilies. Although some analyses have indicated that ant ORs do not undergo higher positive selection than those of solitary hymenopterans (39, 43), Zhou et al. (39) found evidence for higher positive selection in ORs in the ancestors of extant ants, consistent with our finding of rapid gene expansion along that branch.
Our findings, taken together with those of previous evolutionary studies (31, 39), suggest that dynamic gene family evolution, including gene expansion and sequence evolution, has played an essential role in the evolution of ant communication and sociality. This discovery provides further evidence for the importance of chemical communication in ant biology, as well as a striking example of the role of novel genes in the evolution of social behavior.
Methods
Antennal morphology procedures largely followed Renthal et al. (16) and Navasero and Elzen (47) and are detailed in SI Methods. Gene expression was analyzed using Tophat, Cufflinks, and Cuffdiff (48–50). Details of the RNA-seq experimental setup and analysis are given in SI Methods. Brain anatomy was investigated by confocal laser scanning microscopy of stained and autofluorescent tissues with analyses in the Fiji distribution of ImageJ (NIH) (51). These procedures and analyses are described in detail in SI Methods. New gene annotation followed Oxley et al. (42) and new annotations are provided in Datasets S3 and S4. Phylogenetic analyses were conducted with RAxML (52), and birth and death rates were calculated by parsimoniously inferring birth and death events along reconciled gene and species trees using Notung (40). Details of these analyses are also given in SI Methods. All other statistics were performed in R (53). Coordinates in the text and figures are given in body axis, with neuroaxis coordinates in parentheses.
SI Methods
Antennal Morphology.
Silver staining and light microscopy of antennae was performed largely following Navasero and Elzen (47). In brief, isolated ant antennae were washed with ethanol and then washed 3 × 10 s in acetone. Samples were then incubated in 0.1 M silver nitrate solution for 5–10 min, washed 3 × 10 min in deionized water, incubated in Kodak D-76 photographic developing solution for 5 min, washed in 3% (vol/vol) acetic acid for 1 min, dehydrated serially in ethanol, and finally air dried and imaged in air on glass slides. Imaging was performed using an Olympus BX53 compound microscope with backlight plus epifluorescent illumination through a FITC filter at 100× and 200× magnification. As described by Renthal et al. (16), the green autofluorescence of the cuticle formed a bright background against which dark silver precipitate that forms within porous sensilla could be seen. Serial focus stacks were taken manually and then combined using Helicon Focus (Helicon Soft).
For scanning electron microscopy of antennae, whole heads were fixed in 4% (wt/vol) formalin in sodium cacodylate buffer, washed 3 × 5 min in deionized water, serially dehydrated in ethanol, and then mounted on carbon tape at various angles and sputter coated with 1–2 nm gold-palladium. Imaging was performed on a ZEISS LEO 1550 scanning electron microscope.
Gene Expression.
Tissue- and sex-specific gene expression data were obtained from McKenzie et al. (25). This study included one male antennal library and one female antennal library for the sex-specific analysis, as well as three libraries for each female tissue type examined [antennae, heads (minus antennae), bodies (thoraces and abdomens), and legs]. For gene expression of ventral vs. dorsal halves of the female antennal club, antennae were dissected from cold-anesthetized ants and positioned for cutting inside a droplet of OCT (optimal cutting temperature) medium (TissueTek) on an inverted Petri dish. A plaster insert that had been chilled on dry ice was then placed under the sample, freezing the OCT. The embedded antennal club was then split and separated from the antenna by hand using a cryostat razor blade under a dissecting microscope. To test the accuracy of this procedure, 10 antennae were silver stained and split following this protocol, and both halves imaged as described above. For sequencing, each antennal club half was immediately transferred to cold TRIzol reagent (Life Technologies) following dissection. Samples were then homogenized using a TissueLyser II (Qiagen), and the aqueous phase was recovered using Phase Lock columns (5Prime) and purified using the RNeasy kit (Qiagen) following the manufacturers’ protocol. Libraries were then constructed using the Clontech SMART kit and sequenced on an Illumina HiSeq2500. We pooled 20 antenna halves per library, and sequenced two libraries (one dorsal half and one ventral half) for each of three biological replicates (one per clonal lineage; MLL1, MLL4, and MLL6 in ref. 50). All libraries were run on a single HiSeq2500 lane, generating 38–43 million single-end 100-bp reads per library. Reads were aligned to the O. biroi reference genome (assembly V3.0) using Tophat (48) with prealignment to OGS 1.8.6 (42). Cufflinks (49) was then used to quantify gene expression, and CuffDiff (50) was used to test for significant differences in expression. RNAseq reads are deposited in the National Center for Biotechnology Information sequence read archive (Bioproject accession no. PRJNA345039).
Neuroanatomy.
For visualization and 3D reconstruction of the female antennal lobe, brains were dissected in PBS, pH 7.4, fixed in 1% glutaraldehyde in PBS solution for 7 d at room temperature, washed in PBS (three times for 10 min), and dehydrated in an ascending series of ethanol [30%, 50%, 70%, 90%, 95%, and 2 × 100% (vol/vol); 10 min each step]. Finally, brains were cleared in methyl salicylate (M-2047; Sigma Aldrich). The antennal lobe was imaged by using a Zeiss LSM 710 confocal microscope, with individual glomeruli visualized by autofluorescence. Males are produced exceedingly rarely in O. biroi (54), and we were unable to obtain a male brain for preparation in the same manner as the female brains. We thus used a phalloidin-stained male brain previously prepared for a separate experiment. The male brain was dissected in cold PBS, pH 7.4, fixed by incubation in 4% (wt/vol) paraformaldehyde solution in PBS overnight, washed in PBS and 0.5% Triton-X at room temperature (3 × 20 min), incubated in 1% BSA in PBS for 30 min, washed in PBS 0.01% Tween for 5 min, incubated overnight with a primary antibody containing solution in 1% BSA and 0.5% Triton-X in PBS solution, washed with PBS Tween (3 × 10 min), incubated with a secondary antibody solution containing Alexa Fluor 555 phalloidin (Thermo Fisher Scientific) 1 μL (of stock solution 6.6 µM) in 100 mL of 1% BSA and 0.5% Triton-X in PBS solution for 2 h, washed five times in PBS, and mounted with Dako mounting medium. The antennal lobe was imaged using a Zeiss LSM 710 confocal microscope. Only the phalloidin staining was analyzed in this paper.
Glomeruli were reconstructed from image stacks of a representative female and male brain by manually outlining each glomerulus in the segmentation editor of the Fiji distribution of ImageJ (NIH) (51). Glomeruli were sorted into input tracts by following input fibers through focus stacks. In some cases innervating input tracts were unclear and we then relied on visible segregation and clustering of glomeruli. Assignment of glomeruli on the borders of the clusters is thus likely imprecise, especially for input tracks T1, T3, and T4. In the female, a visible sulcus separated the T5 and T6 clusters from the remaining clusters; thus, the separation of T6 glomeruli was clear except for a few glomeruli bordering the T5 cluster. These glomeruli were assigned to the T5 cluster to provide a conservative estimate of T6 glomeruli numbers. In the male, T6 glomeruli were visibly separated from the remaining glomeruli in 3D renderings.
Tracing was performed by immobilizing ants at 4 °C in viscoelastic liquid silicone (Silly Putty) with one antenna stretched out against double-sided tape. Either the dorsal or the ventral surface of the antennal club was then scraped with a razor to break sensilla, and then a drop of microruby (rhodamine dextran with biotin, 3,000 MW, D7162; Thermo Fisher Scientific) in distilled water was applied over the scraped area. Ants were incubated like this at 4 °C in a humid box for 15 min and then allowed to move freely in a humid dish for 8–12 h at room temperature. Brains and antennae were then dissected, and the antennae were visually inspected to confirm sensilla breakage. Brains were then fixed in 4% (wt/vol) paraformaldehyde for 4 h, dehydrated in an ascending ethanol series (50%, 70%, 90%, 95%, and 3 × 100% (vol/vol)], cleared and mounted in methyl salicylate, and imaged as described above. Innervated glomeruli were counted manually from the confocal image stacks. Fluorescent quantification was performed using the MeasureStack pluggin in ImageJ. Fluorescence of each ipsilateral antennal lobe compartment was normalized to the entire contralateral antennal lobe to account for baseline fluorescence.
Evolutionary analyses.
Odorant receptor gene sequences from five ant species (Harpegnathos saltator, Ooceraea biroi, Linepithema humile, Camponotus floridanus, and Pogonomyrmex barbatus) and two hymenopteran outgroups (Nasonia vitripennis and Apis mellifera) were obtained from Robertson et al. (55), Zhou et al. (27), Oxley et al. (42), Smith et al. (28), and Smith et al. (29). Odorant receptors from Solenopsis invicta, Atta cephalotes, and Acromyrmex echinatior were manually annotated as part of the current study following Oxley et al. (42). Briefly, genomes were downloaded from hymenopteragenome.org, and existing OR protein sequences from other ant species aligned to the genomes using Exonerate (56) and tblastn (57). Models were then constructed manually in the Apollo genome editor (58), guided by alignment evidence, and visually compared with other models using Muscle alignment (59) when necessary. Protein sequences for all newly annotated genes can be found in Dataset S3, and gff3 lines for the annotations are in Dataset S4. For all ant species, nonpseudogenized sequences were aligned by OR subfamily (sensu 27) using the Mafft algorithm (version 7) with linsi parameter settings (local pairwise alignment, maximum of 1,000 iterations, all other parameters default) (60). Then all subfamily alignments were profile aligned by using the Mafft seed alignment algorithm, again using the linsi parameters.
For copy number analyses, pseudogenes were added to the previously described alignment with the Mafft add algorithm with linsi parameters. A maximum likelihood phylogenetic hypothesis was then constructed using RAxML default tree search algorithm with the LG model of protein evolution (61) and gamma-distributed substitution rates. Node support was tested using the RAxML rapid bootstrap algorithm (62) with 100 rapid bootstrap replicates.
Existing model-based tools for statistical estimation of gene birth and death rates either fail to take gene trees into account [e.g., computational analysis of gene family evolution (CAFE)] (63) or are computationally infeasible for such large gene expansions (e.g., jprime delirious) (64). We thus reconstructed birth and death events by calculating the most parsimonious reconciliation of the gene tree with the species tree using Notung (v2.8.1.7) (40). Because many nodes of the gene tree are poorly resolved, we used a 70% bootstrap consensus gene tree resolved using Notung’s “resolve” algorithm, with duplication and loss costs set to defaults. Birth and death event counts are therefore conservative estimations. Ant species relationships in the species tree followed Brady et al. (65),and the BEAST-estimated topology of Moreau and Bell (66). Birth, death, and net expansion rates were calculated as the number of times the repertoire has doubled (birth and net expansion rates, calculated including or excluding lineages that subsequently went extinct, respectively) or halved (death rate) along a branch or set of branches divided by branch length. Thus, the birth rate along a specific branch is calculated as
Aculeate divergence times were taken from Moreau and Bell’s divergence dates using their BEAST estimated tree topology (66), whereas the Nasonia-Aculeata divergence time followed Ronquist et al. (67).
Supplementary Material
Acknowledgments
We thank Leslie Vosshall for project advice and support, Waring Trible and Vikram Chandra for helpful comments on the manuscript, and Peter Oxley for advice on protocols and analyses. We also thank the Vosshall and Funabiki laboratories for use of equipment and reagents, the Steller laboratory for use of their confocal microscope, and the Rockefeller University Genomics Resource Center, Bio-Imaging Resource Center, and Electron Microscopy Resource Center for help with RNA-seq, confocal microscopy, and scanning electron microscopy, respectively. S.K.M. was supported by NIH National Research Service Award Training Grant GM066699. This work was also supported by a Women & Science postdoctoral fellowship (to I.F.-P.), as well as NIH Grant 1DP2GM105454-01, a Searle Scholar award, a Klingenstein-Simons fellowship award in the Neurosciences, a Sinsheimer Scholar award, and a Pew Biomedical Scholar award (all to D.J.C.K.). V.R. is a New York Stem Cell Foundation–Robertson Investigator. This is Clonal Raider Ant Project paper 5.
Footnotes
The authors declare no conflict of interest.
This article is a PNAS Direct Submission.
Data deposition: The sequence provided here has been deposited on the National Center for Biotechnology Information (NCBI) sequence read archive, www.ncbi.nlm.nih.gov/sra (accession no. PRJNA345039).
See Commentary on page 13947.
This article contains supporting information online at www.pnas.org/lookup/suppl/doi:10.1073/pnas.1610800113/-/DCSupplemental.
References
- 1.Robinson GE, Grozinger CM, Whitfield CW. Sociogenomics: Social life in molecular terms. Nat Rev Genet. 2005;6(4):257–270. doi: 10.1038/nrg1575. [DOI] [PubMed] [Google Scholar]
- 2.Robinson GE, Ben-Shahar Y. Social behavior and comparative genomics: New genes or new gene regulation? Genes Brain Behav. 2002;1(4):197–203. doi: 10.1034/j.1601-183x.2002.10401.x. [DOI] [PubMed] [Google Scholar]
- 3.Sumner S. The importance of genomic novelty in social evolution. Mol Ecol. 2014;23(1):26–28. doi: 10.1111/mec.12580. [DOI] [PubMed] [Google Scholar]
- 4.Tsutsui ND. Dissecting ant recognition systems in the age of genomics. Biol Lett. 2013;9(6):20130416. doi: 10.1098/rsbl.2013.0416. [DOI] [PMC free article] [PubMed] [Google Scholar]
- 5.Galizia CG, Rössler W. Parallel olfactory systems in insects: Anatomy and function. Annu Rev Entomol. 2010;55:399–420. doi: 10.1146/annurev-ento-112408-085442. [DOI] [PubMed] [Google Scholar]
- 6.Richard FJ, Hunt JH. Intracolony chemical communication in social insects. Insectes Soc. 2013;60(3):275–291. [Google Scholar]
- 7.Libbrecht R, Oxley PR, Kronauer DJC, Keller L. Ant genomics sheds light on the molecular regulation of social organization. Genome Biol. 2013;14(7):212. doi: 10.1186/gb-2013-14-7-212. [DOI] [PMC free article] [PubMed] [Google Scholar]
- 8.Pelosi P, Zhou JJ, Ban LP, Calvello M. Soluble proteins in insect chemical communication. Cell Mol Life Sci. 2006;63(14):1658–1676. doi: 10.1007/s00018-005-5607-0. [DOI] [PMC free article] [PubMed] [Google Scholar]
- 9.Leal WS. Odorant reception in insects: Roles of receptors, binding proteins, and degrading enzymes. Annu Rev Entomol. 2013;58:373–391. doi: 10.1146/annurev-ento-120811-153635. [DOI] [PubMed] [Google Scholar]
- 10.Fishilevich E, Vosshall LB. Genetic and functional subdivision of the Drosophila antennal lobe. Curr Biol. 2005;15(17):1548–1553. doi: 10.1016/j.cub.2005.07.066. [DOI] [PubMed] [Google Scholar]
- 11.Dumpert K. Alarmstoffrezeptoren auf der Antenne von Lasius fuliginosus (Latr.) (Hymenoptera, Formicidae) Z Vgl Physiol. 1972;76:403–425. [Google Scholar]
- 12.van Zweden JS, d’Ettorre P. Nestmate recognition in social insects and the role of hydrocarbons. In: Blomquist GJ, Bagnères AG, editors. Insect Hydrocarbons: Biology, Biochemistry, and Chemical Ecology. Cambridge Univ Press; Cambridge, UK: 2010. pp. 222–243. [Google Scholar]
- 13.Liebig J. Hydrocarbon profiles indicate fertility and dominance status in ant, bee, and wasp colonies. In: Blomquist GJ, Bagnères AG, editors. Insect Hydrocarbons: Biology, Biochemistry, and Chemical Ecology. Cambridge Univ Press; Cambridge, UK: 2010. pp. 254–281. [Google Scholar]
- 14.Sturgis SJ, Gordon DM. Nestmate recognition in ants (Hymenoptera:Formicidae): A review. Myrmecol News. 2012;16:101–110. [Google Scholar]
- 15.Le Conte Y, Hefetz A. Primer pheromones in social hymenoptera. Annu Rev Entomol. 2008;53:523–542. doi: 10.1146/annurev.ento.52.110405.091434. [DOI] [PubMed] [Google Scholar]
- 16.Renthal R, Velasquez D, Olmos D, Hampton J, Wergin WP. Structure and distribution of antennal sensilla of the red imported fire ant. Micron. 2003;34(8):405–413. doi: 10.1016/S0968-4328(03)00050-7. [DOI] [PubMed] [Google Scholar]
- 17.Ozaki M, et al. Ant nestmate and non-nestmate discrimination by a chemosensory sensillum. Science. 2005;309(5732):311–314. doi: 10.1126/science.1105244. [DOI] [PubMed] [Google Scholar]
- 18.Kidokoro-Kobayashi M, et al. Chemical discrimination and aggressiveness via cuticular hydrocarbons in a supercolony-forming ant, Formica yessensis. PLoS One. 2012;7(10):e46840. doi: 10.1371/journal.pone.0046840. [DOI] [PMC free article] [PubMed] [Google Scholar]
- 19.Sharma KR, et al. Cuticular hydrocarbon pheromones for social behavior and their coding in the ant antenna. Cell Reports. 2015;12(8):1261–1271. doi: 10.1016/j.celrep.2015.07.031. [DOI] [PubMed] [Google Scholar]
- 20.Danty E, et al. Cloning and expression of a queen pheromone-binding protein in the honeybee: An olfactory-specific, developmentally regulated protein. J Neurosci. 1999;19(17):7468–7475. doi: 10.1523/JNEUROSCI.19-17-07468.1999. [DOI] [PMC free article] [PubMed] [Google Scholar]
- 21.Briand L, et al. Characterization of a chemosensory protein (ASP3c) from honeybee (Apis mellifera L.) as a brood pheromone carrier. Eur J Biochem. 2002;269(18):4586–4596. doi: 10.1046/j.1432-1033.2002.03156.x. [DOI] [PubMed] [Google Scholar]
- 22.Krieger MJ, Ross KG. Identification of a major gene regulating complex social behavior. Science. 2002;295(5553):328–332. doi: 10.1126/science.1065247. [DOI] [PubMed] [Google Scholar]
- 23.Ishida Y, et al. Niemann-Pick type C2 protein mediating chemical communication in the worker ant. Proc Natl Acad Sci USA. 2014;111(10):3847–3852. doi: 10.1073/pnas.1323928111. [DOI] [PMC free article] [PubMed] [Google Scholar]
- 24.Gomez-Diaz C, Reina JH, Cambillau C, Benton R. Ligands for pheromone-sensing neurons are not conformationally activated odorant binding proteins. PLoS Biol. 2013;11(4):e1001546. doi: 10.1371/journal.pbio.1001546. [DOI] [PMC free article] [PubMed] [Google Scholar]
- 25.McKenzie SK, Oxley PR, Kronauer DJC. Comparative genomics and transcriptomics in ants provide new insights into the evolution and function of odorant binding and chemosensory proteins. BMC Genomics. 2014;15(1):718. doi: 10.1186/1471-2164-15-718. [DOI] [PMC free article] [PubMed] [Google Scholar]
- 26.Wanner KW, et al. A honey bee odorant receptor for the queen substance 9-oxo-2-decenoic acid. Proc Natl Acad Sci USA. 2007;104(36):14383–14388. doi: 10.1073/pnas.0705459104. [DOI] [PMC free article] [PubMed] [Google Scholar]
- 27.Zhou X, et al. Phylogenetic and transcriptomic analysis of chemosensory receptors in a pair of divergent ant species reveals sex-specific signatures of odor coding. PLoS Genet. 2012;8(8):e1002930. doi: 10.1371/journal.pgen.1002930. [DOI] [PMC free article] [PubMed] [Google Scholar]
- 28.Smith CD, et al. Draft genome of the globally widespread and invasive Argentine ant (Linepithema humile) Proc Natl Acad Sci USA. 2011;108(14):5673–5678. doi: 10.1073/pnas.1008617108. [DOI] [PMC free article] [PubMed] [Google Scholar]
- 29.Smith CR, et al. Draft genome of the red harvester ant Pogonomyrmex barbatus. Proc Natl Acad Sci USA. 2011;108(14):5667–5672. doi: 10.1073/pnas.1007901108. [DOI] [PMC free article] [PubMed] [Google Scholar]
- 30.Engsontia P, Sangket U, Robertson HM, Satasook C. Diversification of the ant odorant receptor gene family and positive selection on candidate cuticular hydrocarbon receptors. BMC Res Notes. 2015;8:380. doi: 10.1186/s13104-015-1371-x. [DOI] [PMC free article] [PubMed] [Google Scholar]
- 31.Borowiec ML. Generic revision of the ant subfamily Dorylinae (Hymenoptera, Formicidae) ZooKeys. 2016;608(608):1–280. doi: 10.3897/zookeys.608.9427. [DOI] [PMC free article] [PubMed] [Google Scholar]
- 32.Zube C, Rössler W. Caste- and sex-specific adaptations within the olfactory pathway in the brain of the ant Camponotus floridanus. Arthropod Struct Dev. 2008;37(6):469–479. doi: 10.1016/j.asd.2008.05.004. [DOI] [PubMed] [Google Scholar]
- 33.Nakanishi A, Nishino H, Watanabe H, Yokohari F, Nishikawa M. Sex-specific antennal sensory system in the ant Camponotus japonicus: Structure and distribution of sensilla on the flagellum. Cell Tissue Res. 2009;338(1):79–97. doi: 10.1007/s00441-009-0863-1. [DOI] [PubMed] [Google Scholar]
- 34.Ågren L. Flagerllar sensilla of some Colletidae (Hymenoptera:Apoidea) Int J Insect Morphol Embryol. 1977;6(3):137–146. [Google Scholar]
- 35.Ågren L, Hallberg E. Flagellar sensilla of bumble bee males. Apidologie (Celle) 1996;27:433–444. [Google Scholar]
- 36.Hashimoto Y. Unique features of sensilla on the antennae of Formicidae (Hymenoptera) Appl Entomol Zool (Jpn) 1990;25(4):491–501. [Google Scholar]
- 37.Kelber C, Rössler W, Kleineidam CJ. Phenotypic plasticity in number of glomeruli and sensory innervation of the antennal lobe in leaf-cutting ant workers (A. vollenweideri) Dev Neurobiol. 2010;70(4):222–234. doi: 10.1002/dneu.20782. [DOI] [PubMed] [Google Scholar]
- 38.Nakanishi A, Nishino H, Watanabe H, Yokohari F, Nishikawa M. Sex-specific antennal sensory system in the ant Camponotus japonicus: Glomerular organizations of antennal lobes. J Comp Neurol. 2010;518(12):2186–2201. doi: 10.1002/cne.22326. [DOI] [PubMed] [Google Scholar]
- 39.Zhou X, et al. Chemoreceptor evolution in hymenoptera and its implications for the evolution of eusociality. Genome Biol Evol. 2015;7(8):2407–2416. doi: 10.1093/gbe/evv149. [DOI] [PMC free article] [PubMed] [Google Scholar]
- 40.Chen K, Durand D, Farach-Colton M. NOTUNG: A program for dating gene duplications and optimizing gene family trees. J Comput Biol. 2000;7(3-4):429–447. doi: 10.1089/106652700750050871. [DOI] [PubMed] [Google Scholar]
- 41.Martin S, Drijfhout F. A review of ant cuticular hydrocarbons. J Chem Ecol. 2009;35(10):1151–1161. doi: 10.1007/s10886-009-9695-4. [DOI] [PubMed] [Google Scholar]
- 42.Oxley PR, et al. The genome of the clonal raider ant Cerapachys biroi. Curr Biol. 2014;24(4):451–458. doi: 10.1016/j.cub.2014.01.018. [DOI] [PMC free article] [PubMed] [Google Scholar]
- 43.Roux J, et al. Patterns of positive selection in seven ant genomes. Mol Biol Evol. 2014;31(7):1661–1685. doi: 10.1093/molbev/msu141. [DOI] [PMC free article] [PubMed] [Google Scholar]
- 44.Kocher SD, et al. The draft genome of a socially polymorphic halictid bee, Lasioglossum albipes. Genome Biol. 2013;14(12):R142. doi: 10.1186/gb-2013-14-12-r142. [DOI] [PMC free article] [PubMed] [Google Scholar]
- 45.Berens AJ, Hunt JH, Toth AL. Comparative transcriptomics of convergent evolution: Different genes but conserved pathways underlie caste phenotypes across lineages of eusocial insects. Mol Biol Evol. 2015;32(3):690–703. doi: 10.1093/molbev/msu330. [DOI] [PubMed] [Google Scholar]
- 46.Morandin C, et al. Comparative transcriptomics reveals the conserved building blocks involved in parallel evolution of diverse phenotypic traits in ants. Genome Biol. 2016;17:43. doi: 10.1186/s13059-016-0902-7. [DOI] [PMC free article] [PubMed] [Google Scholar]
- 47.Navasero R, Elzen G. Sensilla on the antennae, foretarsi, and palpi of Microplitis croceipes (Cresson) (Hymenoptera: Braconidae) Proc Entomol Soc Wash. 1991;93(3):737–747. [Google Scholar]
- 48.Trapnell C, Pachter L, Salzberg SL. TopHat: Discovering splice junctions with RNA-Seq. Bioinformatics. 2009;25(9):1105–1111. doi: 10.1093/bioinformatics/btp120. [DOI] [PMC free article] [PubMed] [Google Scholar]
- 49.Trapnell C, et al. Transcript assembly and quantification by RNA-Seq reveals unannotated transcripts and isoform switching during cell differentiation. Nat Biotechnol. 2010;28(5):511–515. doi: 10.1038/nbt.1621. [DOI] [PMC free article] [PubMed] [Google Scholar]
- 50.Trapnell C, et al. Differential gene and transcript expression analysis of RNA-seq experiments with TopHat and Cufflinks. Nat Protoc. 2012;7(3):562–578. doi: 10.1038/nprot.2012.016. [DOI] [PMC free article] [PubMed] [Google Scholar]
- 51.Schindelin J, et al. Fiji: An open-source platform for biological-image analysis. Nat Methods. 2012;9(7):676–682. doi: 10.1038/nmeth.2019. [DOI] [PMC free article] [PubMed] [Google Scholar]
- 52.Stamatakis A. RAxML version 8: A tool for phylogenetic analysis and post-analysis of large phylogenies. Bioinformatics. 2014;30(9):1312–1313. doi: 10.1093/bioinformatics/btu033. [DOI] [PMC free article] [PubMed] [Google Scholar]
- 53.R Core Team . R: A Language and Environment for Statistical Computing. R Core Team; Vienna: 2016. [Google Scholar]
- 54.Kronauer DJC, Pierce NE, Keller L. Asexual reproduction in introduced and native populations of the ant Cerapachys biroi. Mol Ecol. 2012;21(21):5221–5235. doi: 10.1111/mec.12041. [DOI] [PubMed] [Google Scholar]
- 55.Robertson HM, Gadau J, Wanner KW. The insect chemoreceptor superfamily of the parasitoid jewel wasp Nasonia vitripennis. Insect Mol Biol. 2010;19(Suppl 1):121–136. doi: 10.1111/j.1365-2583.2009.00979.x. [DOI] [PubMed] [Google Scholar]
- 56.Slater GS, Birney E. Automated generation of heuristics for biological sequence comparison. BMC Bioinformatics. 2005;6(1):31. doi: 10.1186/1471-2105-6-31. [DOI] [PMC free article] [PubMed] [Google Scholar]
- 57.Altschul SF, Gish W, Miller W, Myers EW, Lipman DJ. Basic local alignment search tool. J Mol Biol. 1990;215(3):403–410. doi: 10.1016/S0022-2836(05)80360-2. [DOI] [PubMed] [Google Scholar]
- 58.Lee E, Harris N, Gibson M, Chetty R, Lewis S. Apollo: A community resource for genome annotation editing. Bioinformatics. 2009;25(14):1836–1837. doi: 10.1093/bioinformatics/btp314. [DOI] [PMC free article] [PubMed] [Google Scholar]
- 59.Edgar RC. MUSCLE: Multiple sequence alignment with high accuracy and high throughput. Nucleic Acids Res. 2004;32(5):1792–1797. doi: 10.1093/nar/gkh340. [DOI] [PMC free article] [PubMed] [Google Scholar]
- 60.Katoh K, Kuma K, Toh H, Miyata T. MAFFT version 5: Improvement in accuracy of multiple sequence alignment. Nucleic Acids Res. 2005;33(2):511–518. doi: 10.1093/nar/gki198. [DOI] [PMC free article] [PubMed] [Google Scholar]
- 61.Le SQ, Gascuel O. An improved general amino acid replacement matrix. Mol Biol Evol. 2008;25(7):1307–1320. doi: 10.1093/molbev/msn067. [DOI] [PubMed] [Google Scholar]
- 62.Stamatakis A, Hoover P, Rougemont J. A rapid bootstrap algorithm for the RAxML Web servers. Syst Biol. 2008;57(5):758–771. doi: 10.1080/10635150802429642. [DOI] [PubMed] [Google Scholar]
- 63.Han MV, Thomas GW, Lugo-Martinez J, Hahn MW. Estimating gene gain and loss rates in the presence of error in genome assembly and annotation using CAFE 3. Mol Biol Evol. 2013;30(8):1987–1997. doi: 10.1093/molbev/mst100. [DOI] [PubMed] [Google Scholar]
- 64.Sjöstrand J, Sennblad B, Arvestad L, Lagergren J. DLRS: Gene tree evolution in light of a species tree. Bioinformatics. 2012;28(22):2994–2995. doi: 10.1093/bioinformatics/bts548. [DOI] [PubMed] [Google Scholar]
- 65.Brady SG, Schultz TR, Fisher BL, Ward PS. Evaluating alternative hypotheses for the early evolution and diversification of ants. Proc Natl Acad Sci USA. 2006;103(48):18172–18177. doi: 10.1073/pnas.0605858103. [DOI] [PMC free article] [PubMed] [Google Scholar]
- 66.Moreau CS, Bell CD. Testing the museum versus cradle tropical biological diversity hypothesis: Phylogeny, diversification, and ancestral biogeographic range evolution of the ants. Evolution. 2013;67(8):2240–2257. doi: 10.1111/evo.12105. [DOI] [PubMed] [Google Scholar]
- 67.Ronquist F, et al. A total-evidence approach to dating with fossils, applied to the early radiation of the hymenoptera. Syst Biol. 2012;61(6):973–999. doi: 10.1093/sysbio/sys058. [DOI] [PMC free article] [PubMed] [Google Scholar]
Associated Data
This section collects any data citations, data availability statements, or supplementary materials included in this article.


